Races in Layton, Utah (UT) Detailed Stats
Data:
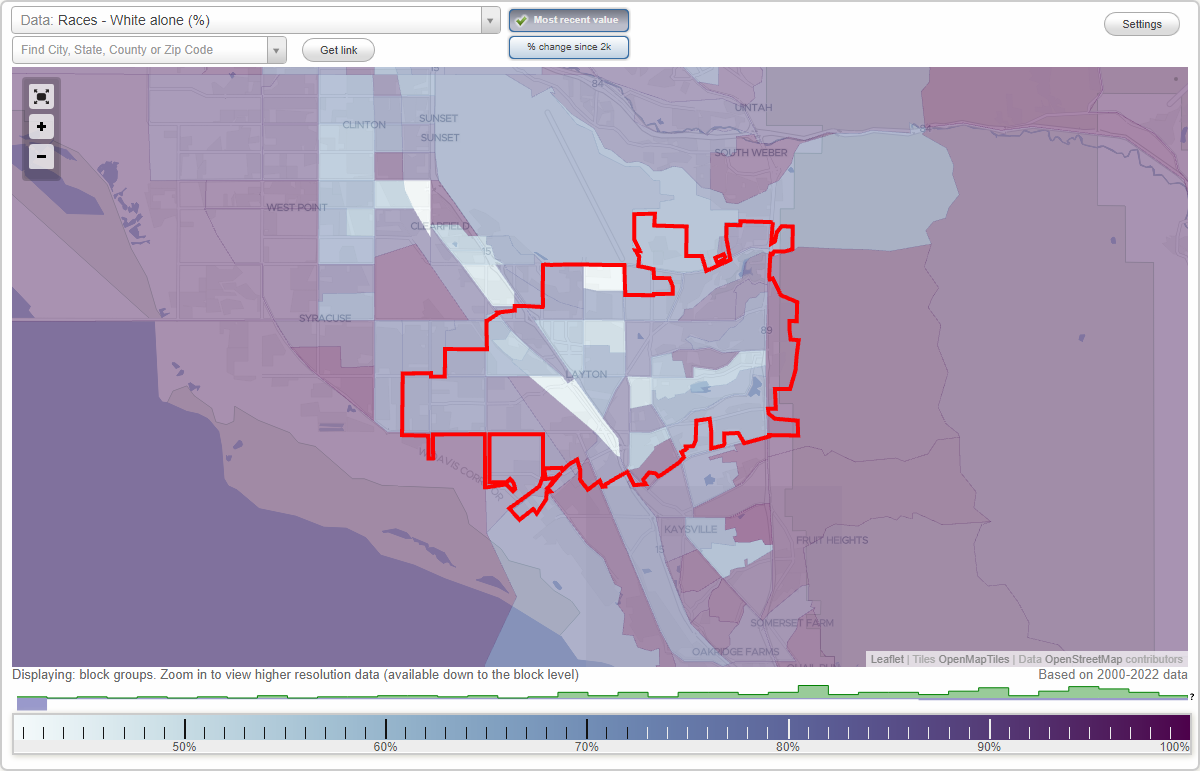
Races - White alone (%)
Races - White alone (% change since 2000)
Races - Black alone (%)
Races - Black alone (% change since 2000)
Races - American Indian alone (%)
Races - American Indian alone (% change since 2000)
Races - Asian alone (%)
Races - Asian alone (% change since 2000)
Races - Hispanic (%)
Races - Hispanic (% change since 2000)
Races - Native Hawaiian and Other Pacific Islander alone (%)
Races - Native Hawaiian and Other Pacific Islander alone (% change since 2000)
Races - Two or more races(%)
Races - Two or more races(% change since 2000)
Races - Other race alone (%)
Races - Other race alone (% change since 2000)
Racial diversity
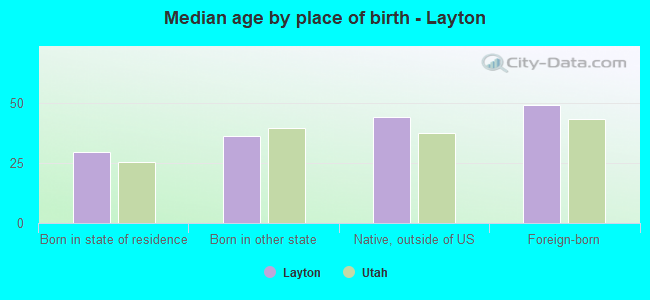
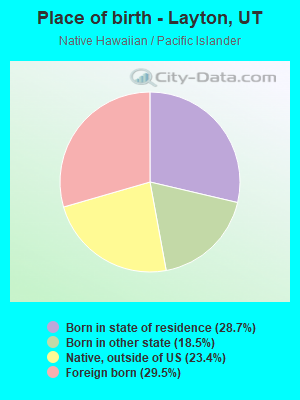
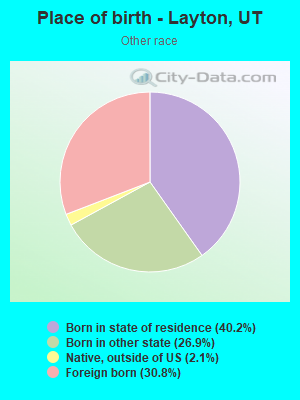
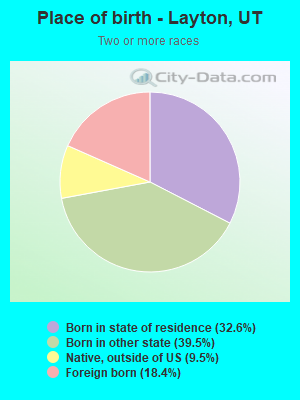
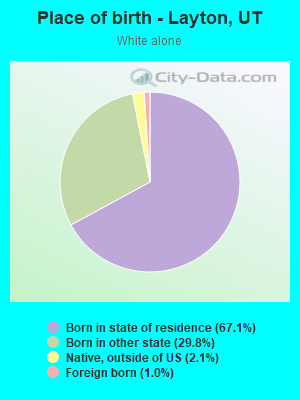
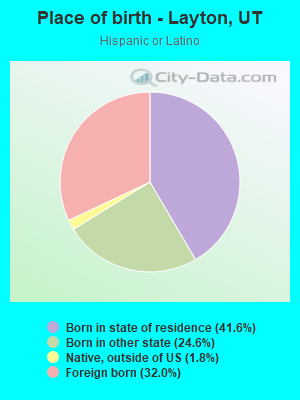
Place of birth - Born in state of residence (%)
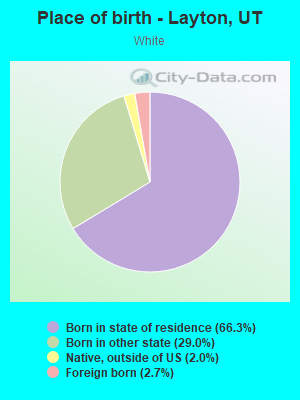
Place of birth - Born in state of residence (%) - White
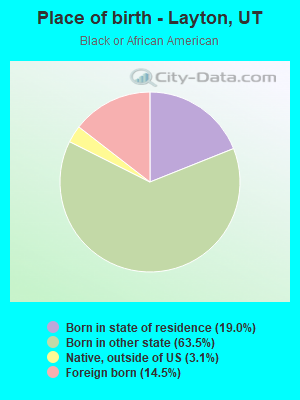
Place of birth - Born in state of residence (%) - Black or African American
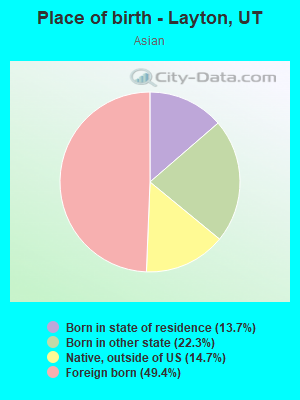
Place of birth - Born in state of residence (%) - Asian
Place of birth - Born in state of residence (%) - Hispanic or Latino
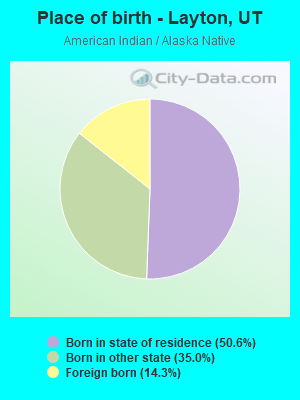
Place of birth - Born in state of residence (%) - American Indian and Alaska Native
Place of birth - Born in state of residence (%) - Multirace
Place of birth - Born in state of residence (%) - Other Race
Place of birth - Born in other state (%)
Place of birth - Born in other state (%) - White
Place of birth - Born in other state (%) - Black or African American
Place of birth - Born in other state (%) - Asian
Place of birth - Born in other state (%) - Hispanic or Latino
Place of birth - Born in other state (%) - American Indian and Alaska Native
Place of birth - Born in other state (%) - Multirace
Place of birth - Born in other state (%) - Other Race
Place of birth - Native, outside of US (%)
Place of birth - Native, outside of US (%) - White
Place of birth - Native, outside of US (%) - Black or African American
Place of birth - Native, outside of US (%) - Asian
Place of birth - Native, outside of US (%) - Hispanic or Latino
Place of birth - Native, outside of US (%) - American Indian and Alaska Native
Place of birth - Native, outside of US (%) - Multirace
Place of birth - Native, outside of US (%) - Other Race
Place of birth - Foreign born (%)
Place of birth - Foreign born (%) - White
Place of birth - Foreign born (%) - Black or African American
Place of birth - Foreign born (%) - Asian
Place of birth - Foreign born (%) - Hispanic or Latino
Place of birth - Foreign born (%) - American Indian and Alaska Native
Place of birth - Foreign born (%) - Multirace
Place of birth - Foreign born (%) - Other Race
Residents speaking English at home (%)
Residents speaking English at home - Born in the United States (%)
Residents speaking English at home - Native, born elsewhere (%)
Residents speaking English at home - Foreign born (%)
Residents speaking Spanish at home (%)
Residents speaking Spanish at home - Born in the United States (%)
Residents speaking Spanish at home - Native, born elsewhere (%)
Residents speaking Spanish at home - Foreign born (%)
Residents speaking other language at home (%)
Residents speaking other language at home - Born in the United States (%)
Residents speaking other language at home - Native, born elsewhere (%)
Residents speaking other language at home - Foreign born (%)
Marital status - Never married (%)
Marital status - Now married (%)
Marital status - Separated (%)
Marital status - Widowed (%)
Marital status - Divorced (%)
Ancestries Reported - Arab (%)
Ancestries Reported - Czech (%)
Ancestries Reported - Danish (%)
Ancestries Reported - Dutch (%)
Ancestries Reported - English (%)
Ancestries Reported - French (%)
Ancestries Reported - French Canadian (%)
Ancestries Reported - German (%)
Ancestries Reported - Greek (%)
Ancestries Reported - Hungarian (%)
Ancestries Reported - Irish (%)
Ancestries Reported - Italian (%)
Ancestries Reported - Lithuanian (%)
Ancestries Reported - Norwegian (%)
Ancestries Reported - Polish (%)
Ancestries Reported - Portuguese (%)
Ancestries Reported - Russian (%)
Ancestries Reported - Scotch-Irish (%)
Ancestries Reported - Scottish (%)
Ancestries Reported - Slovak (%)
Ancestries Reported - Subsaharan African (%)
Ancestries Reported - Swedish (%)
Ancestries Reported - Swiss (%)
Ancestries Reported - Ukrainian (%)
Ancestries Reported - United States (%)
Ancestries Reported - Welsh (%)
Ancestries Reported - West Indian (%)
Ancestries Reported - Other (%)
Geographical mobility - Same house 1 year ago (%)
Geographical mobility - Same house 1 year ago (%) - White
Geographical mobility - Same house 1 year ago (%) - Black or African American
Geographical mobility - Same house 1 year ago (%) - Asian
Geographical mobility - Same house 1 year ago (%) - Hispanic or Latino
Geographical mobility - Same house 1 year ago (%) - American Indian and Alaska Native
Geographical mobility - Same house 1 year ago (%) - Multirace
Geographical mobility - Same house 1 year ago (%) - Other Race
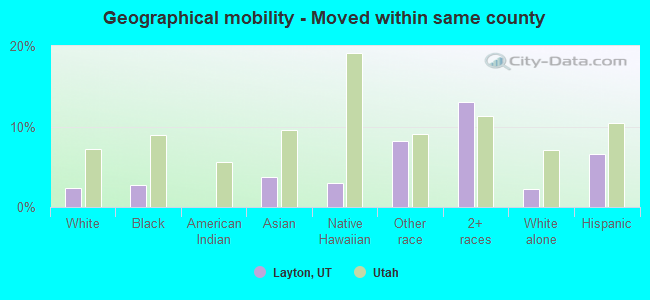
Geographical mobility - Moved within same county (%)
Geographical mobility - Moved within same county (%) - White
Geographical mobility - Moved within same county (%) - Black or African American
Geographical mobility - Moved within same county (%) - Asian
Geographical mobility - Moved within same county (%) - Hispanic or Latino
Geographical mobility - Moved within same county (%) - American Indian and Alaska Native
Geographical mobility - Moved within same county (%) - Multirace
Geographical mobility - Moved within same county (%) - Other Race
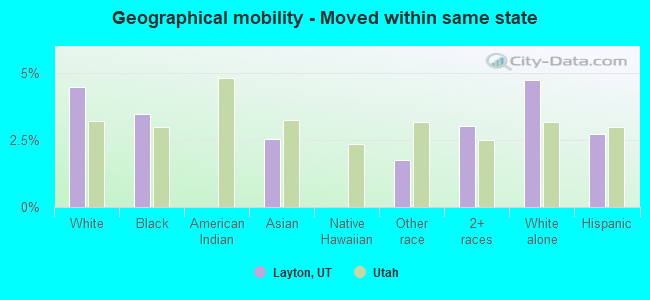
Geographical mobility - Moved from different county within same state (%)
Geographical mobility - Moved from different county within same state (%) - White
Geographical mobility - Moved from different county within same state (%) - Black or African American
Geographical mobility - Moved from different county within same state (%) - Asian
Geographical mobility - Moved from different county within same state (%) - Hispanic or Latino
Geographical mobility - Moved from different county within same state (%) - American Indian and Alaska Native
Geographical mobility - Moved from different county within same state (%) - Multirace
Geographical mobility - Moved from different county within same state (%) - Other Race
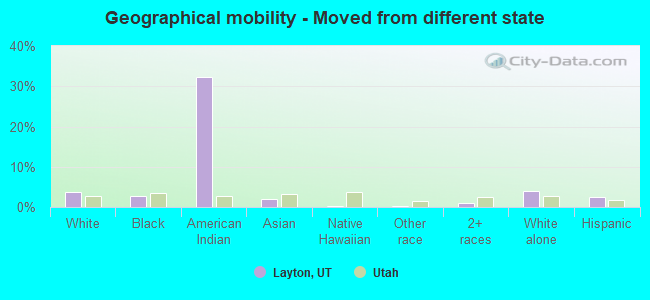
Geographical mobility - Moved from different state (%)
Geographical mobility - Moved from different state (%) - White
Geographical mobility - Moved from different state (%) - Black or African American
Geographical mobility - Moved from different state (%) - Asian
Geographical mobility - Moved from different state (%) - Hispanic or Latino
Geographical mobility - Moved from different state (%) - American Indian and Alaska Native
Geographical mobility - Moved from different state (%) - Multirace
Geographical mobility - Moved from different state (%) - Other Race
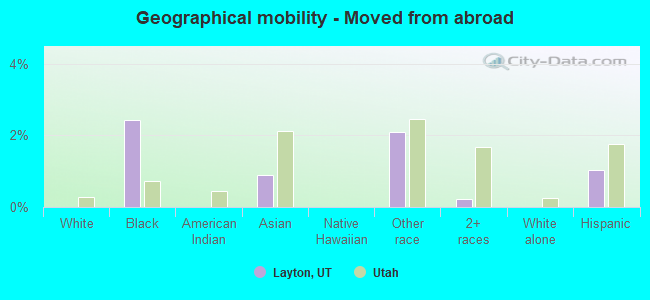
Geographical mobility - Moved from abroad (%)
Geographical mobility - Moved from abroad (%) - White
Geographical mobility - Moved from abroad (%) - Black or African American
Geographical mobility - Moved from abroad (%) - Asian
Geographical mobility - Moved from abroad (%) - Hispanic or Latino
Geographical mobility - Moved from abroad (%) - American Indian and Alaska Native
Geographical mobility - Moved from abroad (%) - Multirace
Geographical mobility - Moved from abroad (%) - Other Race
Place of birth for the foreign-born population - Ireland (%)
Place of birth for the foreign-born population - Denmark (%)
Place of birth for the foreign-born population - Norway (%)
Place of birth for the foreign-born population - Sweden (%)
Place of birth for the foreign-born population - United Kingdom (%)
Place of birth for the foreign-born population - England (%)
Place of birth for the foreign-born population - Scotland (%)
Place of birth for the foreign-born population - Other Northern Europe (%)
Place of birth for the foreign-born population - Austria (%)
Place of birth for the foreign-born population - Belgium (%)
Place of birth for the foreign-born population - France (%)
Place of birth for the foreign-born population - Germany (%)
Place of birth for the foreign-born population - Netherlands (%)
Place of birth for the foreign-born population - Switzerland (%)
Place of birth for the foreign-born population - Other Western Europe (%)
Place of birth for the foreign-born population - Greece (%)
Place of birth for the foreign-born population - Italy (%)
Place of birth for the foreign-born population - Portugal (%)
Place of birth for the foreign-born population - Spain (%)
Place of birth for the foreign-born population - Other Southern Europe (%)
Place of birth for the foreign-born population - Albania (%)
Place of birth for the foreign-born population - Belarus (%)
Place of birth for the foreign-born population - Bosnia and Herzegovina (%)
Place of birth for the foreign-born population - Bulgaria (%)
Place of birth for the foreign-born population - Croatia (%)
Place of birth for the foreign-born population - Czechoslovakia (%)
Place of birth for the foreign-born population - Hungary (%)
Place of birth for the foreign-born population - Latvia (%)
Place of birth for the foreign-born population - Lithuania (%)
Place of birth for the foreign-born population - North Macedonia (Macedonia) (%)
Place of birth for the foreign-born population - Moldova (%)
Place of birth for the foreign-born population - Poland (%)
Place of birth for the foreign-born population - Romania (%)
Place of birth for the foreign-born population - Russia (%)
Place of birth for the foreign-born population - Serbia (%)
Place of birth for the foreign-born population - Ukraine (%)
Place of birth for the foreign-born population - Other Eastern Europe (%)
Place of birth for the foreign-born population - China (%)
Place of birth for the foreign-born population - Hong Kong (%)
Place of birth for the foreign-born population - Taiwan (%)
Place of birth for the foreign-born population - Japan (%)
Place of birth for the foreign-born population - Korea (%)
Place of birth for the foreign-born population - Other Eastern Asia (%)
Place of birth for the foreign-born population - Afghanistan (%)
Place of birth for the foreign-born population - Bangladesh (%)
Place of birth for the foreign-born population - India (%)
Place of birth for the foreign-born population - Iran (%)
Place of birth for the foreign-born population - Kazakhstan (%)
Place of birth for the foreign-born population - Nepal (%)
Place of birth for the foreign-born population - Pakistan (%)
Place of birth for the foreign-born population - Sri Lanka (%)
Place of birth for the foreign-born population - Uzbekistan (%)
Place of birth for the foreign-born population - Other South Central Asia (%)
Place of birth for the foreign-born population - Burma (%)
Place of birth for the foreign-born population - Cambodia (%)
Place of birth for the foreign-born population - Indonesia (%)
Place of birth for the foreign-born population - Laos (%)
Place of birth for the foreign-born population - Malaysia (%)
Place of birth for the foreign-born population - Philippines (%)
Place of birth for the foreign-born population - Singapore (%)
Place of birth for the foreign-born population - Thailand (%)
Place of birth for the foreign-born population - Vietnam (%)
Place of birth for the foreign-born population - Other South Eastern Asia (%)
Place of birth for the foreign-born population - Armenia (%)
Place of birth for the foreign-born population - Iraq (%)
Place of birth for the foreign-born population - Israel (%)
Place of birth for the foreign-born population - Jordan (%)
Place of birth for the foreign-born population - Kuwait (%)
Place of birth for the foreign-born population - Lebanon (%)
Place of birth for the foreign-born population - Saudi Arabia (%)
Place of birth for the foreign-born population - Syria (%)
Place of birth for the foreign-born population - Turkey (%)
Place of birth for the foreign-born population - Yemen (%)
Place of birth for the foreign-born population - Other Western Asia (%)
Place of birth for the foreign-born population - Eritrea (%)
Place of birth for the foreign-born population - Ethiopia (%)
Place of birth for the foreign-born population - Kenya (%)
Place of birth for the foreign-born population - Somalia (%)
Place of birth for the foreign-born population - Uganda (%)
Place of birth for the foreign-born population - Zimbabwe (%)
Place of birth for the foreign-born population - Other Eastern Africa (%)
Place of birth for the foreign-born population - Cameroon (%)
Place of birth for the foreign-born population - Congo (%)
Place of birth for the foreign-born population - Democratic Republic of Congo (Zaire) (%)
Place of birth for the foreign-born population - Other Middle Africa (%)
Place of birth for the foreign-born population - Egypt (%)
Place of birth for the foreign-born population - Morocco (%)
Place of birth for the foreign-born population - Sudan (%)
Place of birth for the foreign-born population - Other Northern Africa (%)
Place of birth for the foreign-born population - South Africa (%)
Place of birth for the foreign-born population - Other Southern Africa (%)
Place of birth for the foreign-born population - Cabo Verde (%)
Place of birth for the foreign-born population - Ghana (%)
Place of birth for the foreign-born population - Liberia (%)
Place of birth for the foreign-born population - Nigeria (%)
Place of birth for the foreign-born population - Senegal (%)
Place of birth for the foreign-born population - Sierra Leone (%)
Place of birth for the foreign-born population - Other Western Africa (%)
Place of birth for the foreign-born population - Australia (%)
Place of birth for the foreign-born population - New Zealand (%)
Place of birth for the foreign-born population - Fiji (%)
Place of birth for the foreign-born population - Micronesia (%)
Place of birth for the foreign-born population - Bahamas (%)
Place of birth for the foreign-born population - Barbados (%)
Place of birth for the foreign-born population - Cuba (%)
Place of birth for the foreign-born population - Dominica (%)
Place of birth for the foreign-born population - Dominican Republic (%)
Place of birth for the foreign-born population - Grenada (%)
Place of birth for the foreign-born population - Haiti (%)
Place of birth for the foreign-born population - Jamaica (%)
Place of birth for the foreign-born population - St. Vincent and the Grenadines (%)
Place of birth for the foreign-born population - Trinidad and Tobago (%)
Place of birth for the foreign-born population - West Indies (%)
Place of birth for the foreign-born population - Other Caribbean (%)
Place of birth for the foreign-born population - Belize (%)
Place of birth for the foreign-born population - Costa Rica (%)
Place of birth for the foreign-born population - El Salvador (%)
Place of birth for the foreign-born population - Guatemala (%)
Place of birth for the foreign-born population - Honduras (%)
Place of birth for the foreign-born population - Mexico (%)
Place of birth for the foreign-born population - Nicaragua (%)
Place of birth for the foreign-born population - Panama (%)
Place of birth for the foreign-born population - Other Central America (%)
Place of birth for the foreign-born population - Argentina (%)
Place of birth for the foreign-born population - Bolivia (%)
Place of birth for the foreign-born population - Brazil (%)
Place of birth for the foreign-born population - Chile (%)
Place of birth for the foreign-born population - Colombia (%)
Place of birth for the foreign-born population - Ecuador (%)
Place of birth for the foreign-born population - Guyana (%)
Place of birth for the foreign-born population - Peru (%)
Place of birth for the foreign-born population - Uruguay (%)
Place of birth for the foreign-born population - Venezuela (%)
Place of birth for the foreign-born population - Other South America (%)
Place of birth for the foreign-born population - Canada (%)
Place of birth for the foreign-born population - Other Northern America (%)
Place of birth for the foreign-born population - Other (%)
Latest news about races in Layton, UT collected exclusively by city-data.com from local newspapers, TV, and radio stations
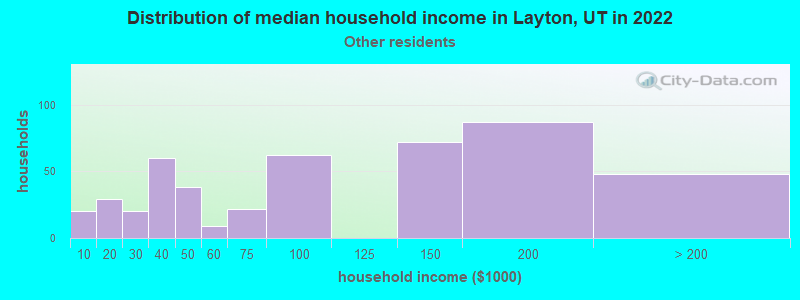
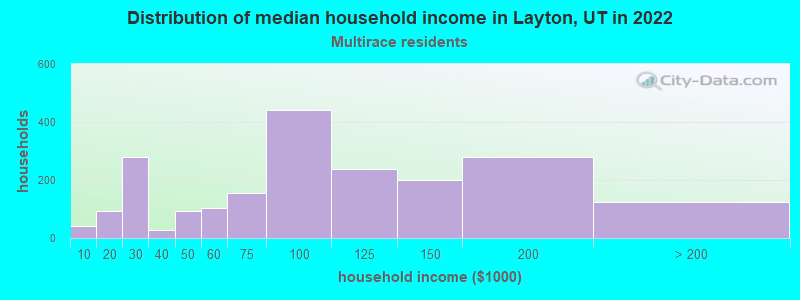
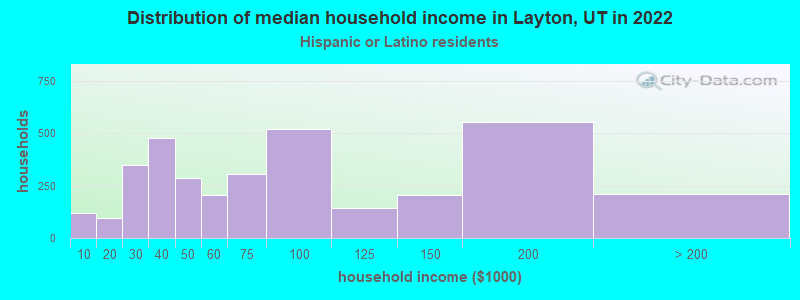
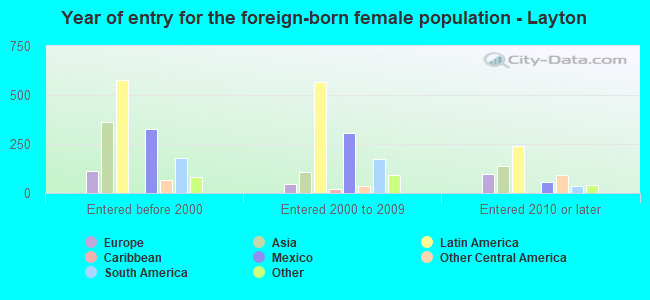
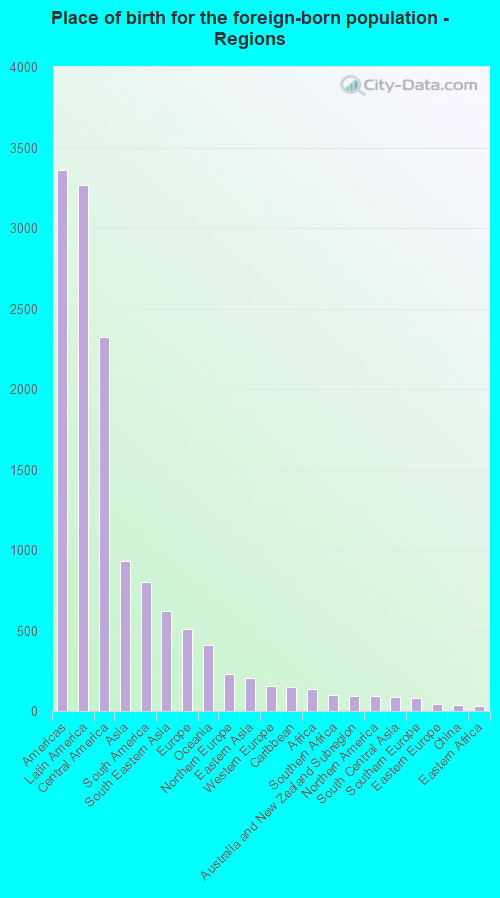
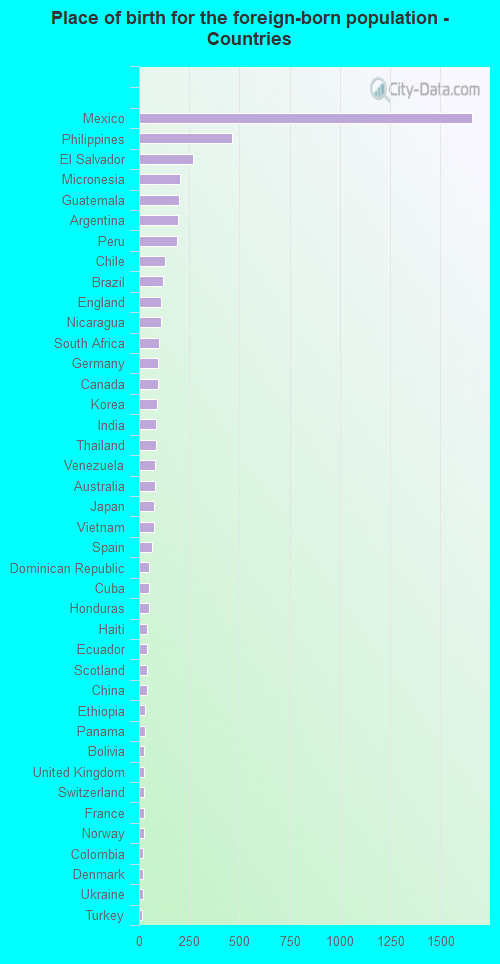
According to 2022 data, the most numerous races in Layton, UT are White alone (68,065 residents), Hispanic (9,293 residents), and Two or more races (1,760 residents). 88.3% of Layton residents speak English at home. 6.4% of Layton, UT residents are foreign-born (3.8% born in Latin America, 1.1% born in Asia), which is 24.7% less than the foreign-born rate of 8.0% across the entire state of Utah.
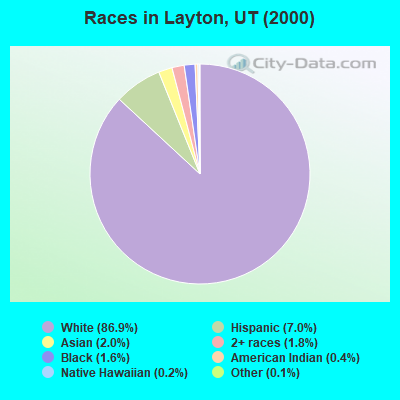
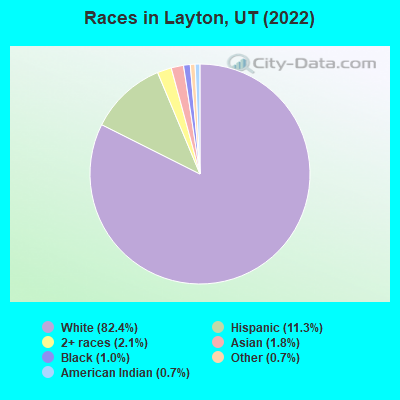
Race distribution in Layton
2000 2022
1,904,265 85.3% White alone 201,559 9.0% Hispanic 36,483 1.6% Asian alone 31,308 1.4% Two or more races 26,663 1.2% American Indian alone 14,806 0.7% Native Hawaiian and Other 16,137 0.7% Black alone 1,948 0.09% Other race alone
2,557,466 75.6% White alone 512,086 15.1% Hispanic 119,308 3.5% Two or more races 82,388 2.4% Asian alone 36,978 1.1% Native Hawaiian and Other 34,873 1.0% Black alone 22,803 0.7% American Indian alone 14,898 0.4% Other race alone
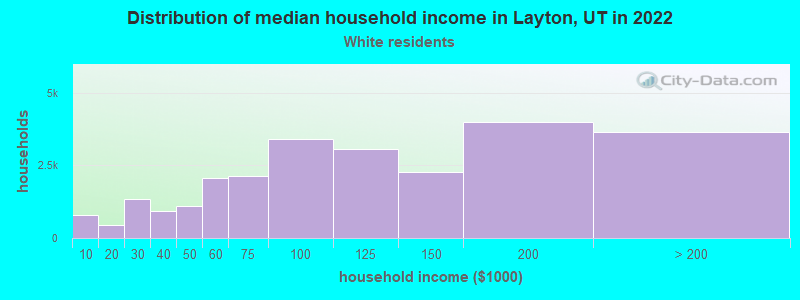
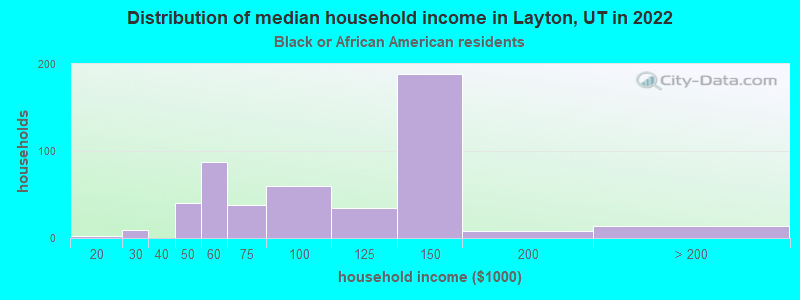
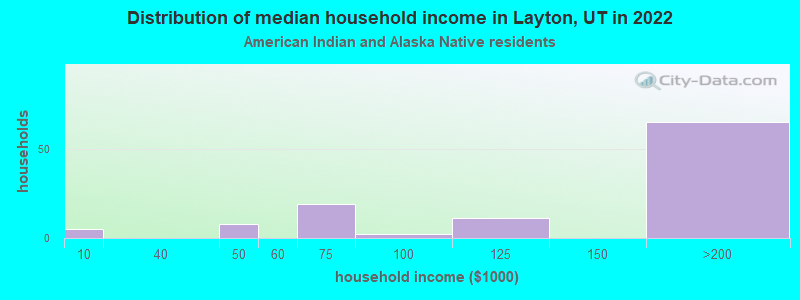
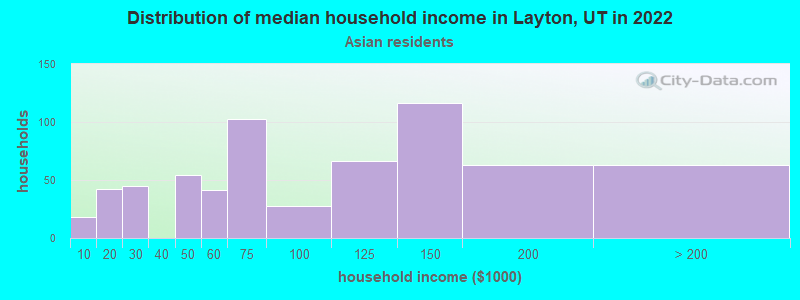
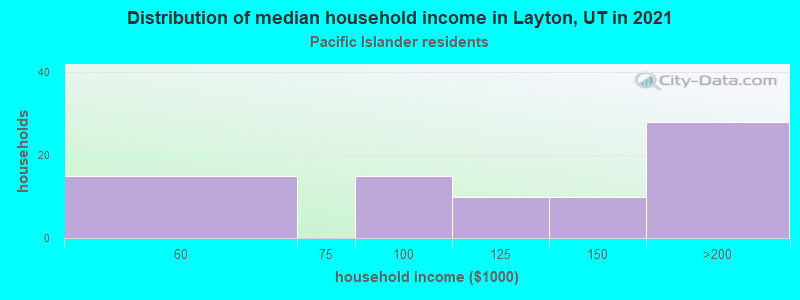
Income and house value in Layton Median household income in 2022 $100,934 White non-Hispanic householders$130,803 Black householders$72,761 Asian householders$94,022 Some other race householders$107,304 Two or more races householders$117,421 Hispanic or Latino race householdersMedian 2022 house value $510,689 White Non-Hispanic householders$493,162 Black or African American householders$412,400 American Indian or Alaska Native householders $582,515 Asian householders$394,529 Native Hawaiian and other Pacific Islander householders$441,268 Some other race householders$571,518 Two or more races householders$452,609 Hispanic or Latino householders
Median age by race in Layton
33.4 Median age for White residents33.0 34.1 42.1 Median age for Black or African American residents42.7 35.3 18.7 Median age for American Indian / Alaska Native residents45.1 18.6 55.0 Median age for Asian residents49.7 57.6 -666,666,666.0 Median age for Native Hawaiian / Pacific Islander residents-666,666,666.0 -666,666,666.0 41.4 Median age for Other race residents41.5 39.7 25.3 Median age for Two or more races residents27.0 24.2 33.5 Median age for White alone residents32.8 34.8 29.8 Median age for Hispanic or Latino residents33.1 27.6
Owner/renter occupied households by race in Layton
House owners and renters - White residents 18,651 74.0% Owner occupied6,565 26.0% Renter occupiedHouse owners and renters - Black or African American residents 85 13.7% Owner occupied531 86.3% Renter occupiedHouse owners and renters - American Indian / Alaska Native residents 55 52.6% Owner occupied49 47.4% Renter occupiedHouse owners and renters - Asian residents 471 53.3% Owner occupied412 46.7% Renter occupiedHouse owners and renters - Native Hawaiian / Pacific Islander residents 87 85.4% Owner occupied15 14.6% Renter occupiedHouse owners and renters - Other race residents 515 83.6% Owner occupied101 16.4% Renter occupiedHouse owners and renters - Two or more races residents 915 75.2% Owner occupied302 24.8% Renter occupiedHouse owners and renters - White alone residents 17,577 73.1% Owner occupied6,478 26.9% Renter occupiedHouse owners and renters - Hispanic or Latino residents 1,976 80.7% Owner occupied473 19.3% Renter occupied
Language usage in Layton
English speakers - Total 88.3% of residents of Layton speak English at home.
7.5% of residents speak Spanish at home 4,586 77.6% Speak English very well1,326 22.4% Speak English less than very well4.2% of residents speak other language at home 2,794 84.8% Speak English very well502 15.2% Speak English less than very well
English speakers - Born in the United States 92.6% of residents of Layton speak English at home.
5.0% of residents speak Spanish at home 1,190 100.0% Speak English very well2.4% of residents speak other language at home 388 68.9% Speak English very well175 31.1% Speak English less than very well
English speakers - Native, born elsewhere 69.1% of residents of Layton speak English at home.
7.3% of residents speak Spanish at home 167 100.0% Speak English very well23.6% of residents speak other language at home 435 80.9% Speak English very well103 19.1% Speak English less than very well
English speakers - Foreign-born 12.5% of residents of Layton speak English at home.
54.6% of residents speak Spanish at home 1,391 54.4% Speak English very well1,165 45.6% Speak English less than very well32.9% of residents speak other language at home 1,316 85.5% Speak English very well224 14.5% Speak English less than very well
White (Caucasian) - Speak only English Native:
95.3% (63,254)Foreign-born:
17.9% (349)
White (Caucasian) - Speak another language Native:
4.7% (3,105)Foreign-born:
82.1% (1,597)
Black or African American - Speak only English Native:
85.7% (1,037)Foreign-born:
80.2% (158)
Black or African American - Speak another language Native:
10.0% (121)Foreign-born:
28.4% (56)
American Indian / Alaska Native - Speak only English Native:
74.9% (253)Foreign-born:
100.0% (54)
American Indian / Alaska Native - Speak another language Native:
20.5% (69)Foreign-born:
2.4% (1)
Asian - Speak only English Native:
59.8% (545)Foreign-born:
4.5% (32)
Asian - Speak another language Native:
46.1% (421)Foreign-born:
100.0% (705)
Native Hawaiian / Pacific Islander - Speak only English Native:
77.0% (393)Foreign-born:
70.8% (209)
Native Hawaiian / Pacific Islander - Speak another language Native:
20.5% (105)Foreign-born:
4.6% (14)
Other race - Speak only English Native:
66.4% (961)Foreign-born:
4.6% (35)
Other race - Speak another language Native:
34.2% (495)Foreign-born:
88.4% (663)
Two or more races - Speak only English Native:
72.7% (3,453)Foreign-born:
2.3% (21)
Two or more races - Speak another language Native:
28.0% (1,332)Foreign-born:
100.0% (935)
White alone - Speak only English Native:
96.8% (62,051)Foreign-born:
50.0% (349)
White alone - Speak another language Native:
3.2% (2,057)Foreign-born:
50.0% (349)
Hispanic or Latino - Speak another language Native:
37.8% (2,210)Foreign-born:
100.0% (2,973)
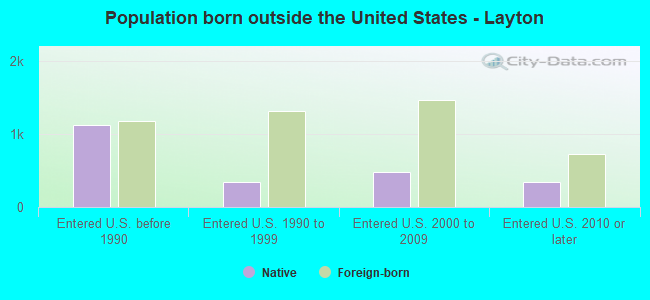
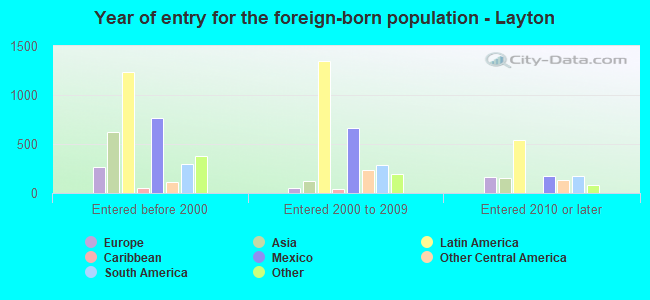
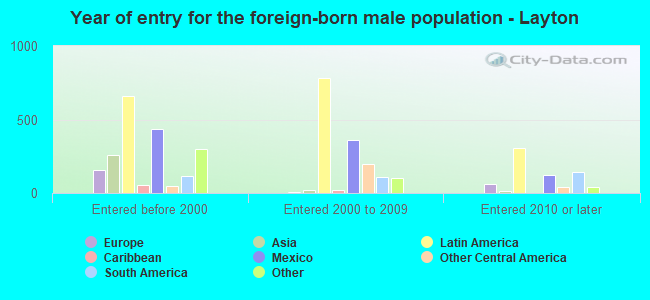
Foreign-born residents in Layton 5,344 residents are foreign born (3.8% Latin America , 1.1% Asia ).
Marital status for residents in Layton Marital status - White (Caucasian) population 15 years and over
Males 32.4% Never married56.7% Now married1.4% Separated0.5% Widowed9.1% DivorcedFemales 22.2% Never married61.4% Now married1.2% Separated5.9% Widowed9.3% DivorcedWomen who gave birth in the past 12 months Now married:
71.6% (549)Unmarried:
28.4% (218)
Women who did not give birth in the past 12 months Now married:
62.1% (10,892)Unmarried:
37.9% (6,635)
Marital status - Black or African American population 15 years and over
Males 33.8% Never married62.4% Now married0.1% Separated1.7% Widowed2.0% DivorcedFemales 28.8% Never married71.2% Now married0.0% Separated0.0% Widowed0.0% DivorcedWomen who did not give birth in the past 12 months Now married:
66.2% (219)Unmarried:
33.8% (112)
Marital status - American Indian / Alaska Native population 15 years and over
Males 22.6% Never married77.4% Now married0.0% Separated0.0% Widowed0.0% DivorcedFemales 38.3% Never married61.7% Now married0.0% Separated0.0% Widowed0.0% DivorcedWomen who did not give birth in the past 12 months Now married:
59.8% (155)Unmarried:
40.2% (105)
Marital status - Asian population 15 years and over
Males 24.8% Never married69.0% Now married0.0% Separated0.0% Widowed6.3% DivorcedFemales 16.5% Never married74.1% Now married0.0% Separated9.4% Widowed0.0% DivorcedWomen who did not give birth in the past 12 months Now married:
67.6% (336)Unmarried:
32.4% (161)
Marital status - Native Hawaiian / Pacific Islander population 15 years and over
Males 37.5% Never married61.9% Now married0.0% Separated0.6% Widowed0.0% DivorcedFemales 26.1% Never married73.9% Now married0.0% Separated0.0% Widowed0.0% DivorcedWomen who did not give birth in the past 12 months Now married:
66.9% (147)Unmarried:
33.1% (73)
Marital status - Other race population 15 years and over
Males 37.9% Never married52.8% Now married0.9% Separated0.0% Widowed8.4% DivorcedFemales 38.1% Never married48.5% Now married3.4% Separated5.2% Widowed4.8% DivorcedWomen who gave birth in the past 12 months Now married:
0.0% (0)Unmarried:
100.0% (4)
Women who did not give birth in the past 12 months Now married:
47.3% (254)Unmarried:
52.7% (282)
Marital status - Two or more races population 15 years and over
Males 33.7% Never married53.4% Now married0.0% Separated4.6% Widowed8.3% DivorcedFemales 41.9% Never married44.0% Now married1.8% Separated10.0% Widowed2.3% DivorcedWomen who gave birth in the past 12 months Now married:
55.8% (57)Unmarried:
44.2% (45)
Women who did not give birth in the past 12 months Now married:
44.9% (791)Unmarried:
55.1% (969)
Marital status - White alone, not Hispanic / Latino population 15 years and over
Males 33.7% Never married55.3% Now married1.4% Separated0.5% Widowed9.1% DivorcedFemales 21.7% Never married62.2% Now married1.3% Separated5.3% Widowed9.4% DivorcedWomen who gave birth in the past 12 months Now married:
71.6% (549)Unmarried:
28.4% (218)
Women who did not give birth in the past 12 months Now married:
62.6% (10,189)Unmarried:
37.4% (6,086)
Marital status - Hispanic or Latino population 15 years and over
Males 29.0% Never married64.7% Now married0.0% Separated0.0% Widowed6.3% DivorcedFemales 36.4% Never married51.9% Now married0.0% Separated9.4% Widowed2.3% DivorcedWomen who gave birth in the past 12 months Now married:
93.5% (61)Unmarried:
6.5% (4)
Women who did not give birth in the past 12 months Now married:
39.6% (1,226)Unmarried:
60.4% (1,866)
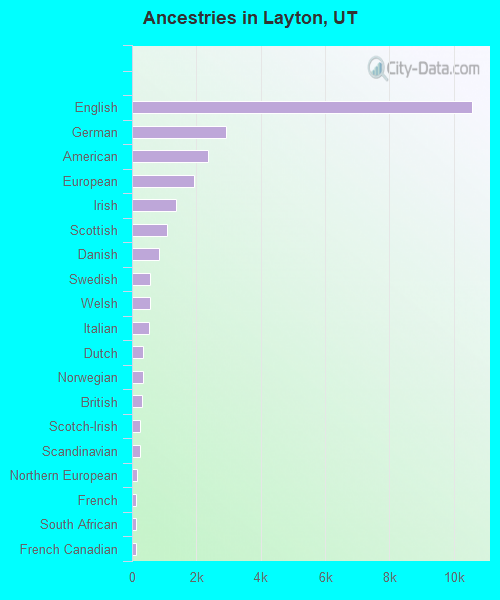
Ancestries in Layton
10,566 27.7% English2,917 7.6% German2,361 6.2% American1,920 5.0% European1,363 3.6% Irish1,101 2.9% Scottish846 2.2% Danish571 1.5% Swedish558 1.5% Welsh522 1.4% Italian353 0.9% Dutch344 0.9% Norwegian303 0.8% British248 0.6% Scotch-Irish237 0.6% Scandinavian170 0.4% Northern European135 0.4% French118 0.3% South African111 0.3% French Canadian84 0.2% Haitian81 0.2% African80 0.2% Swiss73 0.2% Canadian55 0.1% Polish52 0.1% Slovene49 0.1% Australian43 0.1% Ethiopian41 0.1% Greek34 0.09% Russian30 0.08% Ukrainian25 0.07% Icelander25 0.07% Portuguese25 0.07% Celtic24 0.06% Basque20 0.05% Brazilian19 0.05% Hungarian12 0.03% Austrian12 0.03% Yugoslavian9 0.02% Turkish7 0.02% Albanian6 0.02% Bulgarian5 0.01% Czech5 0.01% Eastern European
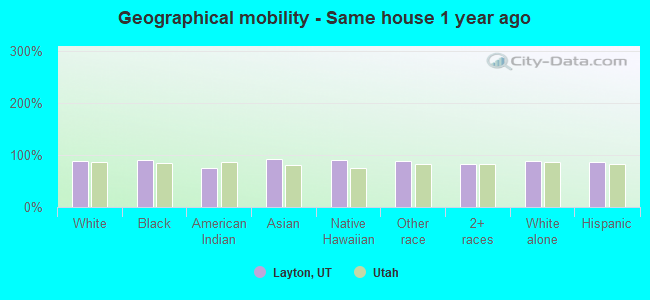
Geographical mobility in Layton Same house 1 year ago 63,651 89.5% White (Caucasian)1,306 90.6% Black or African American292 75.5% American Indian / Alaska Native1,491 92.1% Asian726 90.5% Native Hawaiian / Pacific Islander2,317 87.8% Other race5,345 83.2% Two or more races60,059 89.2% White alone, not Hispanic / Latino10,626 87.5% Hispanic or LatinoMoved within same county 1,675 2.4% White / Caucasian39 2.7% Black or African American61 3.8% Asian24 3.0% Native Hawaiian / Pacific Islander217 8.2% Other race840 13.1% Two or more races1,495 2.2% White alone, not Hispanic / Latino807 6.6% Hispanic or LatinoMoved within same state 3,188 4.5% White / Caucasian50 3.5% Black or African American41 2.5% Asian46 1.7% Other race193 3.0% Two or more races3,188 4.7% White alone, not Hispanic / Latino330 2.7% Hispanic or LatinoMoved from different state 2,618 3.7% White / Caucasian40 2.8% Black or African American125 32.4% American Indian / Alaska Native34 2.1% Asian3 0.3% Native Hawaiian / Pacific Islander4 0.2% Other race58 0.9% Two or more races2,618 3.9% White alone, not Hispanic / Latino306 2.5% Hispanic or LatinoMoved from abroad 35 2.4% Black or African American14 0.9% Asian55 2.1% Other race15 0.2% Two or more races124 1.0% Hispanic or Latino
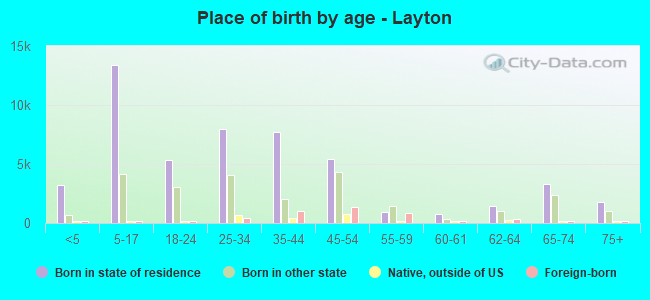
Children Nativity (place of birth) in Layton
Children under 6 years - Living with two parents Both parents native 4,758 100.0% NativeBoth parents foreign-born 190 100.0% NativeOne native, one foreign-born parent 323 94.2% Native20 5.8% Foreign-bornChildren under 6 years - Living with one parent Native parent 987 96.5% Native36 3.5% Foreign-bornForeign-born parent 33 86.0% Native5 14.0% Foreign-bornChildren 6 to 17 years - Living with two parents Both parents native 12,686 100.0% NativeBoth parents foreign-born 520 90.8% Native53 9.2% Foreign-bornOne native, one foreign-born parent 749 100.0% NativeChildren 6 to 17 years - Living with one parent Native parent 2,869 99.7% Native8 0.3% Foreign-bornForeign-born parent 146 58.9% Native102 41.1% Foreign-born
Grandparents responsible for own grandchildren in Layton
Grandparents (30 to 59 years) White / Caucasian 41 4.7% Responsible for grandchildren814 95.3% Not responsible for grandchildrenAsian 8 100.0% Responsible for grandchildrenNative Hawaiian / Pacific Islander 87 100.0% Not responsible for grandchildrenOther race 17 100.0% Not responsible for grandchildrenWhite alone, not Hispanic / Latino 47 7.2% Responsible for grandchildren601 92.8% Not responsible for grandchildrenHispanic or Latino 107 100.0% Not responsible for grandchildrenGrandparents (60 years and over) White / Caucasian 106 18.5% Responsible for grandchildren466 81.5% Not responsible for grandchildrenAsian 18 50.2% Responsible for grandchildren18 49.8% Not responsible for grandchildrenNative Hawaiian / Pacific Islander 58 100.0% Not responsible for grandchildrenOther race 26 100.0% Not responsible for grandchildrenWhite alone, not Hispanic / Latino 106 18.9% Responsible for grandchildren455 81.1% Not responsible for grandchildrenHispanic or Latino 62 100.0% Not responsible for grandchildren