Races in Le Mars, Iowa (IA) Detailed Stats
Data:
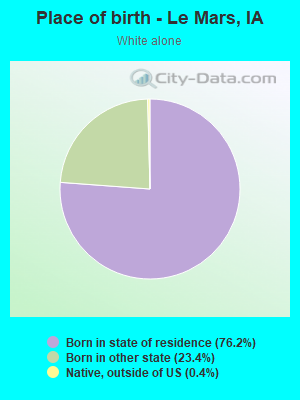
Races - White alone (%)
Races - White alone (% change since 2000)
Races - Black alone (%)
Races - Black alone (% change since 2000)
Races - American Indian alone (%)
Races - American Indian alone (% change since 2000)
Races - Asian alone (%)
Races - Asian alone (% change since 2000)
Races - Hispanic (%)
Races - Hispanic (% change since 2000)
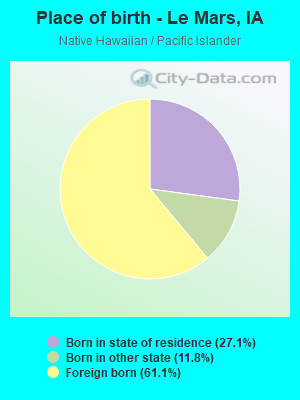
Races - Native Hawaiian and Other Pacific Islander alone (%)
Races - Native Hawaiian and Other Pacific Islander alone (% change since 2000)
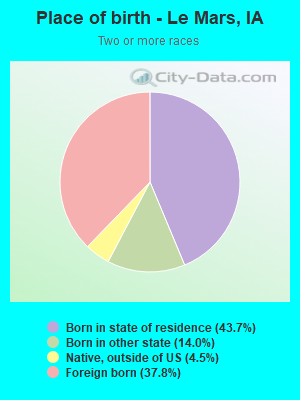
Races - Two or more races(%)
Races - Two or more races(% change since 2000)
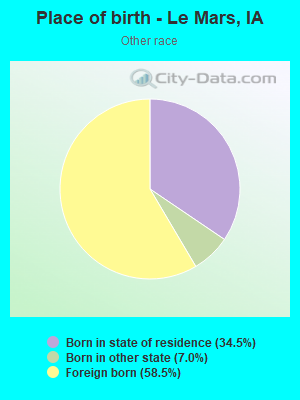
Races - Other race alone (%)
Races - Other race alone (% change since 2000)
Racial diversity
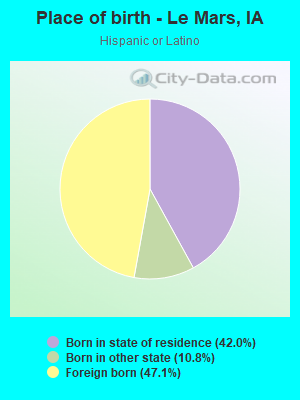
Place of birth - Born in state of residence (%)
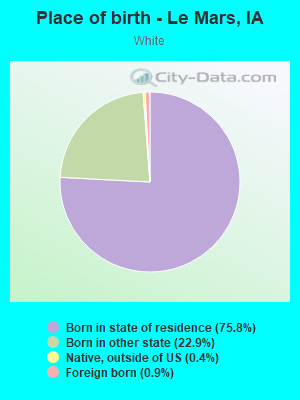
Place of birth - Born in state of residence (%) - White
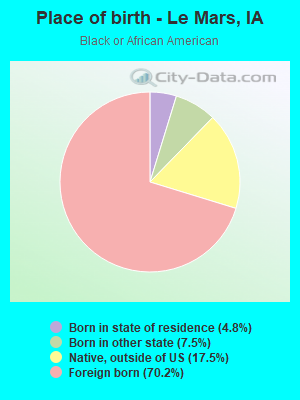
Place of birth - Born in state of residence (%) - Black or African American
Place of birth - Born in state of residence (%) - Asian
Place of birth - Born in state of residence (%) - Hispanic or Latino
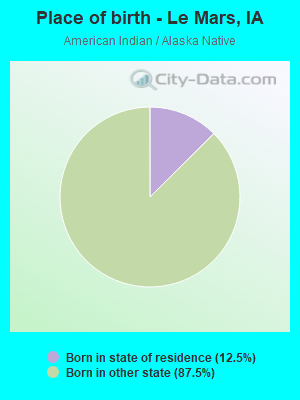
Place of birth - Born in state of residence (%) - American Indian and Alaska Native
Place of birth - Born in state of residence (%) - Multirace
Place of birth - Born in state of residence (%) - Other Race
Place of birth - Born in other state (%)
Place of birth - Born in other state (%) - White
Place of birth - Born in other state (%) - Black or African American
Place of birth - Born in other state (%) - Asian
Place of birth - Born in other state (%) - Hispanic or Latino
Place of birth - Born in other state (%) - American Indian and Alaska Native
Place of birth - Born in other state (%) - Multirace
Place of birth - Born in other state (%) - Other Race
Place of birth - Native, outside of US (%)
Place of birth - Native, outside of US (%) - White
Place of birth - Native, outside of US (%) - Black or African American
Place of birth - Native, outside of US (%) - Asian
Place of birth - Native, outside of US (%) - Hispanic or Latino
Place of birth - Native, outside of US (%) - American Indian and Alaska Native
Place of birth - Native, outside of US (%) - Multirace
Place of birth - Native, outside of US (%) - Other Race
Place of birth - Foreign born (%)
Place of birth - Foreign born (%) - White
Place of birth - Foreign born (%) - Black or African American
Place of birth - Foreign born (%) - Asian
Place of birth - Foreign born (%) - Hispanic or Latino
Place of birth - Foreign born (%) - American Indian and Alaska Native
Place of birth - Foreign born (%) - Multirace
Place of birth - Foreign born (%) - Other Race
Residents speaking English at home (%)
Residents speaking English at home - Born in the United States (%)
Residents speaking English at home - Native, born elsewhere (%)
Residents speaking English at home - Foreign born (%)
Residents speaking Spanish at home (%)
Residents speaking Spanish at home - Born in the United States (%)
Residents speaking Spanish at home - Native, born elsewhere (%)
Residents speaking Spanish at home - Foreign born (%)
Residents speaking other language at home (%)
Residents speaking other language at home - Born in the United States (%)
Residents speaking other language at home - Native, born elsewhere (%)
Residents speaking other language at home - Foreign born (%)
Marital status - Never married (%)
Marital status - Now married (%)
Marital status - Separated (%)
Marital status - Widowed (%)
Marital status - Divorced (%)
Ancestries Reported - Arab (%)
Ancestries Reported - Czech (%)
Ancestries Reported - Danish (%)
Ancestries Reported - Dutch (%)
Ancestries Reported - English (%)
Ancestries Reported - French (%)
Ancestries Reported - French Canadian (%)
Ancestries Reported - German (%)
Ancestries Reported - Greek (%)
Ancestries Reported - Hungarian (%)
Ancestries Reported - Irish (%)
Ancestries Reported - Italian (%)
Ancestries Reported - Lithuanian (%)
Ancestries Reported - Norwegian (%)
Ancestries Reported - Polish (%)
Ancestries Reported - Portuguese (%)
Ancestries Reported - Russian (%)
Ancestries Reported - Scotch-Irish (%)
Ancestries Reported - Scottish (%)
Ancestries Reported - Slovak (%)
Ancestries Reported - Subsaharan African (%)
Ancestries Reported - Swedish (%)
Ancestries Reported - Swiss (%)
Ancestries Reported - Ukrainian (%)
Ancestries Reported - United States (%)
Ancestries Reported - Welsh (%)
Ancestries Reported - West Indian (%)
Ancestries Reported - Other (%)
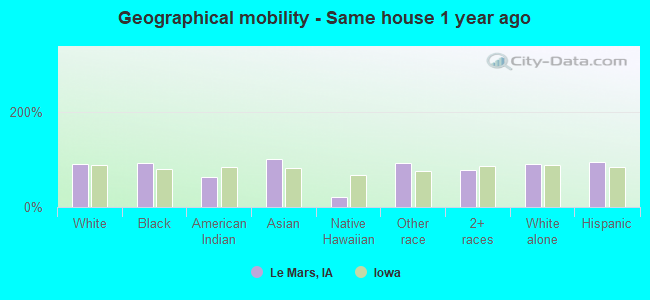
Geographical mobility - Same house 1 year ago (%)
Geographical mobility - Same house 1 year ago (%) - White
Geographical mobility - Same house 1 year ago (%) - Black or African American
Geographical mobility - Same house 1 year ago (%) - Asian
Geographical mobility - Same house 1 year ago (%) - Hispanic or Latino
Geographical mobility - Same house 1 year ago (%) - American Indian and Alaska Native
Geographical mobility - Same house 1 year ago (%) - Multirace
Geographical mobility - Same house 1 year ago (%) - Other Race
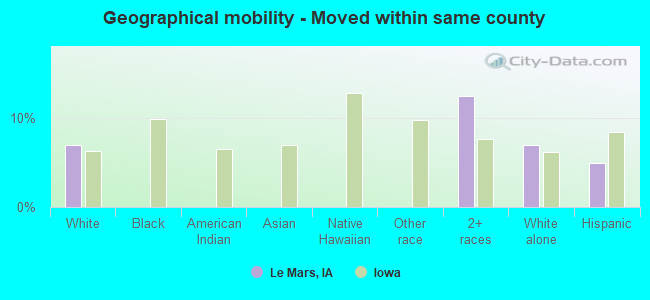
Geographical mobility - Moved within same county (%)
Geographical mobility - Moved within same county (%) - White
Geographical mobility - Moved within same county (%) - Black or African American
Geographical mobility - Moved within same county (%) - Asian
Geographical mobility - Moved within same county (%) - Hispanic or Latino
Geographical mobility - Moved within same county (%) - American Indian and Alaska Native
Geographical mobility - Moved within same county (%) - Multirace
Geographical mobility - Moved within same county (%) - Other Race
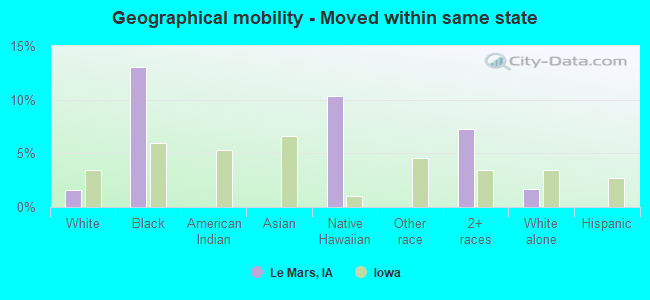
Geographical mobility - Moved from different county within same state (%)
Geographical mobility - Moved from different county within same state (%) - White
Geographical mobility - Moved from different county within same state (%) - Black or African American
Geographical mobility - Moved from different county within same state (%) - Asian
Geographical mobility - Moved from different county within same state (%) - Hispanic or Latino
Geographical mobility - Moved from different county within same state (%) - American Indian and Alaska Native
Geographical mobility - Moved from different county within same state (%) - Multirace
Geographical mobility - Moved from different county within same state (%) - Other Race
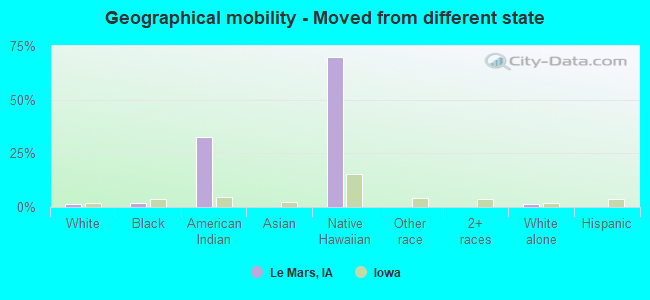
Geographical mobility - Moved from different state (%)
Geographical mobility - Moved from different state (%) - White
Geographical mobility - Moved from different state (%) - Black or African American
Geographical mobility - Moved from different state (%) - Asian
Geographical mobility - Moved from different state (%) - Hispanic or Latino
Geographical mobility - Moved from different state (%) - American Indian and Alaska Native
Geographical mobility - Moved from different state (%) - Multirace
Geographical mobility - Moved from different state (%) - Other Race
Geographical mobility - Moved from abroad (%)
Geographical mobility - Moved from abroad (%) - White
Geographical mobility - Moved from abroad (%) - Black or African American
Geographical mobility - Moved from abroad (%) - Asian
Geographical mobility - Moved from abroad (%) - Hispanic or Latino
Geographical mobility - Moved from abroad (%) - American Indian and Alaska Native
Geographical mobility - Moved from abroad (%) - Multirace
Geographical mobility - Moved from abroad (%) - Other Race
Place of birth for the foreign-born population - Ireland (%)
Place of birth for the foreign-born population - Denmark (%)
Place of birth for the foreign-born population - Norway (%)
Place of birth for the foreign-born population - Sweden (%)
Place of birth for the foreign-born population - United Kingdom (%)
Place of birth for the foreign-born population - England (%)
Place of birth for the foreign-born population - Scotland (%)
Place of birth for the foreign-born population - Other Northern Europe (%)
Place of birth for the foreign-born population - Austria (%)
Place of birth for the foreign-born population - Belgium (%)
Place of birth for the foreign-born population - France (%)
Place of birth for the foreign-born population - Germany (%)
Place of birth for the foreign-born population - Netherlands (%)
Place of birth for the foreign-born population - Switzerland (%)
Place of birth for the foreign-born population - Other Western Europe (%)
Place of birth for the foreign-born population - Greece (%)
Place of birth for the foreign-born population - Italy (%)
Place of birth for the foreign-born population - Portugal (%)
Place of birth for the foreign-born population - Spain (%)
Place of birth for the foreign-born population - Other Southern Europe (%)
Place of birth for the foreign-born population - Albania (%)
Place of birth for the foreign-born population - Belarus (%)
Place of birth for the foreign-born population - Bosnia and Herzegovina (%)
Place of birth for the foreign-born population - Bulgaria (%)
Place of birth for the foreign-born population - Croatia (%)
Place of birth for the foreign-born population - Czechoslovakia (%)
Place of birth for the foreign-born population - Hungary (%)
Place of birth for the foreign-born population - Latvia (%)
Place of birth for the foreign-born population - Lithuania (%)
Place of birth for the foreign-born population - North Macedonia (Macedonia) (%)
Place of birth for the foreign-born population - Moldova (%)
Place of birth for the foreign-born population - Poland (%)
Place of birth for the foreign-born population - Romania (%)
Place of birth for the foreign-born population - Russia (%)
Place of birth for the foreign-born population - Serbia (%)
Place of birth for the foreign-born population - Ukraine (%)
Place of birth for the foreign-born population - Other Eastern Europe (%)
Place of birth for the foreign-born population - China (%)
Place of birth for the foreign-born population - Hong Kong (%)
Place of birth for the foreign-born population - Taiwan (%)
Place of birth for the foreign-born population - Japan (%)
Place of birth for the foreign-born population - Korea (%)
Place of birth for the foreign-born population - Other Eastern Asia (%)
Place of birth for the foreign-born population - Afghanistan (%)
Place of birth for the foreign-born population - Bangladesh (%)
Place of birth for the foreign-born population - India (%)
Place of birth for the foreign-born population - Iran (%)
Place of birth for the foreign-born population - Kazakhstan (%)
Place of birth for the foreign-born population - Nepal (%)
Place of birth for the foreign-born population - Pakistan (%)
Place of birth for the foreign-born population - Sri Lanka (%)
Place of birth for the foreign-born population - Uzbekistan (%)
Place of birth for the foreign-born population - Other South Central Asia (%)
Place of birth for the foreign-born population - Burma (%)
Place of birth for the foreign-born population - Cambodia (%)
Place of birth for the foreign-born population - Indonesia (%)
Place of birth for the foreign-born population - Laos (%)
Place of birth for the foreign-born population - Malaysia (%)
Place of birth for the foreign-born population - Philippines (%)
Place of birth for the foreign-born population - Singapore (%)
Place of birth for the foreign-born population - Thailand (%)
Place of birth for the foreign-born population - Vietnam (%)
Place of birth for the foreign-born population - Other South Eastern Asia (%)
Place of birth for the foreign-born population - Armenia (%)
Place of birth for the foreign-born population - Iraq (%)
Place of birth for the foreign-born population - Israel (%)
Place of birth for the foreign-born population - Jordan (%)
Place of birth for the foreign-born population - Kuwait (%)
Place of birth for the foreign-born population - Lebanon (%)
Place of birth for the foreign-born population - Saudi Arabia (%)
Place of birth for the foreign-born population - Syria (%)
Place of birth for the foreign-born population - Turkey (%)
Place of birth for the foreign-born population - Yemen (%)
Place of birth for the foreign-born population - Other Western Asia (%)
Place of birth for the foreign-born population - Eritrea (%)
Place of birth for the foreign-born population - Ethiopia (%)
Place of birth for the foreign-born population - Kenya (%)
Place of birth for the foreign-born population - Somalia (%)
Place of birth for the foreign-born population - Uganda (%)
Place of birth for the foreign-born population - Zimbabwe (%)
Place of birth for the foreign-born population - Other Eastern Africa (%)
Place of birth for the foreign-born population - Cameroon (%)
Place of birth for the foreign-born population - Congo (%)
Place of birth for the foreign-born population - Democratic Republic of Congo (Zaire) (%)
Place of birth for the foreign-born population - Other Middle Africa (%)
Place of birth for the foreign-born population - Egypt (%)
Place of birth for the foreign-born population - Morocco (%)
Place of birth for the foreign-born population - Sudan (%)
Place of birth for the foreign-born population - Other Northern Africa (%)
Place of birth for the foreign-born population - South Africa (%)
Place of birth for the foreign-born population - Other Southern Africa (%)
Place of birth for the foreign-born population - Cabo Verde (%)
Place of birth for the foreign-born population - Ghana (%)
Place of birth for the foreign-born population - Liberia (%)
Place of birth for the foreign-born population - Nigeria (%)
Place of birth for the foreign-born population - Senegal (%)
Place of birth for the foreign-born population - Sierra Leone (%)
Place of birth for the foreign-born population - Other Western Africa (%)
Place of birth for the foreign-born population - Australia (%)
Place of birth for the foreign-born population - New Zealand (%)
Place of birth for the foreign-born population - Fiji (%)
Place of birth for the foreign-born population - Micronesia (%)
Place of birth for the foreign-born population - Bahamas (%)
Place of birth for the foreign-born population - Barbados (%)
Place of birth for the foreign-born population - Cuba (%)
Place of birth for the foreign-born population - Dominica (%)
Place of birth for the foreign-born population - Dominican Republic (%)
Place of birth for the foreign-born population - Grenada (%)
Place of birth for the foreign-born population - Haiti (%)
Place of birth for the foreign-born population - Jamaica (%)
Place of birth for the foreign-born population - St. Vincent and the Grenadines (%)
Place of birth for the foreign-born population - Trinidad and Tobago (%)
Place of birth for the foreign-born population - West Indies (%)
Place of birth for the foreign-born population - Other Caribbean (%)
Place of birth for the foreign-born population - Belize (%)
Place of birth for the foreign-born population - Costa Rica (%)
Place of birth for the foreign-born population - El Salvador (%)
Place of birth for the foreign-born population - Guatemala (%)
Place of birth for the foreign-born population - Honduras (%)
Place of birth for the foreign-born population - Mexico (%)
Place of birth for the foreign-born population - Nicaragua (%)
Place of birth for the foreign-born population - Panama (%)
Place of birth for the foreign-born population - Other Central America (%)
Place of birth for the foreign-born population - Argentina (%)
Place of birth for the foreign-born population - Bolivia (%)
Place of birth for the foreign-born population - Brazil (%)
Place of birth for the foreign-born population - Chile (%)
Place of birth for the foreign-born population - Colombia (%)
Place of birth for the foreign-born population - Ecuador (%)
Place of birth for the foreign-born population - Guyana (%)
Place of birth for the foreign-born population - Peru (%)
Place of birth for the foreign-born population - Uruguay (%)
Place of birth for the foreign-born population - Venezuela (%)
Place of birth for the foreign-born population - Other South America (%)
Place of birth for the foreign-born population - Canada (%)
Place of birth for the foreign-born population - Other Northern America (%)
Place of birth for the foreign-born population - Other (%)
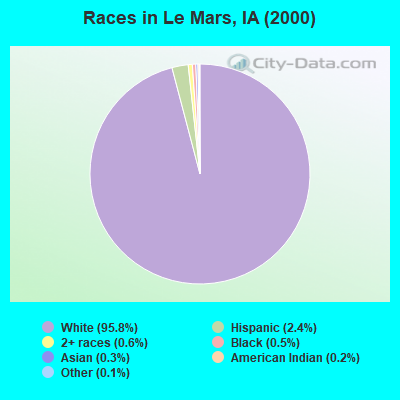
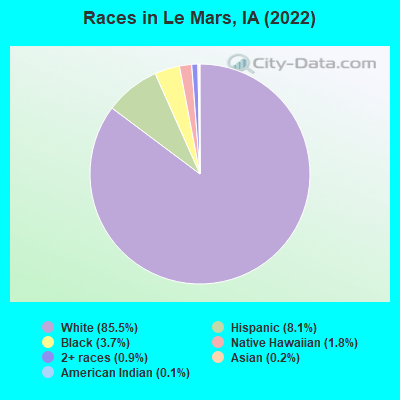
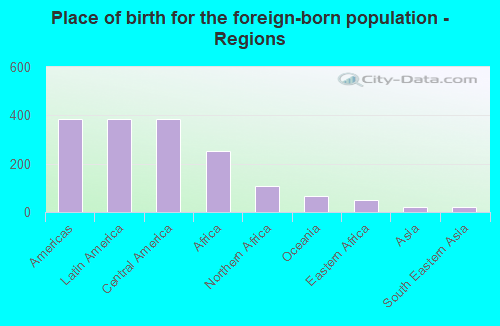
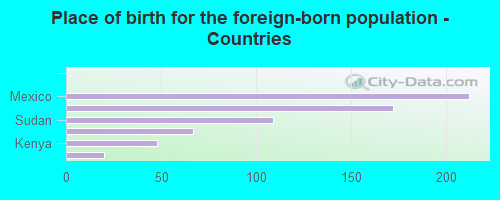
According to 2022 data, the most numerous races in Le Mars, IA are White alone (9,051 residents), Hispanic (860 residents), and Black alone (391 residents). 88.2% of Le Mars residents speak English at home. 6.9% of Le Mars, IA residents are foreign-born (3.6% born in Latin America, 2.4% born in Africa), which is 27.2% greater than the foreign-born rate of 5.0% across the entire state of Iowa.
Race distribution in Le Mars
2000 2022
2,710,344 92.6% White alone 82,473 2.8% Hispanic 60,744 2.1% Black alone 36,345 1.2% Asian alone 25,472 0.9% Two or more races 7,955 0.3% American Indian alone 2,103 0.07% Other race alone 888 0.03% Native Hawaiian and Other
2,650,110 82.8% White alone 218,024 6.8% Hispanic 119,004 3.7% Black alone 115,286 3.6% Two or more races 74,892 2.3% Asian alone 9,260 0.3% Other race alone 8,595 0.3% Native Hawaiian and Other 5,346 0.2% American Indian alone
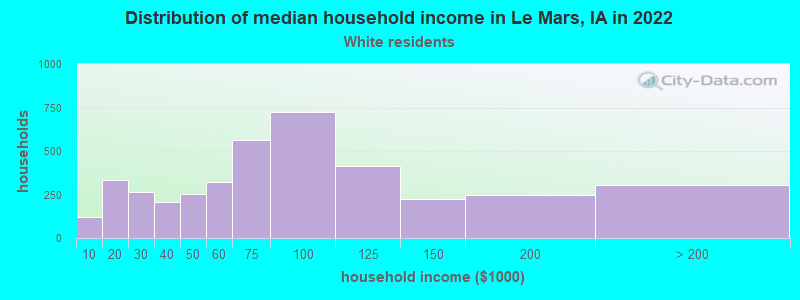
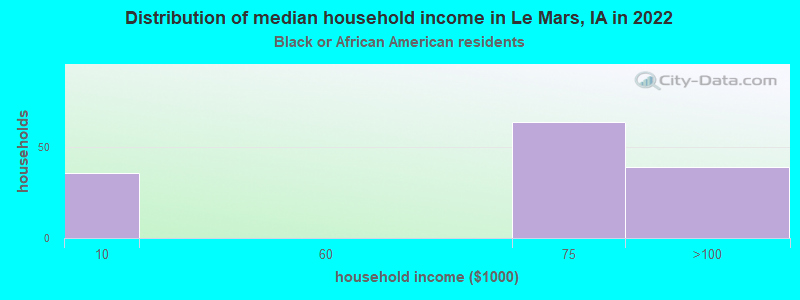
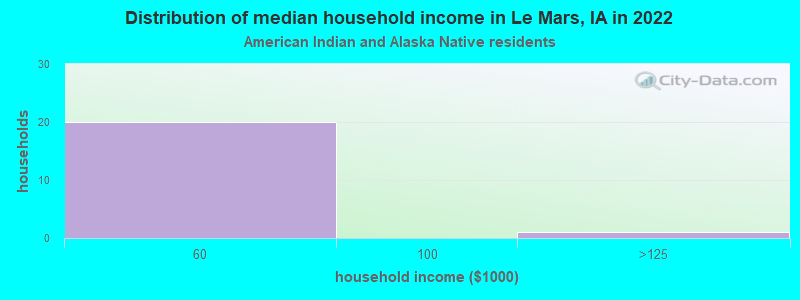
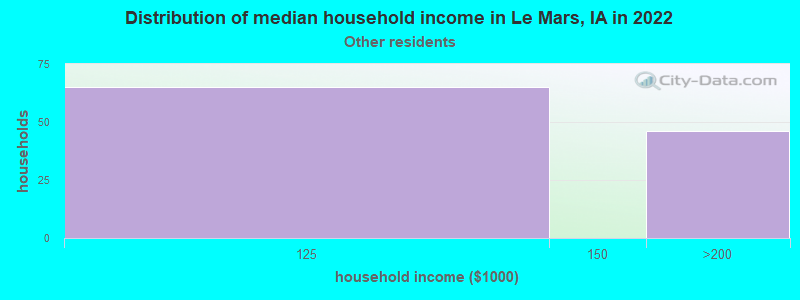
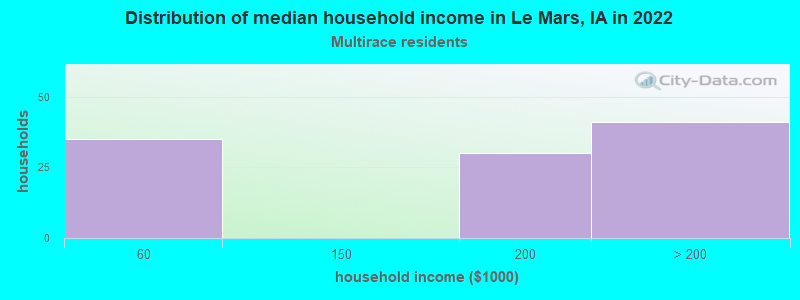
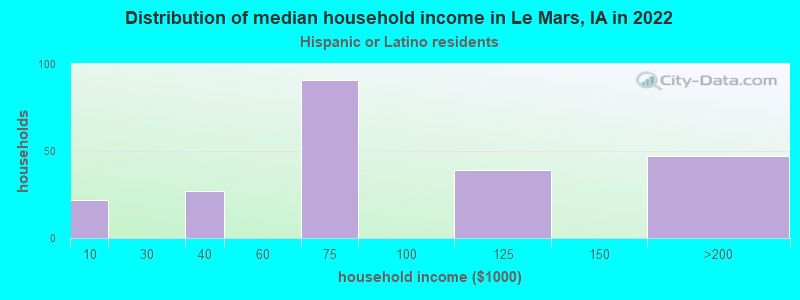
Income and house value in Le Mars Median household income in 2022 $74,061 White non-Hispanic householders$57,688 Black householdersover $200,000 Two or more races householders$78,417 Hispanic or Latino race householdersMedian 2022 house value $209,821 White Non-Hispanic householders$101,855 Some other race householders$101,855 Hispanic or Latino householders
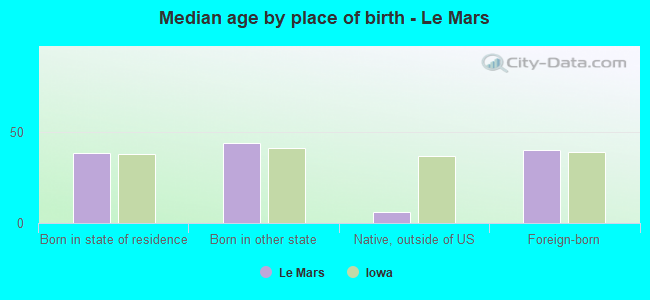
Median age by race in Le Mars
40.6 Median age for White residents39.9 43.1 26.1 Median age for Black or African American residents26.2 21.2 57.3 Median age for American Indian / Alaska Native residents-654,282,765.1 58.2 -719,077,567.4 Median age for Asian residents-729,641,693.1 -711,656,441.0 20.3 Median age for Native Hawaiian / Pacific Islander residents27.5 16.3 39.1 Median age for Other race residents6.0 39.3 32.5 Median age for Two or more races residents41.5 18.3 42.3 Median age for White alone residents40.5 42.9 30.1 Median age for Hispanic or Latino residents25.4 31.3
Owner/renter occupied households by race in Le Mars
House owners and renters - White residents 2,894 72.4% Owner occupied1,105 27.6% Renter occupiedHouse owners and renters - Black or African American residents 157 100.0% Renter occupiedHouse owners and renters - American Indian / Alaska Native residents 13 100.0% Owner occupiedHouse owners and renters - Native Hawaiian / Pacific Islander residents 10 100.0% Renter occupiedHouse owners and renters - Other race residents 72 68.5% Owner occupied33 31.5% Renter occupiedHouse owners and renters - Two or more races residents 21 20.2% Owner occupied84 79.8% Renter occupiedHouse owners and renters - White alone residents 2,892 73.8% Owner occupied1,025 26.2% Renter occupiedHouse owners and renters - Hispanic or Latino residents 94 42.9% Owner occupied126 57.1% Renter occupied
Language usage in Le Mars
English speakers - Total 88.2% of residents of Le Mars speak English at home.
6.7% of residents speak Spanish at home 219 32.6% Speak English very well453 67.4% Speak English less than very well5.2% of residents speak other language at home 341 65.5% Speak English very well180 34.5% Speak English less than very well
English speakers - Born in the United States 96.0% of residents of Le Mars speak English at home.
3.6% of residents speak Spanish at home 80 100.0% Speak English very well0.3% of residents speak other language at home 7 100.0% Speak English very well
English speakers - Native, born elsewhere 9.6% of residents of Le Mars speak English at home.
103.2% of residents speak other language at home 129 100.0% Speak English very well
English speakers - Foreign-born 5.7% of residents of Le Mars speak English at home.
48.7% of residents speak Spanish at home 75 20.3% Speak English very well295 79.7% Speak English less than very well46.3% of residents speak other language at home 194 55.1% Speak English very well158 44.9% Speak English less than very well
White (Caucasian) - Speak another language Native:
2.1% (177)Foreign-born:
92.9% (74)
Black or African American - Speak another language Native:
63.8% (88)Foreign-born:
100.0% (269)
Other race - Speak another language Native:
86.3% (126)Foreign-born:
100.0% (275)
Two or more races - Speak only English Native:
74.3% (150)Foreign-born:
64.4% (80)
Two or more races - Speak another language Native:
27.7% (56)Foreign-born:
43.7% (54)
Hispanic or Latino - Speak only English Native:
39.2% (148)Foreign-born:
9.5% (39)
Hispanic or Latino - Speak another language Native:
57.3% (216)Foreign-born:
90.0% (372)
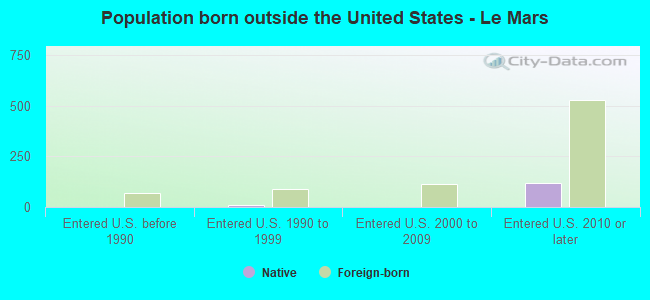
Foreign-born residents in Le Mars 727 residents are foreign born (3.6% Latin America , 2.4% Africa ).
Marital status for residents in Le Mars Marital status - White (Caucasian) population 15 years and over
Males 27.8% Never married61.6% Now married0.8% Separated3.9% Widowed5.9% DivorcedFemales 21.7% Never married56.1% Now married1.0% Separated10.9% Widowed10.3% DivorcedWomen who gave birth in the past 12 months Now married:
60.3% (77)Unmarried:
39.7% (51)
Women who did not give birth in the past 12 months Now married:
56.2% (987)Unmarried:
43.8% (769)
Marital status - Black or African American population 15 years and over
Males 53.9% Never married46.1% Now married0.0% Separated0.0% Widowed0.0% DivorcedFemales 43.8% Never married20.7% Now married9.9% Separated25.6% Widowed0.0% DivorcedWomen who did not give birth in the past 12 months Now married:
32.1% (24)Unmarried:
67.9% (52)
Marital status - Native Hawaiian / Pacific Islander population 15 years and over
Males 58.5% Never married41.5% Now married0.0% Separated0.0% Widowed0.0% DivorcedFemales 60.0% Never married40.0% Now married0.0% Separated0.0% Widowed0.0% DivorcedWomen who gave birth in the past 12 months Now married:
0.0% (0)Unmarried:
100.0% (26)
Marital status - Other race population 15 years and over
Males 0.0% Never married79.5% Now married0.0% Separated0.0% Widowed20.5% DivorcedFemales 28.4% Never married71.6% Now married0.0% Separated0.0% Widowed0.0% DivorcedWomen who did not give birth in the past 12 months Now married:
71.6% (75)Unmarried:
28.4% (30)
Marital status - Two or more races population 15 years and over
Males 39.0% Never married34.6% Now married0.0% Separated0.0% Widowed26.5% DivorcedFemales 4.5% Never married95.5% Now married0.0% Separated0.0% Widowed0.0% DivorcedWomen who did not give birth in the past 12 months Now married:
95.5% (63)Unmarried:
4.5% (3)
Marital status - White alone, not Hispanic / Latino population 15 years and over
Males 27.4% Never married61.6% Now married0.8% Separated4.0% Widowed6.2% DivorcedFemales 22.3% Never married55.5% Now married0.5% Separated11.2% Widowed10.6% DivorcedWomen who gave birth in the past 12 months Now married:
60.3% (78)Unmarried:
39.7% (51)
Women who did not give birth in the past 12 months Now married:
54.6% (942)Unmarried:
45.4% (782)
Marital status - Hispanic or Latino population 15 years and over
Males 29.5% Never married64.4% Now married0.0% Separated0.0% Widowed6.1% DivorcedFemales 10.2% Never married81.3% Now married8.4% Separated0.0% Widowed0.0% DivorcedWomen who did not give birth in the past 12 months Now married:
87.6% (179)Unmarried:
12.4% (25)
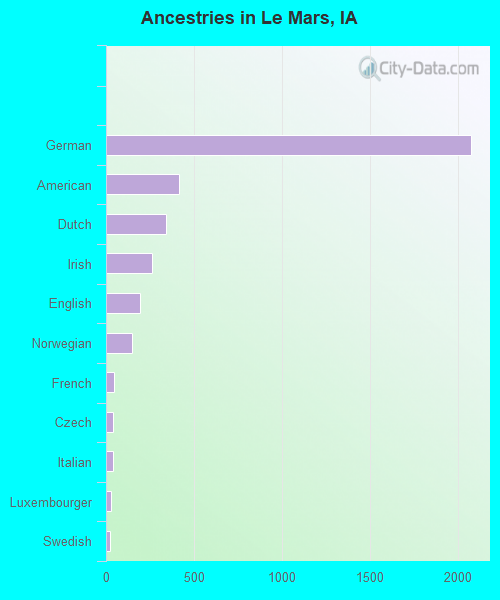
Ancestries in Le Mars
2,073 42.3% German415 8.5% American343 7.0% Dutch263 5.4% Irish193 3.9% English146 3.0% Norwegian46 0.9% French42 0.9% Czech37 0.8% Italian27 0.6% Luxembourger22 0.4% Swedish18 0.4% European17 0.3% Danish8 0.2% British8 0.2% Eastern European
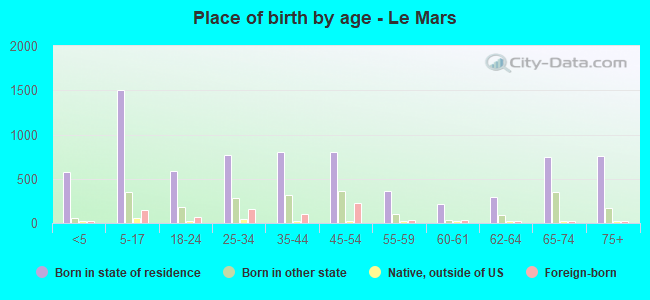
Children Nativity (place of birth) in Le Mars
Children under 6 years - Living with two parents Both parents native 614 100.0% NativeBoth parents foreign-born 151 100.0% NativeOne native, one foreign-born parent 32 100.0% NativeChildren under 6 years - Living with one parent Native parent 153 100.0% NativeForeign-born parent 27 100.0% NativeChildren 6 to 17 years - Living with two parents Both parents native 1,181 100.0% NativeBoth parents foreign-born 79 35.0% Native147 65.0% Foreign-bornChildren 6 to 17 years - Living with one parent Native parent 352 100.0% NativeForeign-born parent 8 51.8% Native7 48.2% Foreign-born
Grandparents responsible for own grandchildren in Le Mars
Grandparents (30 to 59 years) White / Caucasian 19 100.0% Not responsible for grandchildrenNative Hawaiian / Pacific Islander 25 100.0% Responsible for grandchildrenWhite alone, not Hispanic / Latino 22 100.0% Not responsible for grandchildren
Grandparents (60 years and over)