Races in Lea Hill, Washington (WA) Detailed Stats
Ancestries, Foreign-born residents, place of birth

Recent posts about races in Lea Hill, Washington on our local forum with over 2,400,000 registered users:
 | North or South? (33 replies) |
| Large family considering job relocation with Amazon--where to live?? (30 replies) |
| Best school districts?? (21 replies) |
9.3% of Lea Hill, WA residents are foreign-born (4.1% born in Asia, 2.8% born in Europe, 1.3% born in Latin America, 1.1% born in North America), which is 61.3% less than the foreign-born rate of 15.0% across the entire state of Washington.
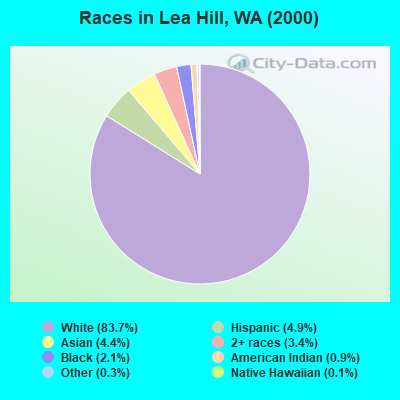
Race distribution in Lea Hill

- 9,10083.7%White alone
- 5364.9%Hispanic
- 4804.4%Asian alone
- 3713.4%Two or more races
- 2332.1%Black alone
- 980.9%American Indian alone
- 380.3%Other race alone
- 150.1%Native Hawaiian and Other
Pacific Islander alone
2000
2022
-
- 4,652,49078.9%White alone
- 441,5097.5%Hispanic
- 319,4015.4%Asian alone
- 184,6313.1%Black alone
- 175,9263.0%Two or more races
- 85,3961.4%American Indian alone
- 22,7790.4%Native Hawaiian and Other
Pacific Islander alone - 11,9890.2%Other race alone

-
- 4,941,45663.5%White alone
- 1,093,31314.0%Hispanic
- 755,8329.7%Asian alone
- 523,4486.7%Two or more races
- 299,5373.8%Black alone
- 69,0240.9%American Indian alone
- 52,2310.7%Native Hawaiian and Other
Pacific Islander alone - 50,9450.7%Other race alone

Income and house value in Lea Hill
- Median household income in 2022
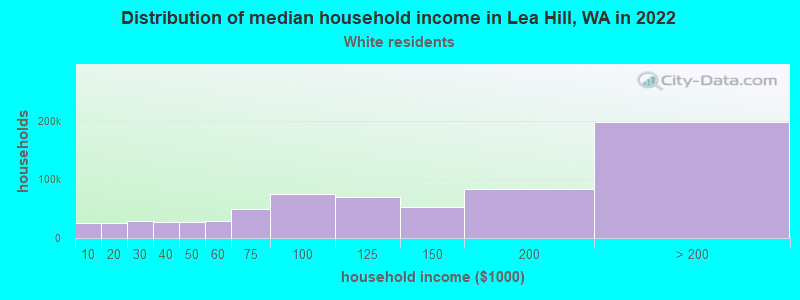
- $145,497White non-Hispanic householders
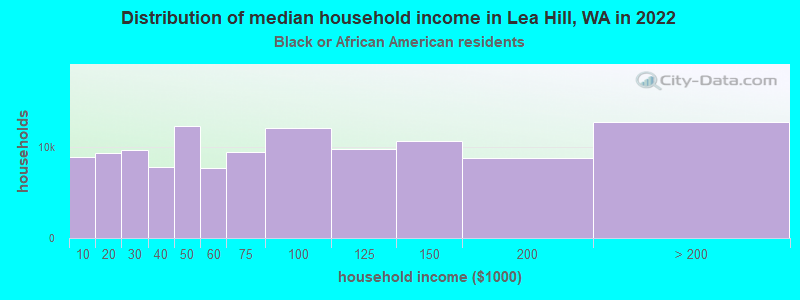
- $140,606Black householders
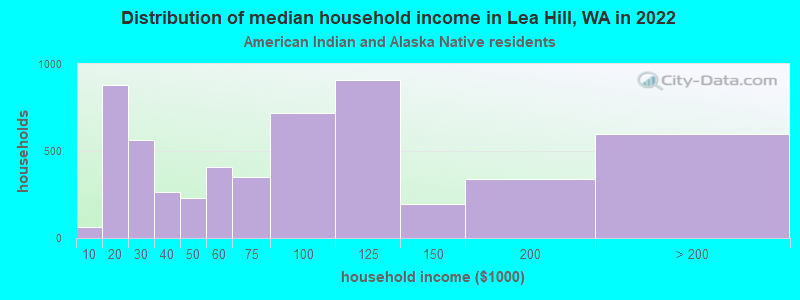
- $85,492American Indian and Alaska Native householders
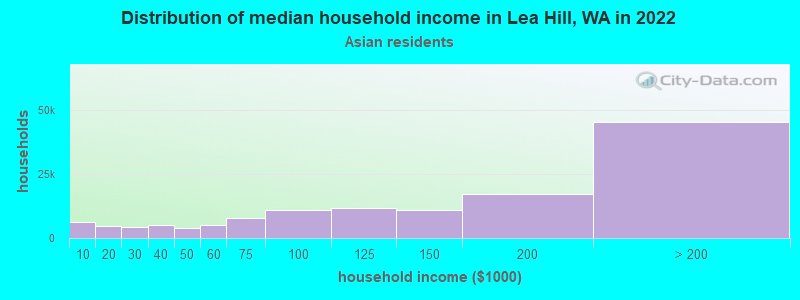
- $100,565Asian householders
- $76,668Some other race householders
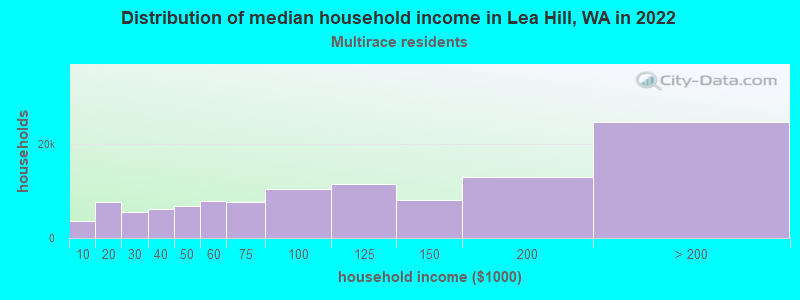
- $146,827Two or more races householders
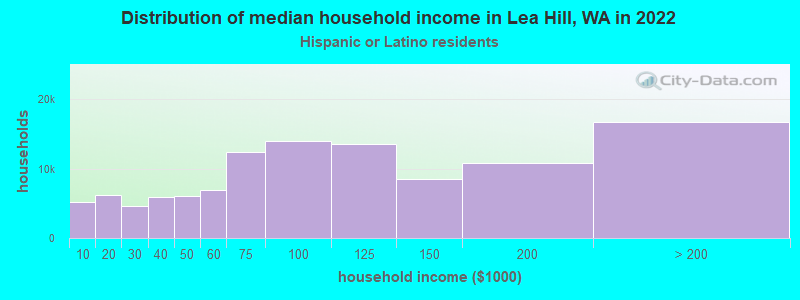
- $134,248Hispanic or Latino race householders
- Median 2022 house value
- $810,407White Non-Hispanic householders
- $741,095Black or African American householders
- $876,671Asian householders
- $463,089Some other race householders
- $623,038Two or more races householders
- $519,071Hispanic or Latino householders
Household income for White non-Hispanic householders
Household income for Black householders
Household income for American Indian and Alaska Native householders
Household income for Asian householders
Household income for Two or more races householders
Household income for Hispanic or Latino race householders
Foreign-born residents in Lea Hill
1,011 residents are foreign born (4.1% Asia, 2.8% Europe, 1.3% Latin America, 1.1% North America).
| This city: | 9.3% |
| Washington: | 10.4% |
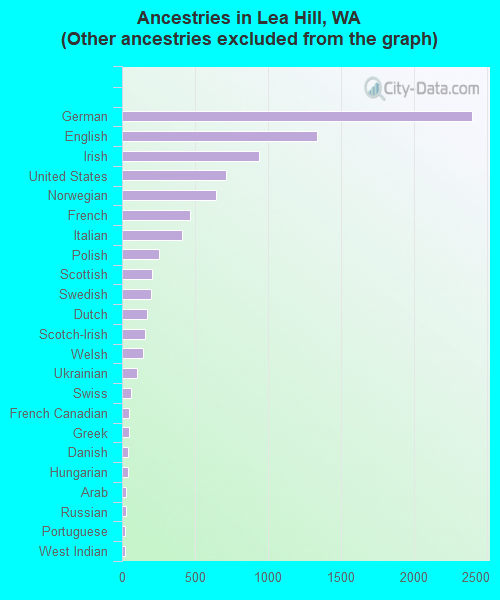
Ancestries in Lea Hill

- 2,63723.6%Other
- 2,39621.5%German
- 1,34012.0%English
- 9378.4%Irish
- 7116.4%United States
- 6465.8%Norwegian
- 4664.2%French
- 4083.7%Italian
- 2552.3%Polish
- 2091.9%Scottish
- 1981.8%Swedish
- 1701.5%Dutch
- 1611.4%Scotch-Irish
- 1411.3%Welsh
- 1000.9%Ukrainian
- 610.5%Swiss
- 460.4%French Canadian
- 450.4%Greek
- 410.4%Danish
- 380.3%Hungarian
- 300.3%Arab
- 260.2%Russian
- 220.2%Portuguese
- 220.2%West Indian
- 150.1%Slovak
- 120.1%Lithuanian
- 110.10%Subsaharan African
- 80.07%Czech
Zip codes: 98092.