Races in Leacock-Leola-Bareville, Pennsylvania (PA) Detailed Stats
Ancestries, Foreign-born residents, place of birth

Discuss Leacock-Leola-Bareville, Pennsylvania races on our local forum with over 2,400,000 registered users
7.5% of Leacock-Leola-Bareville, PA residents are foreign-born (4.3% born in Asia, 1.6% born in Latin America, 1.1% born in Europe), which is 6.1% greater than the foreign-born rate of 7.0% across the entire state of Pennsylvania.
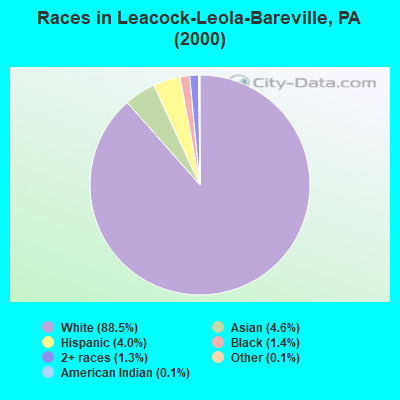
Race distribution in Leacock-Leola-Bareville

- 5,86388.5%White alone
- 3044.6%Asian alone
- 2624.0%Hispanic
- 931.4%Black alone
- 881.3%Two or more races
- 80.1%Other race alone
- 70.1%American Indian alone
2000
2022
-
- 10,322,45584.1%White alone
- 1,202,4379.8%Black alone
- 394,0883.2%Hispanic
- 218,2961.8%Asian alone
- 113,0970.9%Two or more races
- 13,0860.1%Other race alone
- 14,9040.1%American Indian alone
- 2,6910.02%Native Hawaiian and Other
Pacific Islander alone

-
- 9,487,22873.1%White alone
- 1,311,58110.1%Black alone
- 1,115,9978.6%Hispanic
- 493,9423.8%Two or more races
- 487,1243.8%Asian alone
- 63,5820.5%Other race alone
- 10,1300.08%American Indian alone
- 2,4240.02%Native Hawaiian and Other
Pacific Islander alone

Income and house value in Leacock-Leola-Bareville
- Median household income in 2022
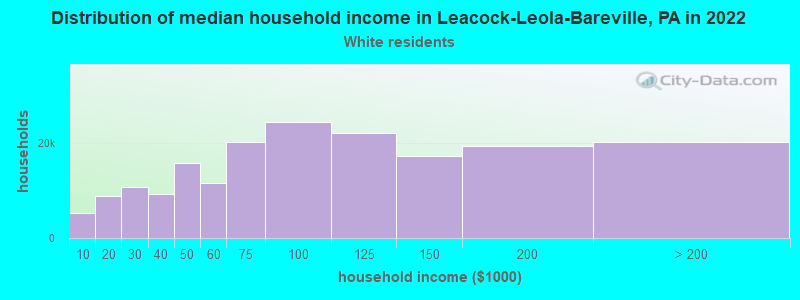
- $90,149White non-Hispanic householders
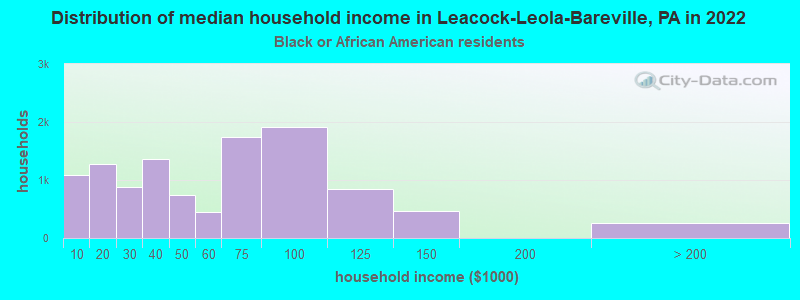
- $75,020Black householders
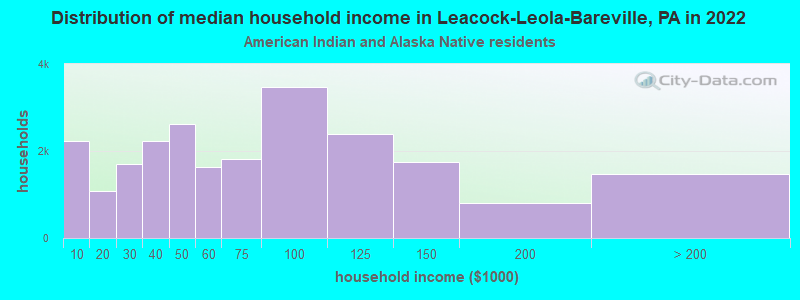
- $108,435American Indian and Alaska Native householders
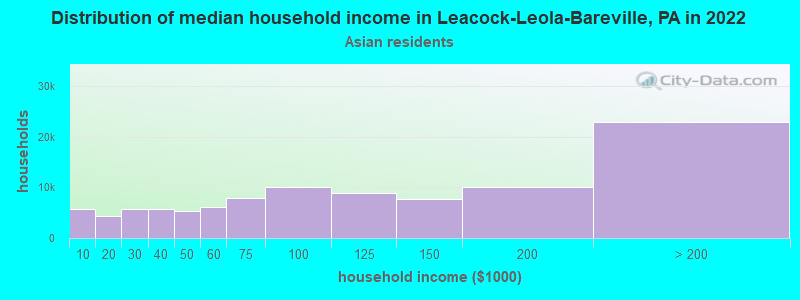
- $104,785Asian householders
- $120,207Some other race householders
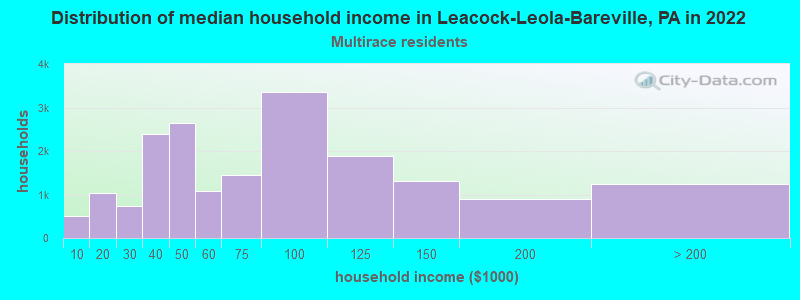
- $94,068Two or more races householders
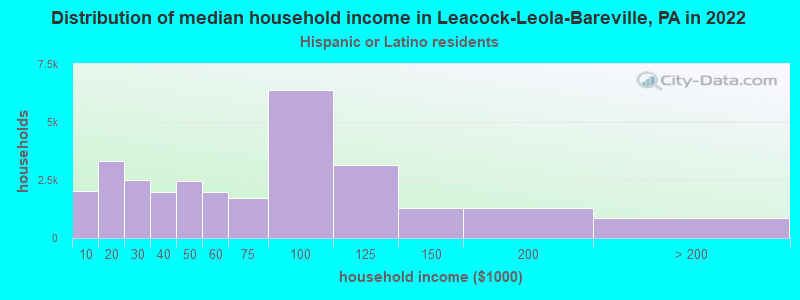
- $90,393Hispanic or Latino race householders
- Median 2022 house value
- $319,003White Non-Hispanic householders
- $394,505Black or African American householders
- $546,238American Indian or Alaska Native householders
- $346,436Asian householders
- $273,119Some other race householders
- $348,135Two or more races householders
- $293,269Hispanic or Latino householders
Household income for White non-Hispanic householders
Household income for Black householders
Household income for American Indian and Alaska Native householders
Household income for Asian householders
Household income for Two or more races householders
Household income for Hispanic or Latino race householders
Foreign-born residents in Leacock-Leola-Bareville
494 residents are foreign born (4.3% Asia, 1.6% Latin America, 1.1% Europe).
| This city: | 7.5% |
| Pennsylvania: | 4.1% |
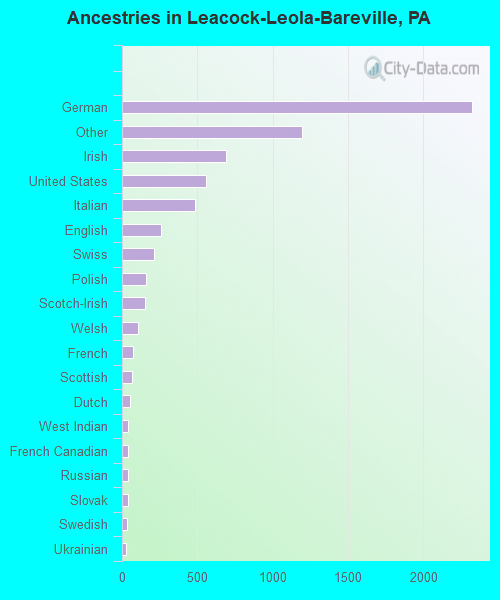
Ancestries in Leacock-Leola-Bareville

- 2,32034.9%German
- 1,19218.0%Other
- 69310.4%Irish
- 5578.4%United States
- 4837.3%Italian
- 2583.9%English
- 2153.2%Swiss
- 1612.4%Polish
- 1522.3%Scotch-Irish
- 1051.6%Welsh
- 711.1%French
- 651.0%Scottish
- 500.8%Dutch
- 400.6%West Indian
- 390.6%French Canadian
- 380.6%Russian
- 370.6%Slovak
- 340.5%Swedish
- 250.4%Ukrainian
- 190.3%Danish
- 190.3%Lithuanian
- 190.3%Norwegian
- 160.2%Hungarian
- 100.2%Subsaharan African
- 90.1%Greek
- 70.1%Czech
- 60.09%Arab
Zip codes: 17540.