Races in Lebanon, Tennessee (TN) Detailed Stats
Data:
Races - White alone (%)
Races - White alone (% change since 2000)
Races - Black alone (%)
Races - Black alone (% change since 2000)
Races - American Indian alone (%)
Races - American Indian alone (% change since 2000)
Races - Asian alone (%)
Races - Asian alone (% change since 2000)
Races - Hispanic (%)
Races - Hispanic (% change since 2000)
Races - Native Hawaiian and Other Pacific Islander alone (%)
Races - Native Hawaiian and Other Pacific Islander alone (% change since 2000)
Races - Two or more races(%)
Races - Two or more races(% change since 2000)
Races - Other race alone (%)
Races - Other race alone (% change since 2000)
Racial diversity
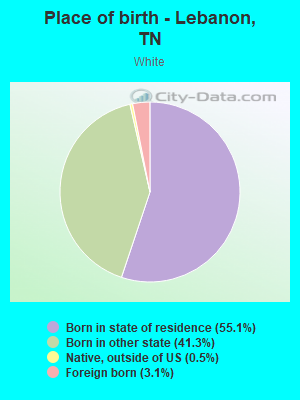
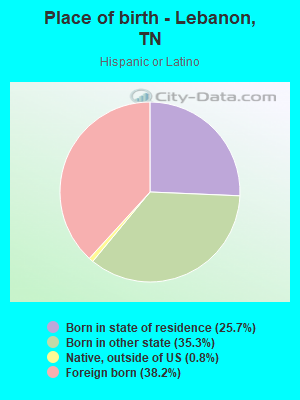
Place of birth - Born in state of residence (%)
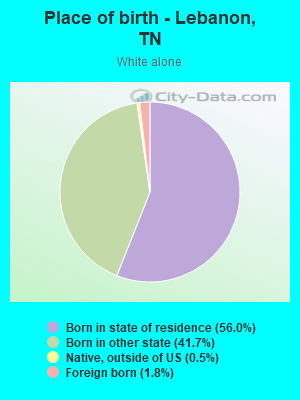
Place of birth - Born in state of residence (%) - White
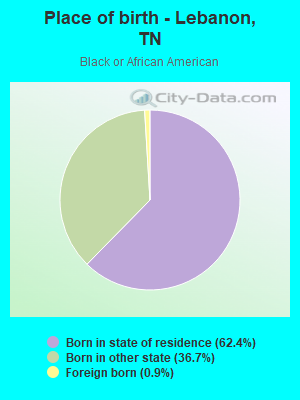
Place of birth - Born in state of residence (%) - Black or African American
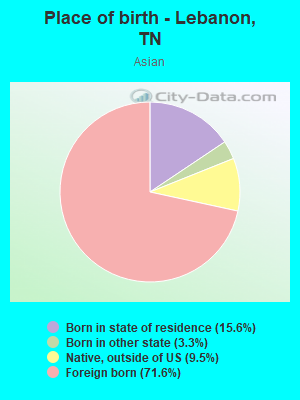
Place of birth - Born in state of residence (%) - Asian
Place of birth - Born in state of residence (%) - Hispanic or Latino
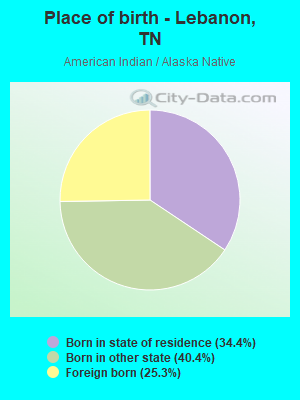
Place of birth - Born in state of residence (%) - American Indian and Alaska Native
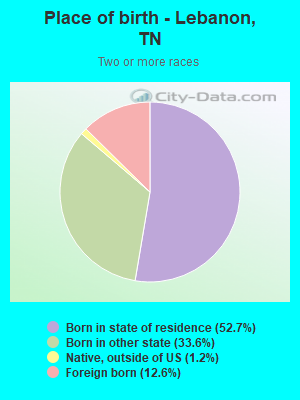
Place of birth - Born in state of residence (%) - Multirace
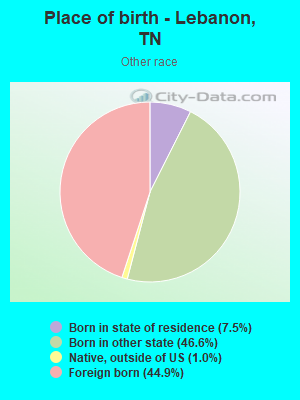
Place of birth - Born in state of residence (%) - Other Race
Place of birth - Born in other state (%)
Place of birth - Born in other state (%) - White
Place of birth - Born in other state (%) - Black or African American
Place of birth - Born in other state (%) - Asian
Place of birth - Born in other state (%) - Hispanic or Latino
Place of birth - Born in other state (%) - American Indian and Alaska Native
Place of birth - Born in other state (%) - Multirace
Place of birth - Born in other state (%) - Other Race
Place of birth - Native, outside of US (%)
Place of birth - Native, outside of US (%) - White
Place of birth - Native, outside of US (%) - Black or African American
Place of birth - Native, outside of US (%) - Asian
Place of birth - Native, outside of US (%) - Hispanic or Latino
Place of birth - Native, outside of US (%) - American Indian and Alaska Native
Place of birth - Native, outside of US (%) - Multirace
Place of birth - Native, outside of US (%) - Other Race
Place of birth - Foreign born (%)
Place of birth - Foreign born (%) - White
Place of birth - Foreign born (%) - Black or African American
Place of birth - Foreign born (%) - Asian
Place of birth - Foreign born (%) - Hispanic or Latino
Place of birth - Foreign born (%) - American Indian and Alaska Native
Place of birth - Foreign born (%) - Multirace
Place of birth - Foreign born (%) - Other Race
Residents speaking English at home (%)
Residents speaking English at home - Born in the United States (%)
Residents speaking English at home - Native, born elsewhere (%)
Residents speaking English at home - Foreign born (%)
Residents speaking Spanish at home (%)
Residents speaking Spanish at home - Born in the United States (%)
Residents speaking Spanish at home - Native, born elsewhere (%)
Residents speaking Spanish at home - Foreign born (%)
Residents speaking other language at home (%)
Residents speaking other language at home - Born in the United States (%)
Residents speaking other language at home - Native, born elsewhere (%)
Residents speaking other language at home - Foreign born (%)
Marital status - Never married (%)
Marital status - Now married (%)
Marital status - Separated (%)
Marital status - Widowed (%)
Marital status - Divorced (%)
Ancestries Reported - Arab (%)
Ancestries Reported - Czech (%)
Ancestries Reported - Danish (%)
Ancestries Reported - Dutch (%)
Ancestries Reported - English (%)
Ancestries Reported - French (%)
Ancestries Reported - French Canadian (%)
Ancestries Reported - German (%)
Ancestries Reported - Greek (%)
Ancestries Reported - Hungarian (%)
Ancestries Reported - Irish (%)
Ancestries Reported - Italian (%)
Ancestries Reported - Lithuanian (%)
Ancestries Reported - Norwegian (%)
Ancestries Reported - Polish (%)
Ancestries Reported - Portuguese (%)
Ancestries Reported - Russian (%)
Ancestries Reported - Scotch-Irish (%)
Ancestries Reported - Scottish (%)
Ancestries Reported - Slovak (%)
Ancestries Reported - Subsaharan African (%)
Ancestries Reported - Swedish (%)
Ancestries Reported - Swiss (%)
Ancestries Reported - Ukrainian (%)
Ancestries Reported - United States (%)
Ancestries Reported - Welsh (%)
Ancestries Reported - West Indian (%)
Ancestries Reported - Other (%)
Geographical mobility - Same house 1 year ago (%)
Geographical mobility - Same house 1 year ago (%) - White
Geographical mobility - Same house 1 year ago (%) - Black or African American
Geographical mobility - Same house 1 year ago (%) - Asian
Geographical mobility - Same house 1 year ago (%) - Hispanic or Latino
Geographical mobility - Same house 1 year ago (%) - American Indian and Alaska Native
Geographical mobility - Same house 1 year ago (%) - Multirace
Geographical mobility - Same house 1 year ago (%) - Other Race
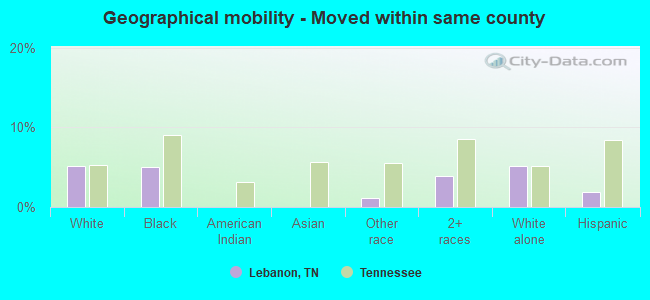
Geographical mobility - Moved within same county (%)
Geographical mobility - Moved within same county (%) - White
Geographical mobility - Moved within same county (%) - Black or African American
Geographical mobility - Moved within same county (%) - Asian
Geographical mobility - Moved within same county (%) - Hispanic or Latino
Geographical mobility - Moved within same county (%) - American Indian and Alaska Native
Geographical mobility - Moved within same county (%) - Multirace
Geographical mobility - Moved within same county (%) - Other Race
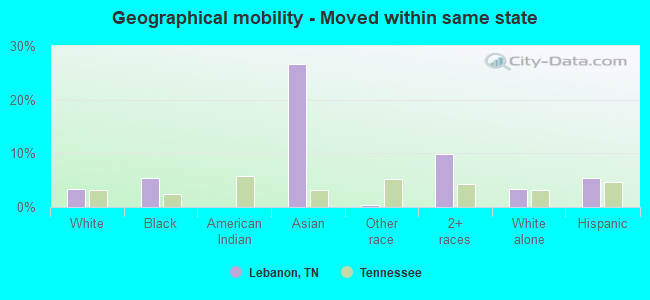
Geographical mobility - Moved from different county within same state (%)
Geographical mobility - Moved from different county within same state (%) - White
Geographical mobility - Moved from different county within same state (%) - Black or African American
Geographical mobility - Moved from different county within same state (%) - Asian
Geographical mobility - Moved from different county within same state (%) - Hispanic or Latino
Geographical mobility - Moved from different county within same state (%) - American Indian and Alaska Native
Geographical mobility - Moved from different county within same state (%) - Multirace
Geographical mobility - Moved from different county within same state (%) - Other Race
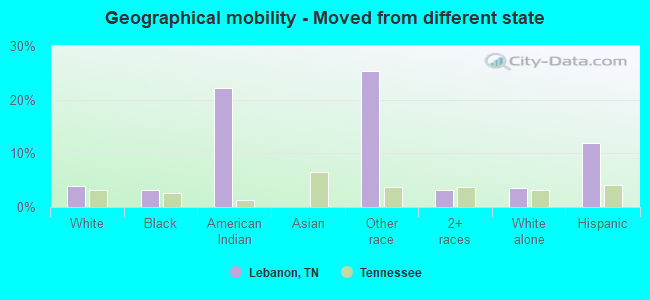
Geographical mobility - Moved from different state (%)
Geographical mobility - Moved from different state (%) - White
Geographical mobility - Moved from different state (%) - Black or African American
Geographical mobility - Moved from different state (%) - Asian
Geographical mobility - Moved from different state (%) - Hispanic or Latino
Geographical mobility - Moved from different state (%) - American Indian and Alaska Native
Geographical mobility - Moved from different state (%) - Multirace
Geographical mobility - Moved from different state (%) - Other Race
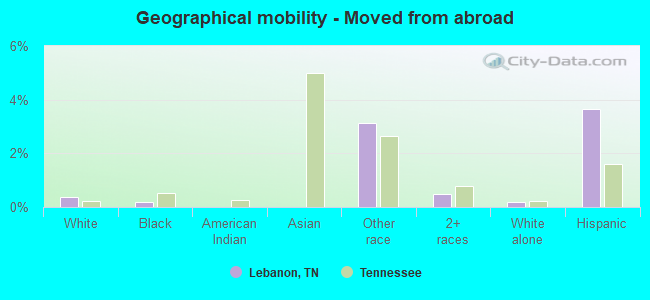
Geographical mobility - Moved from abroad (%)
Geographical mobility - Moved from abroad (%) - White
Geographical mobility - Moved from abroad (%) - Black or African American
Geographical mobility - Moved from abroad (%) - Asian
Geographical mobility - Moved from abroad (%) - Hispanic or Latino
Geographical mobility - Moved from abroad (%) - American Indian and Alaska Native
Geographical mobility - Moved from abroad (%) - Multirace
Geographical mobility - Moved from abroad (%) - Other Race
Place of birth for the foreign-born population - Ireland (%)
Place of birth for the foreign-born population - Denmark (%)
Place of birth for the foreign-born population - Norway (%)
Place of birth for the foreign-born population - Sweden (%)
Place of birth for the foreign-born population - United Kingdom (%)
Place of birth for the foreign-born population - England (%)
Place of birth for the foreign-born population - Scotland (%)
Place of birth for the foreign-born population - Other Northern Europe (%)
Place of birth for the foreign-born population - Austria (%)
Place of birth for the foreign-born population - Belgium (%)
Place of birth for the foreign-born population - France (%)
Place of birth for the foreign-born population - Germany (%)
Place of birth for the foreign-born population - Netherlands (%)
Place of birth for the foreign-born population - Switzerland (%)
Place of birth for the foreign-born population - Other Western Europe (%)
Place of birth for the foreign-born population - Greece (%)
Place of birth for the foreign-born population - Italy (%)
Place of birth for the foreign-born population - Portugal (%)
Place of birth for the foreign-born population - Spain (%)
Place of birth for the foreign-born population - Other Southern Europe (%)
Place of birth for the foreign-born population - Albania (%)
Place of birth for the foreign-born population - Belarus (%)
Place of birth for the foreign-born population - Bosnia and Herzegovina (%)
Place of birth for the foreign-born population - Bulgaria (%)
Place of birth for the foreign-born population - Croatia (%)
Place of birth for the foreign-born population - Czechoslovakia (%)
Place of birth for the foreign-born population - Hungary (%)
Place of birth for the foreign-born population - Latvia (%)
Place of birth for the foreign-born population - Lithuania (%)
Place of birth for the foreign-born population - North Macedonia (Macedonia) (%)
Place of birth for the foreign-born population - Moldova (%)
Place of birth for the foreign-born population - Poland (%)
Place of birth for the foreign-born population - Romania (%)
Place of birth for the foreign-born population - Russia (%)
Place of birth for the foreign-born population - Serbia (%)
Place of birth for the foreign-born population - Ukraine (%)
Place of birth for the foreign-born population - Other Eastern Europe (%)
Place of birth for the foreign-born population - China (%)
Place of birth for the foreign-born population - Hong Kong (%)
Place of birth for the foreign-born population - Taiwan (%)
Place of birth for the foreign-born population - Japan (%)
Place of birth for the foreign-born population - Korea (%)
Place of birth for the foreign-born population - Other Eastern Asia (%)
Place of birth for the foreign-born population - Afghanistan (%)
Place of birth for the foreign-born population - Bangladesh (%)
Place of birth for the foreign-born population - India (%)
Place of birth for the foreign-born population - Iran (%)
Place of birth for the foreign-born population - Kazakhstan (%)
Place of birth for the foreign-born population - Nepal (%)
Place of birth for the foreign-born population - Pakistan (%)
Place of birth for the foreign-born population - Sri Lanka (%)
Place of birth for the foreign-born population - Uzbekistan (%)
Place of birth for the foreign-born population - Other South Central Asia (%)
Place of birth for the foreign-born population - Burma (%)
Place of birth for the foreign-born population - Cambodia (%)
Place of birth for the foreign-born population - Indonesia (%)
Place of birth for the foreign-born population - Laos (%)
Place of birth for the foreign-born population - Malaysia (%)
Place of birth for the foreign-born population - Philippines (%)
Place of birth for the foreign-born population - Singapore (%)
Place of birth for the foreign-born population - Thailand (%)
Place of birth for the foreign-born population - Vietnam (%)
Place of birth for the foreign-born population - Other South Eastern Asia (%)
Place of birth for the foreign-born population - Armenia (%)
Place of birth for the foreign-born population - Iraq (%)
Place of birth for the foreign-born population - Israel (%)
Place of birth for the foreign-born population - Jordan (%)
Place of birth for the foreign-born population - Kuwait (%)
Place of birth for the foreign-born population - Lebanon (%)
Place of birth for the foreign-born population - Saudi Arabia (%)
Place of birth for the foreign-born population - Syria (%)
Place of birth for the foreign-born population - Turkey (%)
Place of birth for the foreign-born population - Yemen (%)
Place of birth for the foreign-born population - Other Western Asia (%)
Place of birth for the foreign-born population - Eritrea (%)
Place of birth for the foreign-born population - Ethiopia (%)
Place of birth for the foreign-born population - Kenya (%)
Place of birth for the foreign-born population - Somalia (%)
Place of birth for the foreign-born population - Uganda (%)
Place of birth for the foreign-born population - Zimbabwe (%)
Place of birth for the foreign-born population - Other Eastern Africa (%)
Place of birth for the foreign-born population - Cameroon (%)
Place of birth for the foreign-born population - Congo (%)
Place of birth for the foreign-born population - Democratic Republic of Congo (Zaire) (%)
Place of birth for the foreign-born population - Other Middle Africa (%)
Place of birth for the foreign-born population - Egypt (%)
Place of birth for the foreign-born population - Morocco (%)
Place of birth for the foreign-born population - Sudan (%)
Place of birth for the foreign-born population - Other Northern Africa (%)
Place of birth for the foreign-born population - South Africa (%)
Place of birth for the foreign-born population - Other Southern Africa (%)
Place of birth for the foreign-born population - Cabo Verde (%)
Place of birth for the foreign-born population - Ghana (%)
Place of birth for the foreign-born population - Liberia (%)
Place of birth for the foreign-born population - Nigeria (%)
Place of birth for the foreign-born population - Senegal (%)
Place of birth for the foreign-born population - Sierra Leone (%)
Place of birth for the foreign-born population - Other Western Africa (%)
Place of birth for the foreign-born population - Australia (%)
Place of birth for the foreign-born population - New Zealand (%)
Place of birth for the foreign-born population - Fiji (%)
Place of birth for the foreign-born population - Micronesia (%)
Place of birth for the foreign-born population - Bahamas (%)
Place of birth for the foreign-born population - Barbados (%)
Place of birth for the foreign-born population - Cuba (%)
Place of birth for the foreign-born population - Dominica (%)
Place of birth for the foreign-born population - Dominican Republic (%)
Place of birth for the foreign-born population - Grenada (%)
Place of birth for the foreign-born population - Haiti (%)
Place of birth for the foreign-born population - Jamaica (%)
Place of birth for the foreign-born population - St. Vincent and the Grenadines (%)
Place of birth for the foreign-born population - Trinidad and Tobago (%)
Place of birth for the foreign-born population - West Indies (%)
Place of birth for the foreign-born population - Other Caribbean (%)
Place of birth for the foreign-born population - Belize (%)
Place of birth for the foreign-born population - Costa Rica (%)
Place of birth for the foreign-born population - El Salvador (%)
Place of birth for the foreign-born population - Guatemala (%)
Place of birth for the foreign-born population - Honduras (%)
Place of birth for the foreign-born population - Mexico (%)
Place of birth for the foreign-born population - Nicaragua (%)
Place of birth for the foreign-born population - Panama (%)
Place of birth for the foreign-born population - Other Central America (%)
Place of birth for the foreign-born population - Argentina (%)
Place of birth for the foreign-born population - Bolivia (%)
Place of birth for the foreign-born population - Brazil (%)
Place of birth for the foreign-born population - Chile (%)
Place of birth for the foreign-born population - Colombia (%)
Place of birth for the foreign-born population - Ecuador (%)
Place of birth for the foreign-born population - Guyana (%)
Place of birth for the foreign-born population - Peru (%)
Place of birth for the foreign-born population - Uruguay (%)
Place of birth for the foreign-born population - Venezuela (%)
Place of birth for the foreign-born population - Other South America (%)
Place of birth for the foreign-born population - Canada (%)
Place of birth for the foreign-born population - Other Northern America (%)
Place of birth for the foreign-born population - Other (%)
Latest news about races in Lebanon, TN collected exclusively by city-data.com from local newspapers, TV, and radio stations
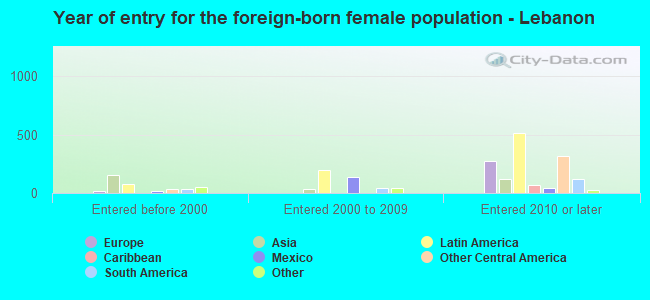
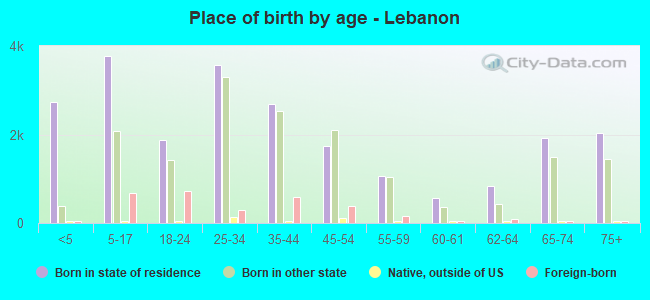
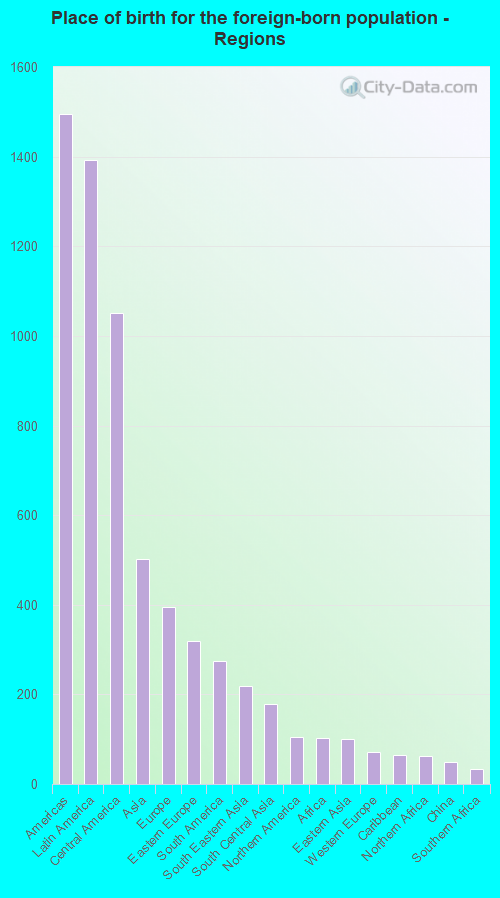
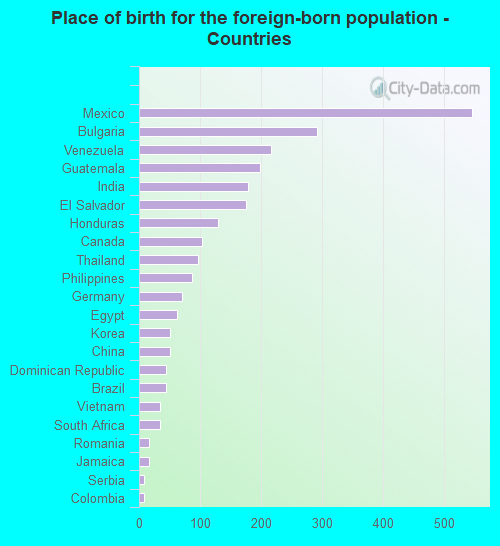
According to 2022 data, the most numerous races in Lebanon, TN are White alone (31,109 residents), Black alone (5,316 residents), and Hispanic (3,338 residents). 92.0% of Lebanon residents speak English at home. 5.9% of Lebanon, TN residents are foreign-born (3.4% born in Latin America, 1.2% born in Asia, 1.0% born in Europe), which is 15.8% greater than the foreign-born rate of 5.0% across the entire state of Tennessee.
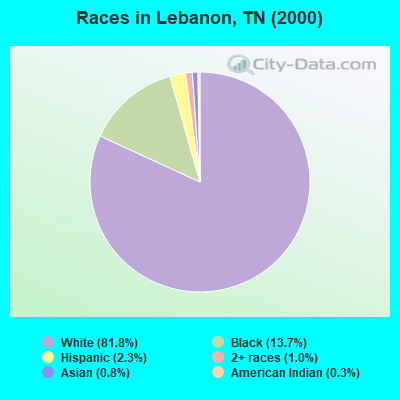
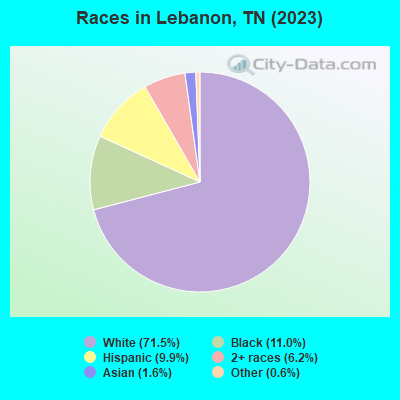
Race distribution in Lebanon
2000 2022
4,505,930 79.2% White alone 928,204 16.3% Black alone 123,838 2.2% Hispanic 54,824 1.0% Two or more races 56,077 1.0% Asian alone 13,820 0.2% American Indian alone 4,780 0.08% Other race alone 1,810 0.03% Native Hawaiian and Other
5,070,026 71.9% White alone 1,089,738 15.5% Black alone 442,629 6.3% Hispanic 279,381 4.0% Two or more races 131,817 1.9% Asian alone 26,972 0.4% Other race alone 6,387 0.09% American Indian alone 4,389 0.06% Native Hawaiian and Other
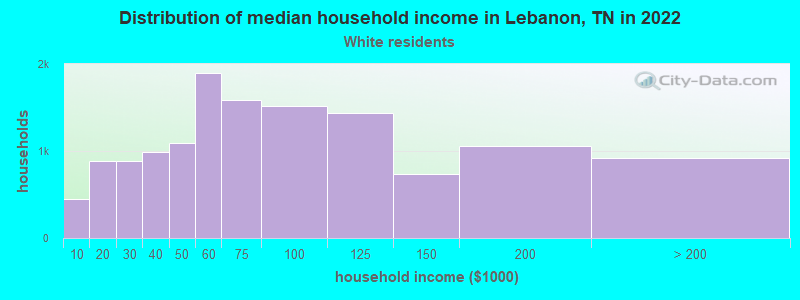
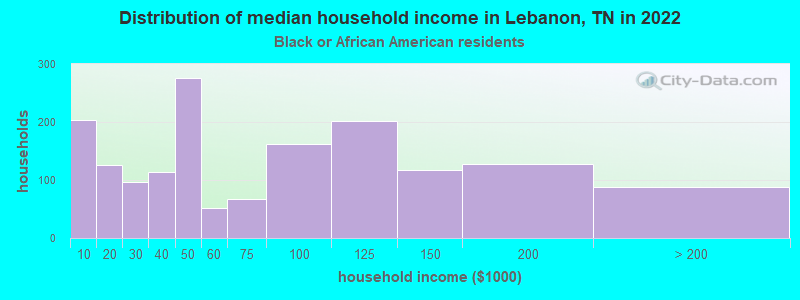
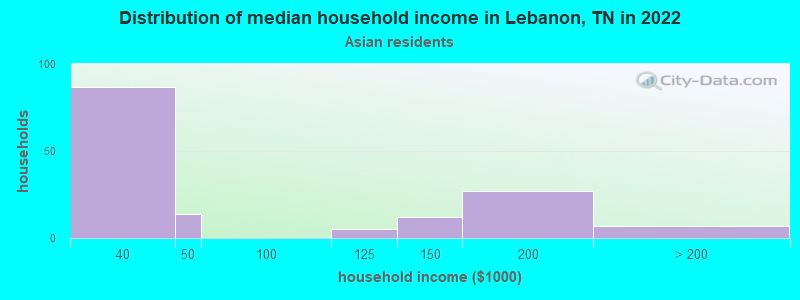
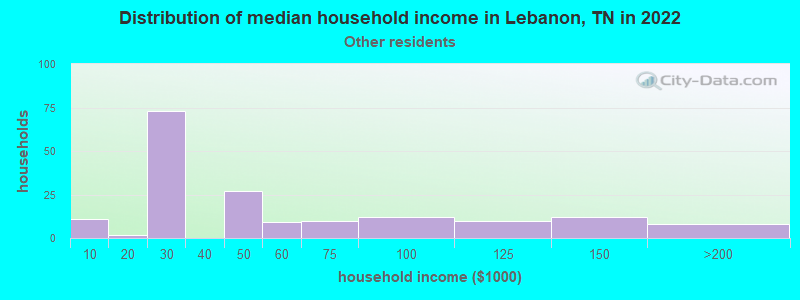
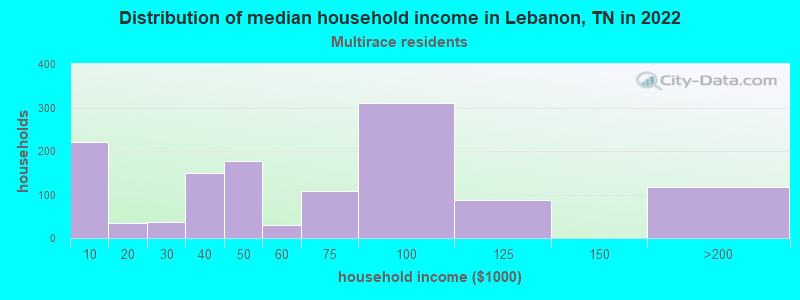
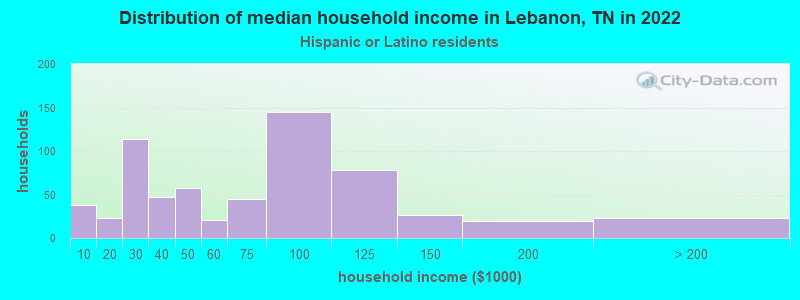
Income and house value in Lebanon Median household income in 2022 $63,415 White non-Hispanic householders$49,654 Black householders$71,580 Two or more races householders$64,241 Hispanic or Latino race householdersMedian 2022 house value $429,296 White Non-Hispanic householders$266,087 Black or African American householders$566,699 American Indian or Alaska Native householders over $1,000,000 Asian householders$464,868 Two or more races householders$414,301 Hispanic or Latino householders
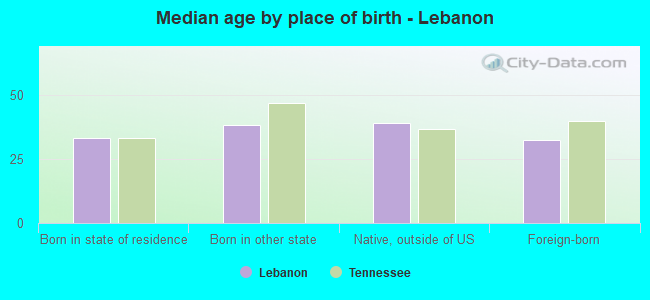
Median age by race in Lebanon
37.6 Median age for White residents35.9 40.6 34.5 Median age for Black or African American residents38.1 29.5 20.2 Median age for American Indian / Alaska Native residents35.6 -801,477,376.9 40.8 Median age for Asian residents35.5 62.2 -666,666,666.0 Median age for Native Hawaiian / Pacific Islander residents-666,666,666.0 -666,666,666.0 15.3 Median age for Other race residents12.0 16.4 24.2 Median age for Two or more races residents23.0 25.4 37.9 Median age for White alone residents35.7 41.0 23.0 Median age for Hispanic or Latino residents30.7 18.9
Owner/renter occupied households by race in Lebanon
House owners and renters - White residents 8,035 59.1% Owner occupied5,566 40.9% Renter occupiedHouse owners and renters - Black or African American residents 861 40.4% Owner occupied1,271 59.6% Renter occupiedHouse owners and renters - American Indian / Alaska Native residents 10 100.0% Owner occupiedHouse owners and renters - Asian residents 105 36.3% Owner occupied184 63.7% Renter occupiedHouse owners and renters - Other race residents 24 13.7% Owner occupied151 86.3% Renter occupiedHouse owners and renters - Two or more races residents 561 61.4% Owner occupied353 38.6% Renter occupiedHouse owners and renters - White alone residents 7,984 59.0% Owner occupied5,544 41.0% Renter occupiedHouse owners and renters - Hispanic or Latino residents 242 40.7% Owner occupied352 59.3% Renter occupied
Language usage in Lebanon
English speakers - Total 92.0% of residents of Lebanon speak English at home.
4.7% of residents speak Spanish at home 855 46.3% Speak English very well992 53.7% Speak English less than very well2.7% of residents speak other language at home 581 54.5% Speak English very well485 45.5% Speak English less than very well
English speakers - Born in the United States 97.1% of residents of Lebanon speak English at home.
2.2% of residents speak Spanish at home 303 87.3% Speak English very well44 12.7% Speak English less than very well0.5% of residents speak other language at home 54 70.1% Speak English very well23 29.9% Speak English less than very well
English speakers - Native, born elsewhere 77.0% of residents of Lebanon speak English at home.
8.9% of residents speak Spanish at home 22 100.0% Speak English very well
English speakers - Foreign-born 13.6% of residents of Lebanon speak English at home.
47.8% of residents speak Spanish at home 306 25.2% Speak English very well908 74.8% Speak English less than very well33.4% of residents speak other language at home 451 53.2% Speak English very well397 46.8% Speak English less than very well
White (Caucasian) - Speak only English Native:
99.1% (28,363)Foreign-born:
16.1% (160)
White (Caucasian) - Speak another language Native:
1.1% (304)Foreign-born:
80.7% (798)
Black or African American - Speak only English Native:
99.7% (3,829)Foreign-born:
90.3% (51)
Black or African American - Speak another language Native:
0.3% (10)Foreign-born:
14.1% (8)
Asian - Speak only English Native:
92.3% (106)Foreign-born:
25.5% (158)
Asian - Speak another language Native:
24.7% (28)Foreign-born:
78.5% (487)
Other race - Speak another language Native:
36.2% (151)Foreign-born:
100.0% (423)
Two or more races - Speak only English Native:
80.2% (2,201)Foreign-born:
3.1% (13)
Two or more races - Speak another language Native:
22.0% (605)Foreign-born:
100.0% (427)
White alone - Speak only English Native:
99.2% (28,220)Foreign-born:
27.1% (154)
White alone - Speak another language Native:
0.8% (238)Foreign-born:
51.2% (292)
Hispanic or Latino - Speak only English Native:
60.2% (961)Foreign-born:
4.8% (58)
Hispanic or Latino - Speak another language Native:
37.2% (593)Foreign-born:
100.0% (1,206)
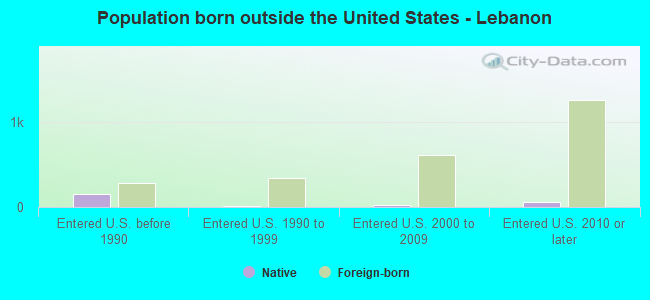
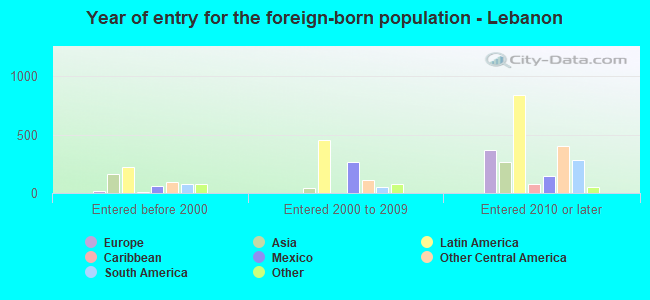
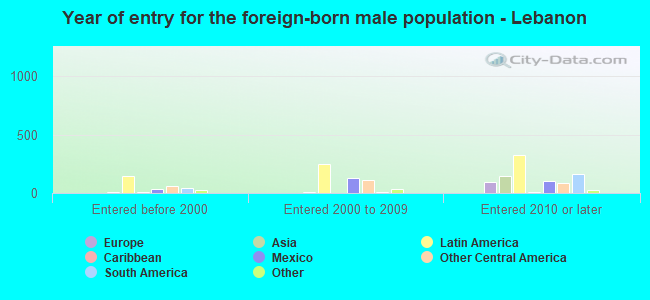
Foreign-born residents in Lebanon 2,498 residents are foreign born (3.4% Latin America , 1.2% Asia , 1.0% Europe ).
This city:
5.9%Tennessee:
5.4%
Marital status for residents in Lebanon Marital status - White (Caucasian) population 15 years and over
Males 30.3% Never married52.5% Now married1.9% Separated4.1% Widowed11.2% DivorcedFemales 23.7% Never married47.7% Now married2.3% Separated11.9% Widowed14.4% DivorcedWomen who gave birth in the past 12 months Now married:
62.2% (270)Unmarried:
37.8% (164)
Women who did not give birth in the past 12 months Now married:
45.8% (3,466)Unmarried:
54.2% (4,098)
Marital status - Black or African American population 15 years and over
Males 37.1% Never married39.3% Now married2.4% Separated1.9% Widowed19.2% DivorcedFemales 50.6% Never married22.4% Now married4.1% Separated12.3% Widowed10.6% DivorcedWomen who gave birth in the past 12 months Now married:
62.9% (28)Unmarried:
37.1% (17)
Women who did not give birth in the past 12 months Now married:
21.0% (297)Unmarried:
79.0% (1,116)
Marital status - American Indian / Alaska Native population 15 years and over
Males 40.7% Never married37.0% Now married0.0% Separated0.0% Widowed22.2% DivorcedFemales 100.0% Never married0.0% Now married0.0% Separated0.0% Widowed0.0% DivorcedWomen who did not give birth in the past 12 months Now married:
0.0% (0)Unmarried:
100.0% (14)
Marital status - Asian population 15 years and over
Males 19.1% Never married79.4% Now married1.5% Separated0.0% Widowed0.0% DivorcedFemales 4.6% Never married80.3% Now married15.1% Separated0.0% Widowed0.0% DivorcedWomen who gave birth in the past 12 months Now married:
100.0% (5)Unmarried:
0.0% (0)
Women who did not give birth in the past 12 months Now married:
85.9% (89)Unmarried:
14.1% (15)
Marital status - Other race population 15 years and over
Males 55.0% Never married40.8% Now married0.0% Separated0.0% Widowed4.2% DivorcedFemales 47.6% Never married24.9% Now married12.3% Separated0.0% Widowed15.1% DivorcedWomen who gave birth in the past 12 months Now married:
31.2% (12)Unmarried:
68.8% (26)
Women who did not give birth in the past 12 months Now married:
40.3% (117)Unmarried:
59.7% (173)
Marital status - Two or more races population 15 years and over
Males 60.1% Never married36.9% Now married1.3% Separated0.0% Widowed1.7% DivorcedFemales 51.0% Never married20.4% Now married0.2% Separated16.1% Widowed12.3% DivorcedWomen who gave birth in the past 12 months Now married:
77.0% (59)Unmarried:
23.0% (18)
Women who did not give birth in the past 12 months Now married:
17.1% (105)Unmarried:
82.9% (510)
Marital status - White alone, not Hispanic / Latino population 15 years and over
Males 30.4% Never married52.1% Now married1.8% Separated4.2% Widowed11.4% DivorcedFemales 23.2% Never married48.1% Now married2.2% Separated12.2% Widowed14.4% DivorcedWomen who gave birth in the past 12 months Now married:
69.4% (272)Unmarried:
30.6% (120)
Women who did not give birth in the past 12 months Now married:
45.9% (3,405)Unmarried:
54.1% (4,012)
Marital status - Hispanic or Latino population 15 years and over
Males 43.9% Never married50.4% Now married2.5% Separated0.0% Widowed3.2% DivorcedFemales 46.3% Never married33.7% Now married7.7% Separated0.0% Widowed12.3% DivorcedWomen who gave birth in the past 12 months Now married:
42.5% (60)Unmarried:
57.5% (82)
Women who did not give birth in the past 12 months Now married:
40.0% (285)Unmarried:
60.0% (427)
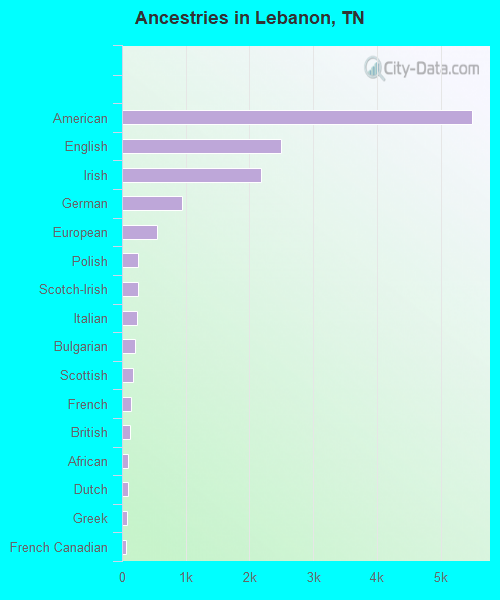
Ancestries in Lebanon
5,487 25.6% American2,495 11.7% English2,188 10.2% Irish948 4.4% German557 2.6% European252 1.2% Polish248 1.2% Scotch-Irish234 1.1% Italian201 0.9% Bulgarian166 0.8% Scottish138 0.6% French130 0.6% British100 0.5% African93 0.4% Dutch86 0.4% Greek66 0.3% French Canadian42 0.2% Northern European41 0.2% Jamaican34 0.2% South African32 0.1% Welsh29 0.1% Swedish27 0.1% Russian24 0.1% Hungarian22 0.1% Portuguese18 0.08% Ghanaian16 0.07% Brazilian16 0.07% Eastern European15 0.07% Finnish14 0.07% Egyptian14 0.07% Israeli14 0.07% Romanian13 0.06% Canadian11 0.05% Trinidadian and Tobagonian8 0.04% Serbian7 0.03% Czech6 0.03% Somali2 0.01% Nigerian
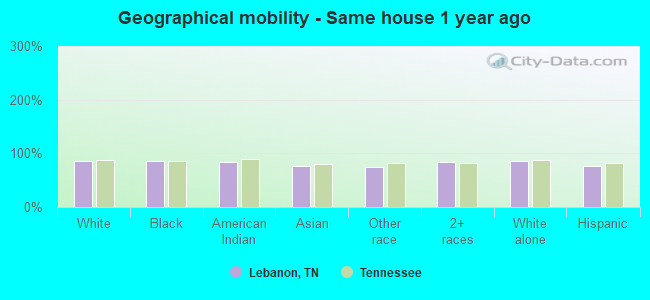
Geographical mobility in Lebanon Same house 1 year ago 26,762 85.1% White (Caucasian)3,580 86.4% Black or African American43 83.4% American Indian / Alaska Native514 75.8% Asian771 75.5% Other race3,684 83.2% Two or more races26,213 85.4% White alone, not Hispanic / Latino2,284 77.3% Hispanic or LatinoMoved within same county 1,601 5.1% White / Caucasian210 5.1% Black or African American11 1.1% Other race173 3.9% Two or more races1,589 5.2% White alone, not Hispanic / Latino54 1.8% Hispanic or LatinoMoved within same state 1,034 3.3% White / Caucasian221 5.3% Black or African American181 26.7% Asian4 0.4% Other race435 9.8% Two or more races1,038 3.4% White alone, not Hispanic / Latino161 5.4% Hispanic or LatinoMoved from different state 1,253 4.0% White / Caucasian130 3.1% Black or African American11 22.2% American Indian / Alaska Native259 25.4% Other race143 3.2% Two or more races1,071 3.5% White alone, not Hispanic / Latino354 12.0% Hispanic or LatinoMoved from abroad 119 0.4% White7 0.2% Black or African American32 3.1% Other race22 0.5% Two or more races58 0.2% White alone, not Hispanic / Latino108 3.6% Hispanic or Latino
Children Nativity (place of birth) in Lebanon
Children under 6 years - Living with two parents Both parents native 1,717 94.8% Native95 5.2% Foreign-bornBoth parents foreign-born 58 100.0% NativeOne native, one foreign-born parent 27 100.0% NativeChildren under 6 years - Living with one parent Native parent 948 100.0% NativeForeign-born parent 209 99.5% Native1 0.5% Foreign-bornChildren 6 to 17 years - Living with two parents Both parents native 3,072 91.3% Native292 8.7% Foreign-bornBoth parents foreign-born 303 85.7% Native51 14.3% Foreign-bornOne native, one foreign-born parent 117 100.0% NativeChildren 6 to 17 years - Living with one parent Native parent 1,449 97.2% Native41 2.8% Foreign-bornForeign-born parent 152 71.3% Native61 28.7% Foreign-born
Grandparents responsible for own grandchildren in Lebanon
Grandparents (30 to 59 years) White / Caucasian 259 75.6% Responsible for grandchildren84 24.4% Not responsible for grandchildrenBlack or African American 57 100.0% Responsible for grandchildrenAsian 8 100.0% Not responsible for grandchildrenOther race 34 100.0% Not responsible for grandchildrenWhite alone, not Hispanic / Latino 209 71.4% Responsible for grandchildren84 28.6% Not responsible for grandchildrenHispanic or Latino 64 67.5% Responsible for grandchildren31 32.5% Not responsible for grandchildrenGrandparents (60 years and over) White / Caucasian 62 29.5% Responsible for grandchildren147 70.5% Not responsible for grandchildrenBlack or African American 48 68.6% Responsible for grandchildren22 31.4% Not responsible for grandchildrenAsian 7 100.0% Not responsible for grandchildrenWhite alone, not Hispanic / Latino 56 27.5% Responsible for grandchildren147 72.5% Not responsible for grandchildren