Races in Leisure World, Maryland (MD) Detailed Stats
Data:
Races - White alone (%)
Races - White alone (% change since 2000)
Races - Black alone (%)
Races - Black alone (% change since 2000)
Races - American Indian alone (%)
Races - American Indian alone (% change since 2000)
Races - Asian alone (%)
Races - Asian alone (% change since 2000)
Races - Hispanic (%)
Races - Hispanic (% change since 2000)
Races - Native Hawaiian and Other Pacific Islander alone (%)
Races - Native Hawaiian and Other Pacific Islander alone (% change since 2000)
Races - Two or more races(%)
Races - Two or more races(% change since 2000)
Races - Other race alone (%)
Races - Other race alone (% change since 2000)
Racial diversity
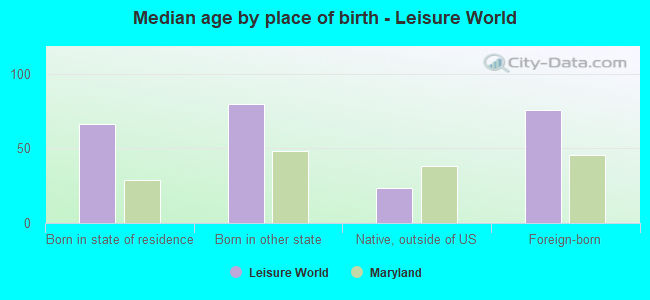
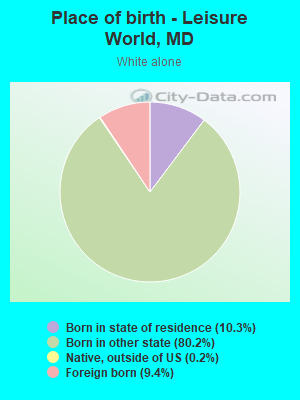
Place of birth - Born in state of residence (%)
Place of birth - Born in state of residence (%) - White
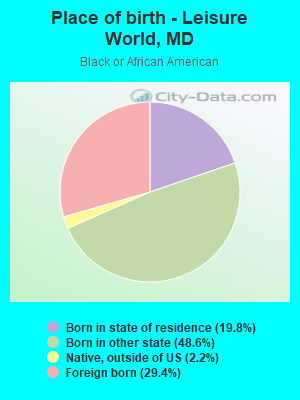
Place of birth - Born in state of residence (%) - Black or African American
Place of birth - Born in state of residence (%) - Asian
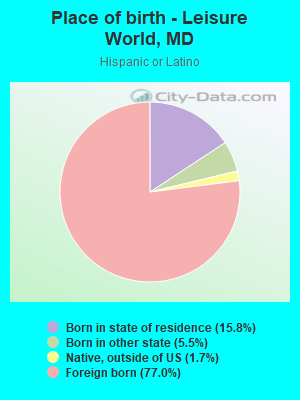
Place of birth - Born in state of residence (%) - Hispanic or Latino
Place of birth - Born in state of residence (%) - American Indian and Alaska Native
Place of birth - Born in state of residence (%) - Multirace
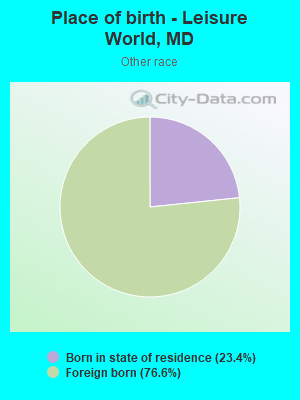
Place of birth - Born in state of residence (%) - Other Race
Place of birth - Born in other state (%)
Place of birth - Born in other state (%) - White
Place of birth - Born in other state (%) - Black or African American
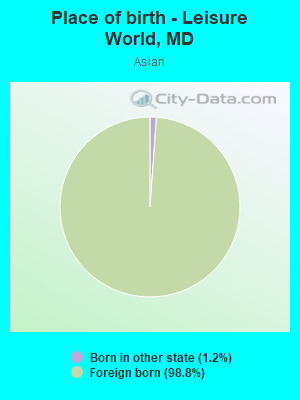
Place of birth - Born in other state (%) - Asian
Place of birth - Born in other state (%) - Hispanic or Latino
Place of birth - Born in other state (%) - American Indian and Alaska Native
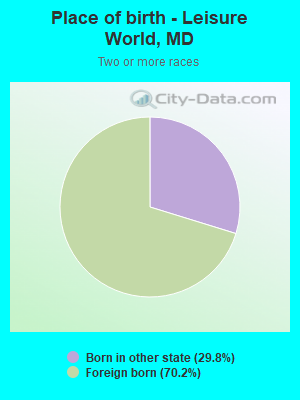
Place of birth - Born in other state (%) - Multirace
Place of birth - Born in other state (%) - Other Race
Place of birth - Native, outside of US (%)
Place of birth - Native, outside of US (%) - White
Place of birth - Native, outside of US (%) - Black or African American
Place of birth - Native, outside of US (%) - Asian
Place of birth - Native, outside of US (%) - Hispanic or Latino
Place of birth - Native, outside of US (%) - American Indian and Alaska Native
Place of birth - Native, outside of US (%) - Multirace
Place of birth - Native, outside of US (%) - Other Race
Place of birth - Foreign born (%)
Place of birth - Foreign born (%) - White
Place of birth - Foreign born (%) - Black or African American
Place of birth - Foreign born (%) - Asian
Place of birth - Foreign born (%) - Hispanic or Latino
Place of birth - Foreign born (%) - American Indian and Alaska Native
Place of birth - Foreign born (%) - Multirace
Place of birth - Foreign born (%) - Other Race
Residents speaking English at home (%)
Residents speaking English at home - Born in the United States (%)
Residents speaking English at home - Native, born elsewhere (%)
Residents speaking English at home - Foreign born (%)
Residents speaking Spanish at home (%)
Residents speaking Spanish at home - Born in the United States (%)
Residents speaking Spanish at home - Native, born elsewhere (%)
Residents speaking Spanish at home - Foreign born (%)
Residents speaking other language at home (%)
Residents speaking other language at home - Born in the United States (%)
Residents speaking other language at home - Native, born elsewhere (%)
Residents speaking other language at home - Foreign born (%)
Marital status - Never married (%)
Marital status - Now married (%)
Marital status - Separated (%)
Marital status - Widowed (%)
Marital status - Divorced (%)
Ancestries Reported - Arab (%)
Ancestries Reported - Czech (%)
Ancestries Reported - Danish (%)
Ancestries Reported - Dutch (%)
Ancestries Reported - English (%)
Ancestries Reported - French (%)
Ancestries Reported - French Canadian (%)
Ancestries Reported - German (%)
Ancestries Reported - Greek (%)
Ancestries Reported - Hungarian (%)
Ancestries Reported - Irish (%)
Ancestries Reported - Italian (%)
Ancestries Reported - Lithuanian (%)
Ancestries Reported - Norwegian (%)
Ancestries Reported - Polish (%)
Ancestries Reported - Portuguese (%)
Ancestries Reported - Russian (%)
Ancestries Reported - Scotch-Irish (%)
Ancestries Reported - Scottish (%)
Ancestries Reported - Slovak (%)
Ancestries Reported - Subsaharan African (%)
Ancestries Reported - Swedish (%)
Ancestries Reported - Swiss (%)
Ancestries Reported - Ukrainian (%)
Ancestries Reported - United States (%)
Ancestries Reported - Welsh (%)
Ancestries Reported - West Indian (%)
Ancestries Reported - Other (%)
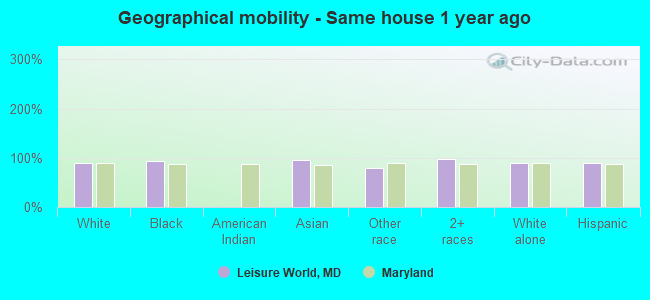
Geographical mobility - Same house 1 year ago (%)
Geographical mobility - Same house 1 year ago (%) - White
Geographical mobility - Same house 1 year ago (%) - Black or African American
Geographical mobility - Same house 1 year ago (%) - Asian
Geographical mobility - Same house 1 year ago (%) - Hispanic or Latino
Geographical mobility - Same house 1 year ago (%) - American Indian and Alaska Native
Geographical mobility - Same house 1 year ago (%) - Multirace
Geographical mobility - Same house 1 year ago (%) - Other Race
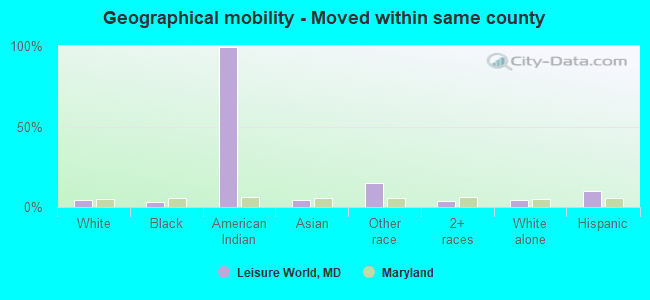
Geographical mobility - Moved within same county (%)
Geographical mobility - Moved within same county (%) - White
Geographical mobility - Moved within same county (%) - Black or African American
Geographical mobility - Moved within same county (%) - Asian
Geographical mobility - Moved within same county (%) - Hispanic or Latino
Geographical mobility - Moved within same county (%) - American Indian and Alaska Native
Geographical mobility - Moved within same county (%) - Multirace
Geographical mobility - Moved within same county (%) - Other Race
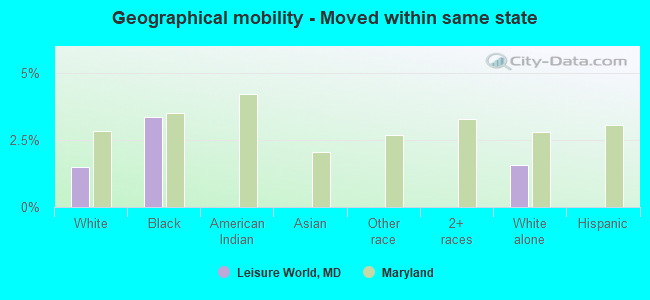
Geographical mobility - Moved from different county within same state (%)
Geographical mobility - Moved from different county within same state (%) - White
Geographical mobility - Moved from different county within same state (%) - Black or African American
Geographical mobility - Moved from different county within same state (%) - Asian
Geographical mobility - Moved from different county within same state (%) - Hispanic or Latino
Geographical mobility - Moved from different county within same state (%) - American Indian and Alaska Native
Geographical mobility - Moved from different county within same state (%) - Multirace
Geographical mobility - Moved from different county within same state (%) - Other Race
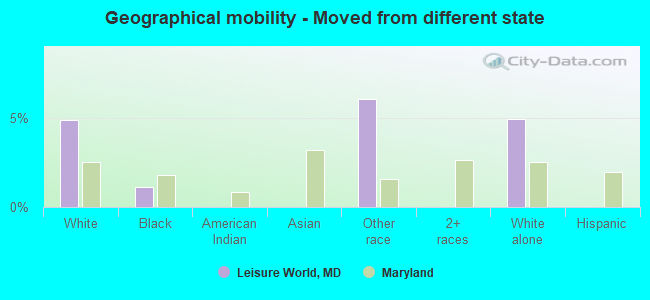
Geographical mobility - Moved from different state (%)
Geographical mobility - Moved from different state (%) - White
Geographical mobility - Moved from different state (%) - Black or African American
Geographical mobility - Moved from different state (%) - Asian
Geographical mobility - Moved from different state (%) - Hispanic or Latino
Geographical mobility - Moved from different state (%) - American Indian and Alaska Native
Geographical mobility - Moved from different state (%) - Multirace
Geographical mobility - Moved from different state (%) - Other Race
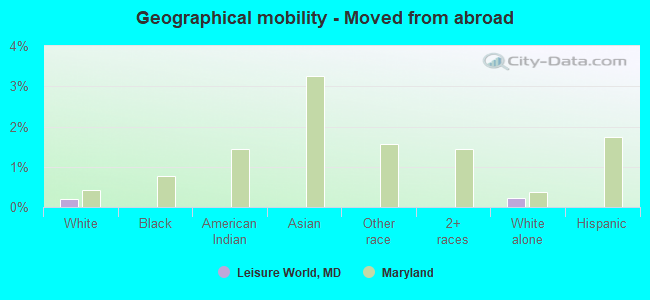
Geographical mobility - Moved from abroad (%)
Geographical mobility - Moved from abroad (%) - White
Geographical mobility - Moved from abroad (%) - Black or African American
Geographical mobility - Moved from abroad (%) - Asian
Geographical mobility - Moved from abroad (%) - Hispanic or Latino
Geographical mobility - Moved from abroad (%) - American Indian and Alaska Native
Geographical mobility - Moved from abroad (%) - Multirace
Geographical mobility - Moved from abroad (%) - Other Race
Place of birth for the foreign-born population - Ireland (%)
Place of birth for the foreign-born population - Denmark (%)
Place of birth for the foreign-born population - Norway (%)
Place of birth for the foreign-born population - Sweden (%)
Place of birth for the foreign-born population - United Kingdom (%)
Place of birth for the foreign-born population - England (%)
Place of birth for the foreign-born population - Scotland (%)
Place of birth for the foreign-born population - Other Northern Europe (%)
Place of birth for the foreign-born population - Austria (%)
Place of birth for the foreign-born population - Belgium (%)
Place of birth for the foreign-born population - France (%)
Place of birth for the foreign-born population - Germany (%)
Place of birth for the foreign-born population - Netherlands (%)
Place of birth for the foreign-born population - Switzerland (%)
Place of birth for the foreign-born population - Other Western Europe (%)
Place of birth for the foreign-born population - Greece (%)
Place of birth for the foreign-born population - Italy (%)
Place of birth for the foreign-born population - Portugal (%)
Place of birth for the foreign-born population - Spain (%)
Place of birth for the foreign-born population - Other Southern Europe (%)
Place of birth for the foreign-born population - Albania (%)
Place of birth for the foreign-born population - Belarus (%)
Place of birth for the foreign-born population - Bosnia and Herzegovina (%)
Place of birth for the foreign-born population - Bulgaria (%)
Place of birth for the foreign-born population - Croatia (%)
Place of birth for the foreign-born population - Czechoslovakia (%)
Place of birth for the foreign-born population - Hungary (%)
Place of birth for the foreign-born population - Latvia (%)
Place of birth for the foreign-born population - Lithuania (%)
Place of birth for the foreign-born population - North Macedonia (Macedonia) (%)
Place of birth for the foreign-born population - Moldova (%)
Place of birth for the foreign-born population - Poland (%)
Place of birth for the foreign-born population - Romania (%)
Place of birth for the foreign-born population - Russia (%)
Place of birth for the foreign-born population - Serbia (%)
Place of birth for the foreign-born population - Ukraine (%)
Place of birth for the foreign-born population - Other Eastern Europe (%)
Place of birth for the foreign-born population - China (%)
Place of birth for the foreign-born population - Hong Kong (%)
Place of birth for the foreign-born population - Taiwan (%)
Place of birth for the foreign-born population - Japan (%)
Place of birth for the foreign-born population - Korea (%)
Place of birth for the foreign-born population - Other Eastern Asia (%)
Place of birth for the foreign-born population - Afghanistan (%)
Place of birth for the foreign-born population - Bangladesh (%)
Place of birth for the foreign-born population - India (%)
Place of birth for the foreign-born population - Iran (%)
Place of birth for the foreign-born population - Kazakhstan (%)
Place of birth for the foreign-born population - Nepal (%)
Place of birth for the foreign-born population - Pakistan (%)
Place of birth for the foreign-born population - Sri Lanka (%)
Place of birth for the foreign-born population - Uzbekistan (%)
Place of birth for the foreign-born population - Other South Central Asia (%)
Place of birth for the foreign-born population - Burma (%)
Place of birth for the foreign-born population - Cambodia (%)
Place of birth for the foreign-born population - Indonesia (%)
Place of birth for the foreign-born population - Laos (%)
Place of birth for the foreign-born population - Malaysia (%)
Place of birth for the foreign-born population - Philippines (%)
Place of birth for the foreign-born population - Singapore (%)
Place of birth for the foreign-born population - Thailand (%)
Place of birth for the foreign-born population - Vietnam (%)
Place of birth for the foreign-born population - Other South Eastern Asia (%)
Place of birth for the foreign-born population - Armenia (%)
Place of birth for the foreign-born population - Iraq (%)
Place of birth for the foreign-born population - Israel (%)
Place of birth for the foreign-born population - Jordan (%)
Place of birth for the foreign-born population - Kuwait (%)
Place of birth for the foreign-born population - Lebanon (%)
Place of birth for the foreign-born population - Saudi Arabia (%)
Place of birth for the foreign-born population - Syria (%)
Place of birth for the foreign-born population - Turkey (%)
Place of birth for the foreign-born population - Yemen (%)
Place of birth for the foreign-born population - Other Western Asia (%)
Place of birth for the foreign-born population - Eritrea (%)
Place of birth for the foreign-born population - Ethiopia (%)
Place of birth for the foreign-born population - Kenya (%)
Place of birth for the foreign-born population - Somalia (%)
Place of birth for the foreign-born population - Uganda (%)
Place of birth for the foreign-born population - Zimbabwe (%)
Place of birth for the foreign-born population - Other Eastern Africa (%)
Place of birth for the foreign-born population - Cameroon (%)
Place of birth for the foreign-born population - Congo (%)
Place of birth for the foreign-born population - Democratic Republic of Congo (Zaire) (%)
Place of birth for the foreign-born population - Other Middle Africa (%)
Place of birth for the foreign-born population - Egypt (%)
Place of birth for the foreign-born population - Morocco (%)
Place of birth for the foreign-born population - Sudan (%)
Place of birth for the foreign-born population - Other Northern Africa (%)
Place of birth for the foreign-born population - South Africa (%)
Place of birth for the foreign-born population - Other Southern Africa (%)
Place of birth for the foreign-born population - Cabo Verde (%)
Place of birth for the foreign-born population - Ghana (%)
Place of birth for the foreign-born population - Liberia (%)
Place of birth for the foreign-born population - Nigeria (%)
Place of birth for the foreign-born population - Senegal (%)
Place of birth for the foreign-born population - Sierra Leone (%)
Place of birth for the foreign-born population - Other Western Africa (%)
Place of birth for the foreign-born population - Australia (%)
Place of birth for the foreign-born population - New Zealand (%)
Place of birth for the foreign-born population - Fiji (%)
Place of birth for the foreign-born population - Micronesia (%)
Place of birth for the foreign-born population - Bahamas (%)
Place of birth for the foreign-born population - Barbados (%)
Place of birth for the foreign-born population - Cuba (%)
Place of birth for the foreign-born population - Dominica (%)
Place of birth for the foreign-born population - Dominican Republic (%)
Place of birth for the foreign-born population - Grenada (%)
Place of birth for the foreign-born population - Haiti (%)
Place of birth for the foreign-born population - Jamaica (%)
Place of birth for the foreign-born population - St. Vincent and the Grenadines (%)
Place of birth for the foreign-born population - Trinidad and Tobago (%)
Place of birth for the foreign-born population - West Indies (%)
Place of birth for the foreign-born population - Other Caribbean (%)
Place of birth for the foreign-born population - Belize (%)
Place of birth for the foreign-born population - Costa Rica (%)
Place of birth for the foreign-born population - El Salvador (%)
Place of birth for the foreign-born population - Guatemala (%)
Place of birth for the foreign-born population - Honduras (%)
Place of birth for the foreign-born population - Mexico (%)
Place of birth for the foreign-born population - Nicaragua (%)
Place of birth for the foreign-born population - Panama (%)
Place of birth for the foreign-born population - Other Central America (%)
Place of birth for the foreign-born population - Argentina (%)
Place of birth for the foreign-born population - Bolivia (%)
Place of birth for the foreign-born population - Brazil (%)
Place of birth for the foreign-born population - Chile (%)
Place of birth for the foreign-born population - Colombia (%)
Place of birth for the foreign-born population - Ecuador (%)
Place of birth for the foreign-born population - Guyana (%)
Place of birth for the foreign-born population - Peru (%)
Place of birth for the foreign-born population - Uruguay (%)
Place of birth for the foreign-born population - Venezuela (%)
Place of birth for the foreign-born population - Other South America (%)
Place of birth for the foreign-born population - Canada (%)
Place of birth for the foreign-born population - Other Northern America (%)
Place of birth for the foreign-born population - Other (%)
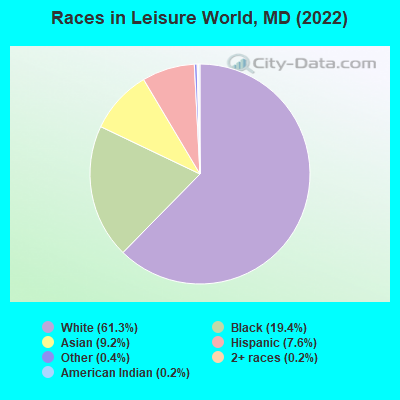
According to 2022 data, the most numerous races in Leisure World, MD are White alone (5,478 residents), Black alone (1,732 residents), and Hispanic (677 residents). 73.3% of Leisure World residents speak English at home.
Race distribution in Leisure World 5,478 61.3% White alone 1,732 19.4% Black alone 818 9.2% Asian alone 677 7.6% Hispanic 35 0.4% Other race alone 20 0.2% Two or more races 19 0.2% American Indian alone
2000 2022
3,286,547 62.1% White alone 1,464,735 27.7% Black alone 227,916 4.3% Hispanic 209,738 4.0% Asian alone 82,946 1.6% Two or more races 13,312 0.3% American Indian alone 9,379 0.2% Other race alone 1,913 0.04% Native Hawaiian and Other
2,906,492 47.1% White alone 1,800,914 29.2% Black alone 705,842 11.4% Hispanic 401,818 6.5% Asian alone 291,317 4.7% Two or more races 46,930 0.8% Other race alone 8,930 0.1% American Indian alone 2,417 0.04% Native Hawaiian and Other
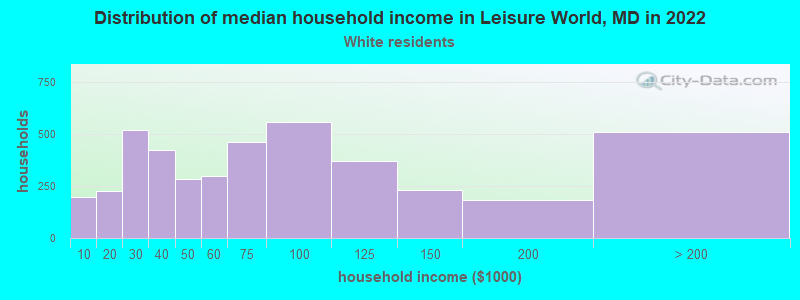
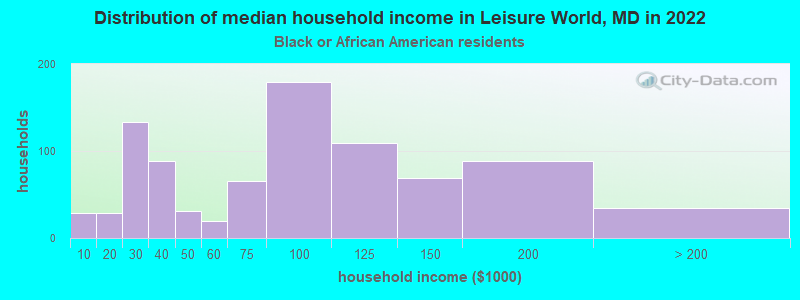
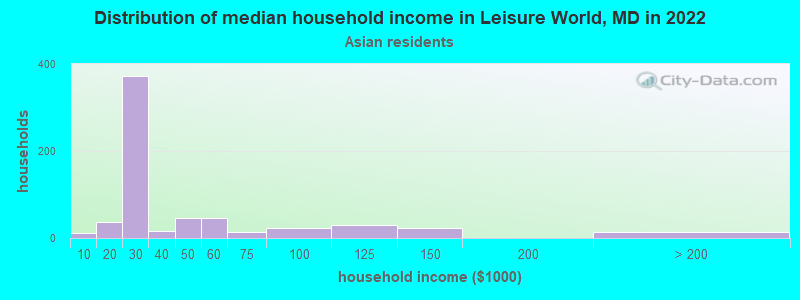
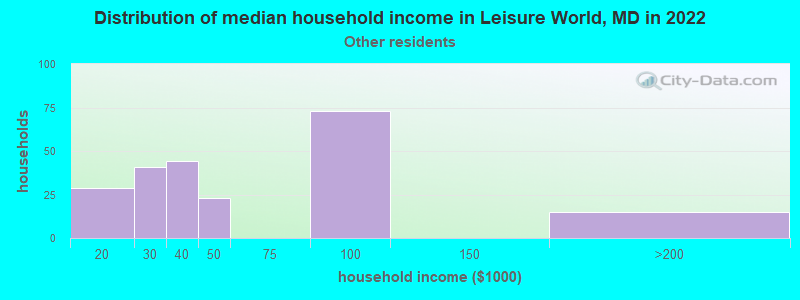
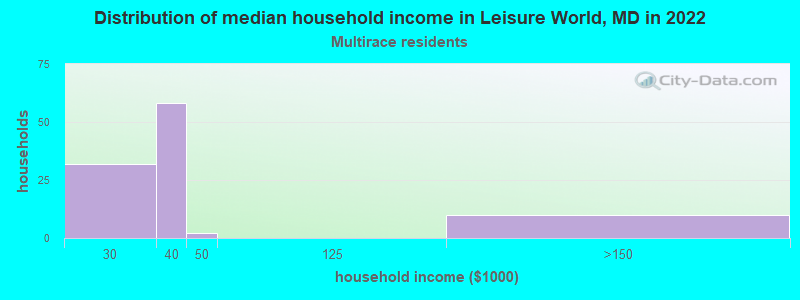
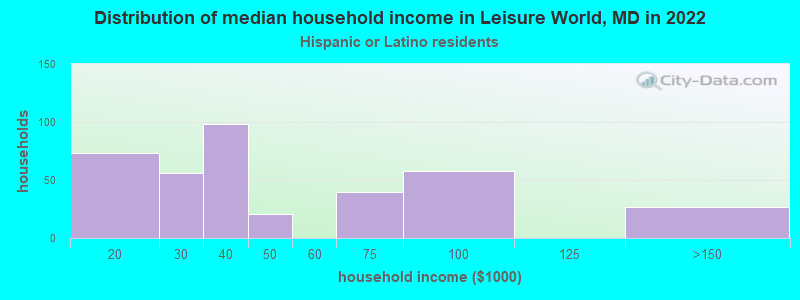
Income and house value in Leisure World Median household income in 2022 $61,354 White non-Hispanic householders$77,662 Black householders$30,229 Some other race householders$31,881 Two or more races householders$29,968 Hispanic or Latino race householders
Median age by race in Leisure World
81.1 Median age for White residents80.6 81.0 61.1 Median age for Black or African American residents42.2 68.5 -610,526,315.2 Median age for American Indian / Alaska Native residents-555,555,555.0 -671,704,449.4 83.2 Median age for Asian residents82.9 82.8 -763,333,332.6 Median age for Native Hawaiian / Pacific Islander residents-720,061,021.4 -760,942,760.2 63.4 Median age for Other race residents57.4 69.9 79.8 Median age for Two or more races residents75.9 92.4 79.3 Median age for White alone residents79.8 79.0 65.1 Median age for Hispanic or Latino residents39.2 73.1
Owner/renter occupied households by race in Leisure World
House owners and renters - White residents 3,502 83.8% Owner occupied675 16.2% Renter occupiedHouse owners and renters - Black or African American residents 722 78.5% Owner occupied197 21.5% Renter occupiedHouse owners and renters - American Indian / Alaska Native residents 22 100.0% Renter occupiedHouse owners and renters - Asian residents 309 65.5% Owner occupied162 34.5% Renter occupiedHouse owners and renters - Other race residents 214 80.2% Owner occupied53 19.8% Renter occupiedHouse owners and renters - Two or more races residents 80 87.7% Owner occupied11 12.3% Renter occupiedHouse owners and renters - White alone residents 3,599 84.0% Owner occupied684 16.0% Renter occupiedHouse owners and renters - Hispanic or Latino residents 267 75.7% Owner occupied86 24.3% Renter occupied
Language usage in Leisure World
English speakers - Total 73.3% of residents of Leisure World speak English at home.
7.9% of residents speak Spanish at home 364 51.7% Speak English very well340 48.3% Speak English less than very well17.9% of residents speak other language at home 891 55.6% Speak English very well711 44.4% Speak English less than very well
English speakers - Born in the United States 96.3% of residents of Leisure World speak English at home.
1.5% of residents speak Spanish at home 69 89.6% Speak English very well8 10.4% Speak English less than very well2.4% of residents speak other language at home 126 100.0% Speak English very well
English speakers - Native, born elsewhere 78.1% of residents of Leisure World speak English at home.
15.6% of residents speak Spanish at home 10 100.0% Speak English very well
English speakers - Foreign-born 17.0% of residents of Leisure World speak English at home.
21.5% of residents speak Spanish at home 181 35.0% Speak English very well336 65.0% Speak English less than very well60.8% of residents speak other language at home 767 52.4% Speak English very well697 47.6% Speak English less than very well
White (Caucasian) - Speak only English Native:
99.6% (4,840)Foreign-born:
20.1% (102)
White (Caucasian) - Speak another language Native:
2.3% (113)Foreign-born:
79.6% (404)
Black or African American - Speak only English Native:
95.3% (1,139)Foreign-born:
46.3% (233)
Black or African American - Speak another language Native:
3.8% (45)Foreign-born:
47.9% (241)
Asian - Speak only English Native:
91.2% (9)Foreign-born:
3.0% (24)
Other race - Speak another language Native:
93.7% (108)Foreign-born:
100.0% (394)
Two or more races - Speak only English Native:
46.6% (20)Foreign-born:
22.2% (21)
Two or more races - Speak another language Native:
57.6% (25)Foreign-born:
78.6% (74)
White alone - Speak only English Native:
97.5% (4,839)Foreign-born:
20.1% (103)
White alone - Speak another language Native:
2.7% (136)Foreign-born:
80.2% (410)
Hispanic or Latino - Speak only English Native:
16.2% (26)Foreign-born:
2.5% (13)
Hispanic or Latino - Speak another language Native:
82.3% (130)Foreign-born:
97.6% (516)
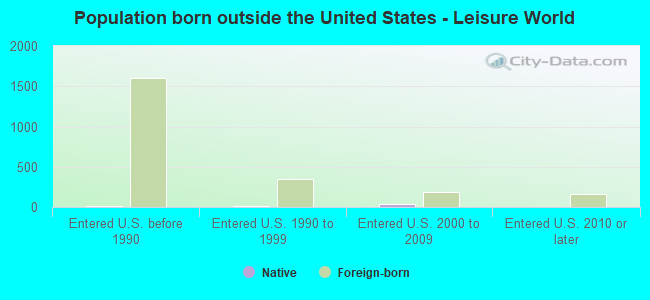
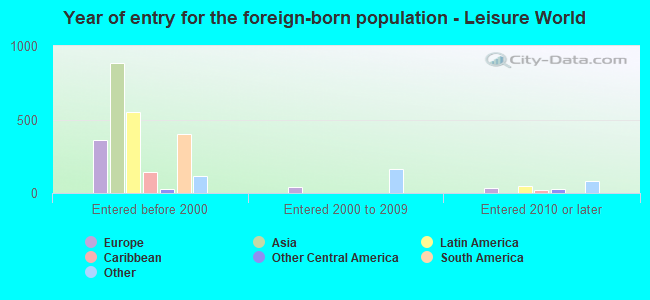
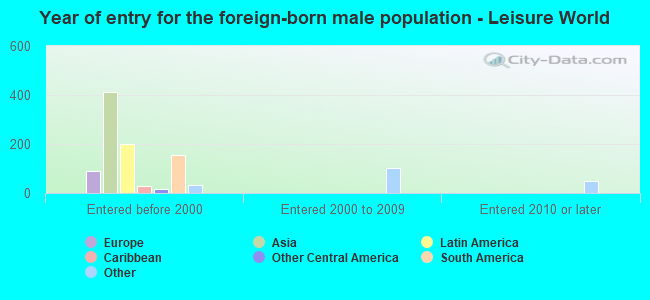
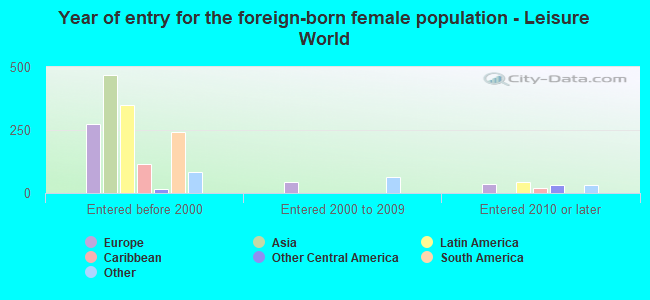
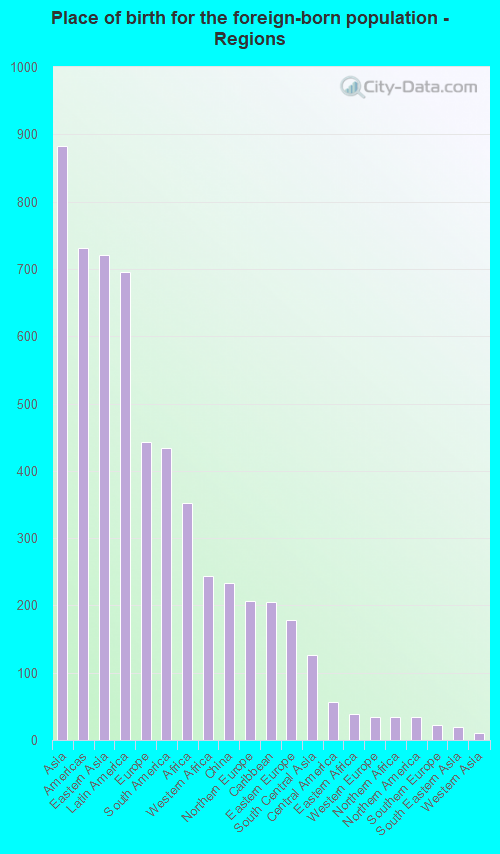
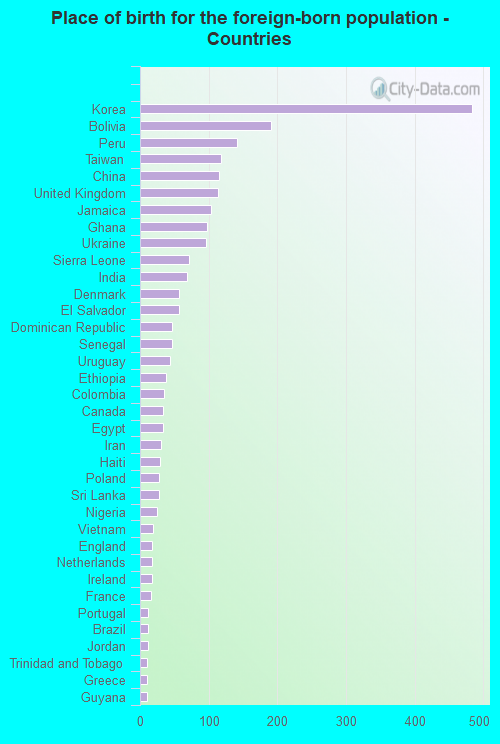
Foreign-born residents in Leisure World
Marital status for residents in Leisure World Marital status - White (Caucasian) population 15 years and over
Males 14.1% Never married55.5% Now married1.1% Separated16.7% Widowed12.7% DivorcedFemales 11.9% Never married30.9% Now married0.7% Separated34.7% Widowed21.8% DivorcedWomen who did not give birth in the past 12 months Now married:
0.0% (0)Unmarried:
100.0% (39)
Marital status - Black or African American population 15 years and over
Males 30.1% Never married49.3% Now married0.0% Separated3.6% Widowed17.0% DivorcedFemales 16.1% Never married31.3% Now married8.0% Separated15.6% Widowed29.1% DivorcedWomen who did not give birth in the past 12 months Now married:
51.6% (147)Unmarried:
48.4% (138)
Marital status - Asian population 15 years and over
Males 0.0% Never married94.4% Now married0.0% Separated2.8% Widowed2.8% DivorcedFemales 1.5% Never married83.7% Now married0.0% Separated14.6% Widowed0.2% DivorcedMarital status - Other race population 15 years and over
Males 48.4% Never married6.4% Now married0.0% Separated0.0% Widowed45.2% DivorcedFemales 0.0% Never married7.9% Now married0.0% Separated35.1% Widowed56.9% DivorcedWomen who did not give birth in the past 12 months Now married:
0.0% (0)Unmarried:
100.0% (67)
Marital status - Two or more races population 15 years and over
Males 47.6% Never married31.0% Now married21.4% Separated0.0% Widowed0.0% DivorcedFemales 3.2% Never married17.7% Now married11.3% Separated22.6% Widowed45.2% DivorcedMarital status - White alone, not Hispanic / Latino population 15 years and over
Males 13.1% Never married55.3% Now married1.1% Separated17.6% Widowed12.9% DivorcedFemales 11.9% Never married30.5% Now married0.7% Separated34.6% Widowed22.3% DivorcedWomen who did not give birth in the past 12 months Now married:
0.0% (0)Unmarried:
100.0% (43)
Marital status - Hispanic or Latino population 15 years and over
Males 45.1% Never married21.7% Now married2.5% Separated0.0% Widowed30.6% DivorcedFemales 3.9% Never married16.7% Now married0.0% Separated37.0% Widowed42.4% DivorcedWomen who did not give birth in the past 12 months Now married:
0.0% (0)Unmarried:
100.0% (55)
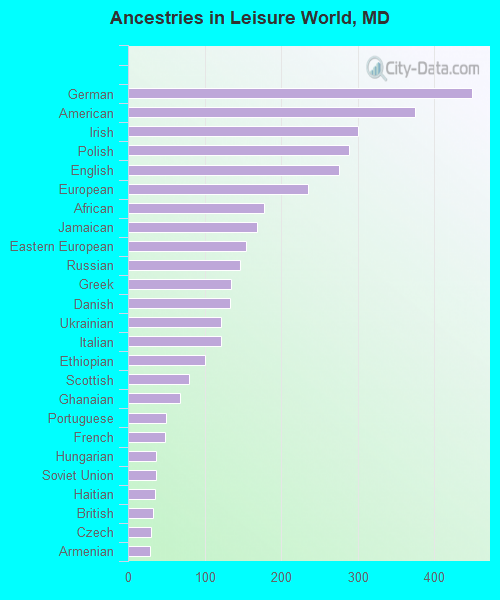
Ancestries in Leisure World
449 7.2% German375 6.0% American300 4.8% Irish288 4.6% Polish276 4.4% English235 3.8% European178 2.8% African168 2.7% Jamaican154 2.5% Eastern European146 2.3% Russian135 2.2% Greek133 2.1% Danish122 1.9% Ukrainian122 1.9% Italian100 1.6% Ethiopian80 1.3% Scottish68 1.1% Ghanaian49 0.8% Portuguese48 0.8% French37 0.6% Hungarian36 0.6% Soviet Union35 0.6% Haitian32 0.5% British30 0.5% Czech29 0.5% Armenian25 0.4% Austrian11 0.2% Dutch11 0.2% Welsh10 0.2% Norwegian10 0.2% Scandinavian10 0.2% Swedish10 0.2% Swiss9 0.1% Palestinian5 0.08% Scotch-Irish5 0.08% Guyanese2 0.03% Arab
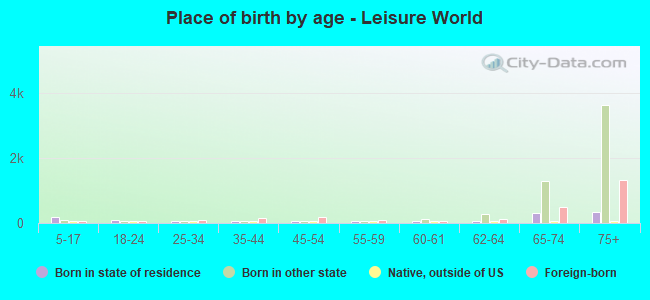
Children Nativity (place of birth) in Leisure World
Children 6 to 17 years - Living with two parents Both parents native 81 100.0% NativeBoth parents foreign-born 93 100.0% NativeChildren 6 to 17 years - Living with one parent Native parent 1 62.2% NativeForeign-born parent 106 49.5% Native108 50.5% Foreign-born