Races in Lemay, Missouri (MO) Detailed Stats
Data:
Races - White alone (%)
Races - White alone (% change since 2000)
Races - Black alone (%)
Races - Black alone (% change since 2000)
Races - American Indian alone (%)
Races - American Indian alone (% change since 2000)
Races - Asian alone (%)
Races - Asian alone (% change since 2000)
Races - Hispanic (%)
Races - Hispanic (% change since 2000)
Races - Native Hawaiian and Other Pacific Islander alone (%)
Races - Native Hawaiian and Other Pacific Islander alone (% change since 2000)
Races - Two or more races(%)
Races - Two or more races(% change since 2000)
Races - Other race alone (%)
Races - Other race alone (% change since 2000)
Racial diversity
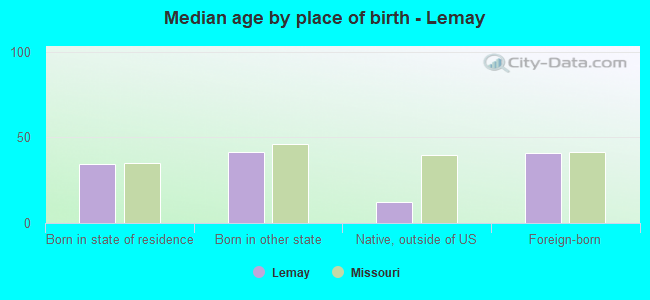
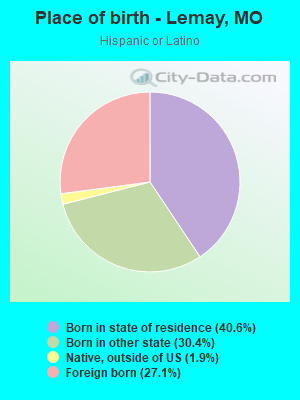
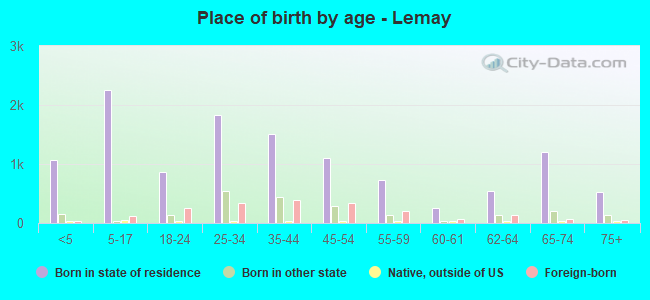
Place of birth - Born in state of residence (%)
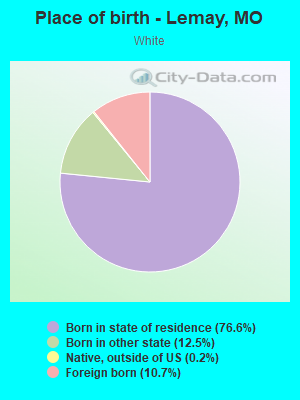
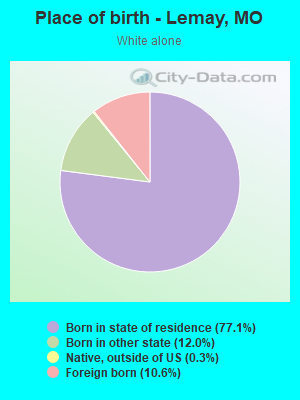
Place of birth - Born in state of residence (%) - White
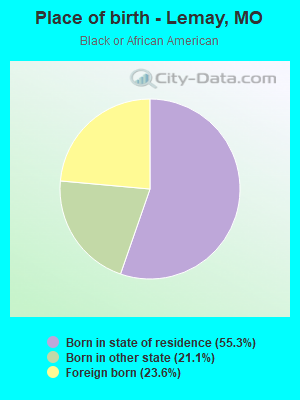
Place of birth - Born in state of residence (%) - Black or African American
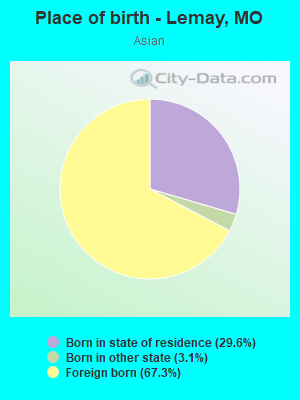
Place of birth - Born in state of residence (%) - Asian
Place of birth - Born in state of residence (%) - Hispanic or Latino
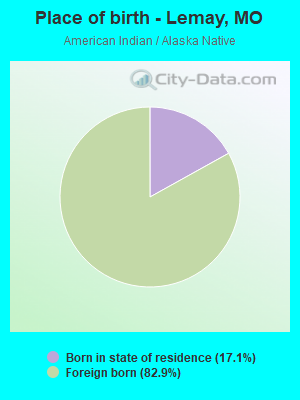
Place of birth - Born in state of residence (%) - American Indian and Alaska Native
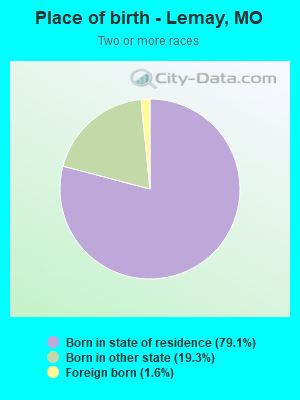
Place of birth - Born in state of residence (%) - Multirace
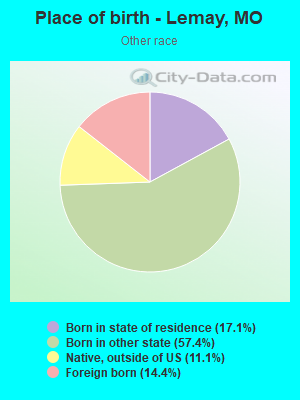
Place of birth - Born in state of residence (%) - Other Race
Place of birth - Born in other state (%)
Place of birth - Born in other state (%) - White
Place of birth - Born in other state (%) - Black or African American
Place of birth - Born in other state (%) - Asian
Place of birth - Born in other state (%) - Hispanic or Latino
Place of birth - Born in other state (%) - American Indian and Alaska Native
Place of birth - Born in other state (%) - Multirace
Place of birth - Born in other state (%) - Other Race
Place of birth - Native, outside of US (%)
Place of birth - Native, outside of US (%) - White
Place of birth - Native, outside of US (%) - Black or African American
Place of birth - Native, outside of US (%) - Asian
Place of birth - Native, outside of US (%) - Hispanic or Latino
Place of birth - Native, outside of US (%) - American Indian and Alaska Native
Place of birth - Native, outside of US (%) - Multirace
Place of birth - Native, outside of US (%) - Other Race
Place of birth - Foreign born (%)
Place of birth - Foreign born (%) - White
Place of birth - Foreign born (%) - Black or African American
Place of birth - Foreign born (%) - Asian
Place of birth - Foreign born (%) - Hispanic or Latino
Place of birth - Foreign born (%) - American Indian and Alaska Native
Place of birth - Foreign born (%) - Multirace
Place of birth - Foreign born (%) - Other Race
Residents speaking English at home (%)
Residents speaking English at home - Born in the United States (%)
Residents speaking English at home - Native, born elsewhere (%)
Residents speaking English at home - Foreign born (%)
Residents speaking Spanish at home (%)
Residents speaking Spanish at home - Born in the United States (%)
Residents speaking Spanish at home - Native, born elsewhere (%)
Residents speaking Spanish at home - Foreign born (%)
Residents speaking other language at home (%)
Residents speaking other language at home - Born in the United States (%)
Residents speaking other language at home - Native, born elsewhere (%)
Residents speaking other language at home - Foreign born (%)
Marital status - Never married (%)
Marital status - Now married (%)
Marital status - Separated (%)
Marital status - Widowed (%)
Marital status - Divorced (%)
Ancestries Reported - Arab (%)
Ancestries Reported - Czech (%)
Ancestries Reported - Danish (%)
Ancestries Reported - Dutch (%)
Ancestries Reported - English (%)
Ancestries Reported - French (%)
Ancestries Reported - French Canadian (%)
Ancestries Reported - German (%)
Ancestries Reported - Greek (%)
Ancestries Reported - Hungarian (%)
Ancestries Reported - Irish (%)
Ancestries Reported - Italian (%)
Ancestries Reported - Lithuanian (%)
Ancestries Reported - Norwegian (%)
Ancestries Reported - Polish (%)
Ancestries Reported - Portuguese (%)
Ancestries Reported - Russian (%)
Ancestries Reported - Scotch-Irish (%)
Ancestries Reported - Scottish (%)
Ancestries Reported - Slovak (%)
Ancestries Reported - Subsaharan African (%)
Ancestries Reported - Swedish (%)
Ancestries Reported - Swiss (%)
Ancestries Reported - Ukrainian (%)
Ancestries Reported - United States (%)
Ancestries Reported - Welsh (%)
Ancestries Reported - West Indian (%)
Ancestries Reported - Other (%)
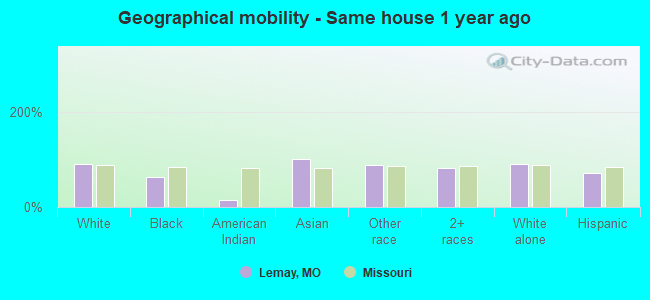
Geographical mobility - Same house 1 year ago (%)
Geographical mobility - Same house 1 year ago (%) - White
Geographical mobility - Same house 1 year ago (%) - Black or African American
Geographical mobility - Same house 1 year ago (%) - Asian
Geographical mobility - Same house 1 year ago (%) - Hispanic or Latino
Geographical mobility - Same house 1 year ago (%) - American Indian and Alaska Native
Geographical mobility - Same house 1 year ago (%) - Multirace
Geographical mobility - Same house 1 year ago (%) - Other Race
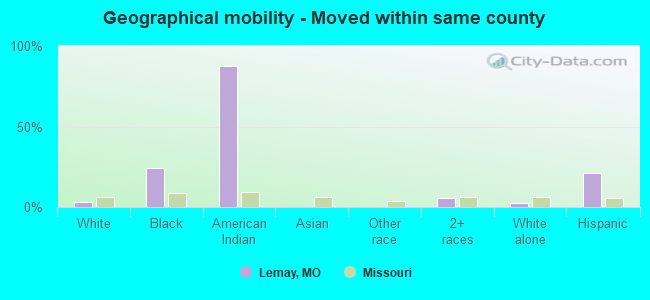
Geographical mobility - Moved within same county (%)
Geographical mobility - Moved within same county (%) - White
Geographical mobility - Moved within same county (%) - Black or African American
Geographical mobility - Moved within same county (%) - Asian
Geographical mobility - Moved within same county (%) - Hispanic or Latino
Geographical mobility - Moved within same county (%) - American Indian and Alaska Native
Geographical mobility - Moved within same county (%) - Multirace
Geographical mobility - Moved within same county (%) - Other Race
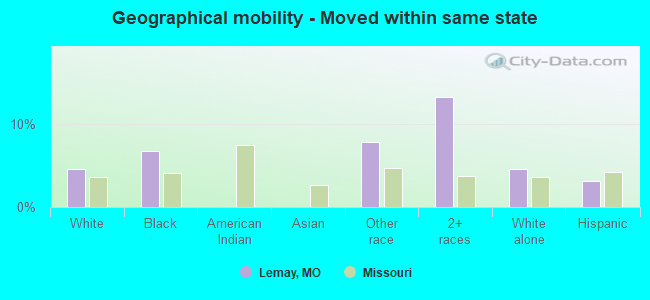
Geographical mobility - Moved from different county within same state (%)
Geographical mobility - Moved from different county within same state (%) - White
Geographical mobility - Moved from different county within same state (%) - Black or African American
Geographical mobility - Moved from different county within same state (%) - Asian
Geographical mobility - Moved from different county within same state (%) - Hispanic or Latino
Geographical mobility - Moved from different county within same state (%) - American Indian and Alaska Native
Geographical mobility - Moved from different county within same state (%) - Multirace
Geographical mobility - Moved from different county within same state (%) - Other Race
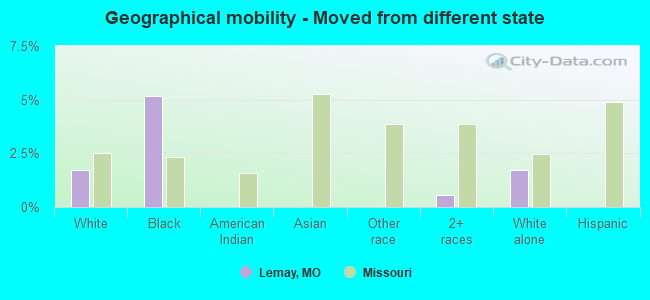
Geographical mobility - Moved from different state (%)
Geographical mobility - Moved from different state (%) - White
Geographical mobility - Moved from different state (%) - Black or African American
Geographical mobility - Moved from different state (%) - Asian
Geographical mobility - Moved from different state (%) - Hispanic or Latino
Geographical mobility - Moved from different state (%) - American Indian and Alaska Native
Geographical mobility - Moved from different state (%) - Multirace
Geographical mobility - Moved from different state (%) - Other Race
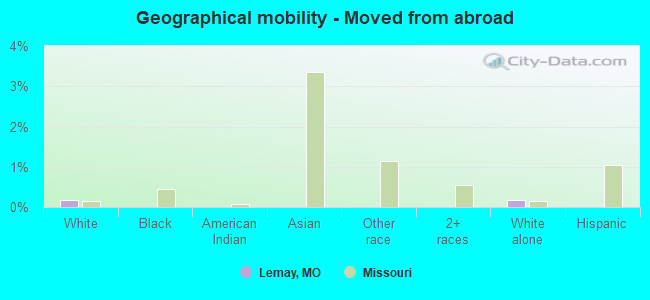
Geographical mobility - Moved from abroad (%)
Geographical mobility - Moved from abroad (%) - White
Geographical mobility - Moved from abroad (%) - Black or African American
Geographical mobility - Moved from abroad (%) - Asian
Geographical mobility - Moved from abroad (%) - Hispanic or Latino
Geographical mobility - Moved from abroad (%) - American Indian and Alaska Native
Geographical mobility - Moved from abroad (%) - Multirace
Geographical mobility - Moved from abroad (%) - Other Race
Place of birth for the foreign-born population - Ireland (%)
Place of birth for the foreign-born population - Denmark (%)
Place of birth for the foreign-born population - Norway (%)
Place of birth for the foreign-born population - Sweden (%)
Place of birth for the foreign-born population - United Kingdom (%)
Place of birth for the foreign-born population - England (%)
Place of birth for the foreign-born population - Scotland (%)
Place of birth for the foreign-born population - Other Northern Europe (%)
Place of birth for the foreign-born population - Austria (%)
Place of birth for the foreign-born population - Belgium (%)
Place of birth for the foreign-born population - France (%)
Place of birth for the foreign-born population - Germany (%)
Place of birth for the foreign-born population - Netherlands (%)
Place of birth for the foreign-born population - Switzerland (%)
Place of birth for the foreign-born population - Other Western Europe (%)
Place of birth for the foreign-born population - Greece (%)
Place of birth for the foreign-born population - Italy (%)
Place of birth for the foreign-born population - Portugal (%)
Place of birth for the foreign-born population - Spain (%)
Place of birth for the foreign-born population - Other Southern Europe (%)
Place of birth for the foreign-born population - Albania (%)
Place of birth for the foreign-born population - Belarus (%)
Place of birth for the foreign-born population - Bosnia and Herzegovina (%)
Place of birth for the foreign-born population - Bulgaria (%)
Place of birth for the foreign-born population - Croatia (%)
Place of birth for the foreign-born population - Czechoslovakia (%)
Place of birth for the foreign-born population - Hungary (%)
Place of birth for the foreign-born population - Latvia (%)
Place of birth for the foreign-born population - Lithuania (%)
Place of birth for the foreign-born population - North Macedonia (Macedonia) (%)
Place of birth for the foreign-born population - Moldova (%)
Place of birth for the foreign-born population - Poland (%)
Place of birth for the foreign-born population - Romania (%)
Place of birth for the foreign-born population - Russia (%)
Place of birth for the foreign-born population - Serbia (%)
Place of birth for the foreign-born population - Ukraine (%)
Place of birth for the foreign-born population - Other Eastern Europe (%)
Place of birth for the foreign-born population - China (%)
Place of birth for the foreign-born population - Hong Kong (%)
Place of birth for the foreign-born population - Taiwan (%)
Place of birth for the foreign-born population - Japan (%)
Place of birth for the foreign-born population - Korea (%)
Place of birth for the foreign-born population - Other Eastern Asia (%)
Place of birth for the foreign-born population - Afghanistan (%)
Place of birth for the foreign-born population - Bangladesh (%)
Place of birth for the foreign-born population - India (%)
Place of birth for the foreign-born population - Iran (%)
Place of birth for the foreign-born population - Kazakhstan (%)
Place of birth for the foreign-born population - Nepal (%)
Place of birth for the foreign-born population - Pakistan (%)
Place of birth for the foreign-born population - Sri Lanka (%)
Place of birth for the foreign-born population - Uzbekistan (%)
Place of birth for the foreign-born population - Other South Central Asia (%)
Place of birth for the foreign-born population - Burma (%)
Place of birth for the foreign-born population - Cambodia (%)
Place of birth for the foreign-born population - Indonesia (%)
Place of birth for the foreign-born population - Laos (%)
Place of birth for the foreign-born population - Malaysia (%)
Place of birth for the foreign-born population - Philippines (%)
Place of birth for the foreign-born population - Singapore (%)
Place of birth for the foreign-born population - Thailand (%)
Place of birth for the foreign-born population - Vietnam (%)
Place of birth for the foreign-born population - Other South Eastern Asia (%)
Place of birth for the foreign-born population - Armenia (%)
Place of birth for the foreign-born population - Iraq (%)
Place of birth for the foreign-born population - Israel (%)
Place of birth for the foreign-born population - Jordan (%)
Place of birth for the foreign-born population - Kuwait (%)
Place of birth for the foreign-born population - Lebanon (%)
Place of birth for the foreign-born population - Saudi Arabia (%)
Place of birth for the foreign-born population - Syria (%)
Place of birth for the foreign-born population - Turkey (%)
Place of birth for the foreign-born population - Yemen (%)
Place of birth for the foreign-born population - Other Western Asia (%)
Place of birth for the foreign-born population - Eritrea (%)
Place of birth for the foreign-born population - Ethiopia (%)
Place of birth for the foreign-born population - Kenya (%)
Place of birth for the foreign-born population - Somalia (%)
Place of birth for the foreign-born population - Uganda (%)
Place of birth for the foreign-born population - Zimbabwe (%)
Place of birth for the foreign-born population - Other Eastern Africa (%)
Place of birth for the foreign-born population - Cameroon (%)
Place of birth for the foreign-born population - Congo (%)
Place of birth for the foreign-born population - Democratic Republic of Congo (Zaire) (%)
Place of birth for the foreign-born population - Other Middle Africa (%)
Place of birth for the foreign-born population - Egypt (%)
Place of birth for the foreign-born population - Morocco (%)
Place of birth for the foreign-born population - Sudan (%)
Place of birth for the foreign-born population - Other Northern Africa (%)
Place of birth for the foreign-born population - South Africa (%)
Place of birth for the foreign-born population - Other Southern Africa (%)
Place of birth for the foreign-born population - Cabo Verde (%)
Place of birth for the foreign-born population - Ghana (%)
Place of birth for the foreign-born population - Liberia (%)
Place of birth for the foreign-born population - Nigeria (%)
Place of birth for the foreign-born population - Senegal (%)
Place of birth for the foreign-born population - Sierra Leone (%)
Place of birth for the foreign-born population - Other Western Africa (%)
Place of birth for the foreign-born population - Australia (%)
Place of birth for the foreign-born population - New Zealand (%)
Place of birth for the foreign-born population - Fiji (%)
Place of birth for the foreign-born population - Micronesia (%)
Place of birth for the foreign-born population - Bahamas (%)
Place of birth for the foreign-born population - Barbados (%)
Place of birth for the foreign-born population - Cuba (%)
Place of birth for the foreign-born population - Dominica (%)
Place of birth for the foreign-born population - Dominican Republic (%)
Place of birth for the foreign-born population - Grenada (%)
Place of birth for the foreign-born population - Haiti (%)
Place of birth for the foreign-born population - Jamaica (%)
Place of birth for the foreign-born population - St. Vincent and the Grenadines (%)
Place of birth for the foreign-born population - Trinidad and Tobago (%)
Place of birth for the foreign-born population - West Indies (%)
Place of birth for the foreign-born population - Other Caribbean (%)
Place of birth for the foreign-born population - Belize (%)
Place of birth for the foreign-born population - Costa Rica (%)
Place of birth for the foreign-born population - El Salvador (%)
Place of birth for the foreign-born population - Guatemala (%)
Place of birth for the foreign-born population - Honduras (%)
Place of birth for the foreign-born population - Mexico (%)
Place of birth for the foreign-born population - Nicaragua (%)
Place of birth for the foreign-born population - Panama (%)
Place of birth for the foreign-born population - Other Central America (%)
Place of birth for the foreign-born population - Argentina (%)
Place of birth for the foreign-born population - Bolivia (%)
Place of birth for the foreign-born population - Brazil (%)
Place of birth for the foreign-born population - Chile (%)
Place of birth for the foreign-born population - Colombia (%)
Place of birth for the foreign-born population - Ecuador (%)
Place of birth for the foreign-born population - Guyana (%)
Place of birth for the foreign-born population - Peru (%)
Place of birth for the foreign-born population - Uruguay (%)
Place of birth for the foreign-born population - Venezuela (%)
Place of birth for the foreign-born population - Other South America (%)
Place of birth for the foreign-born population - Canada (%)
Place of birth for the foreign-born population - Other Northern America (%)
Place of birth for the foreign-born population - Other (%)
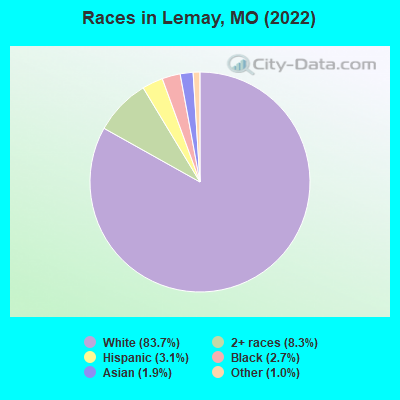
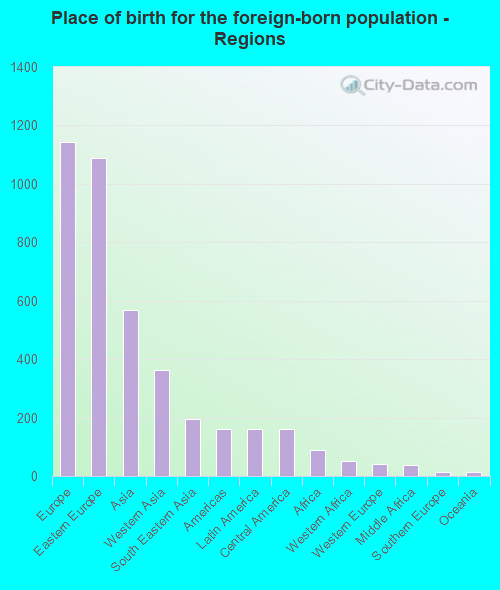
According to 2022 data, the most numerous races in Lemay, MO are White alone (13,441 residents), Black alone (433 residents), and Two or more races (1,334 residents). 83.7% of Lemay residents speak English at home. 12.3% of Lemay, MO residents are foreign-born (7.2% born in Europe, 3.6% born in Asia), which is 67.5% greater than the foreign-born rate of 4.0% across the entire state of Missouri.
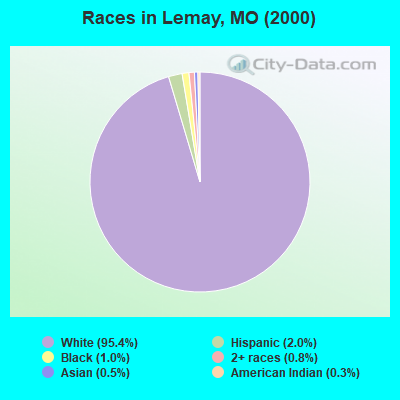
Race distribution in Lemay
2000 2022
4,686,474 83.8% White alone 625,667 11.2% Black alone 118,592 2.1% Hispanic 71,905 1.3% Two or more races 61,041 1.1% Asian alone 23,302 0.4% American Indian alone 5,291 0.09% Other race alone 2,939 0.05% Native Hawaiian and Other
4,733,411 76.6% White alone 656,739 10.6% Black alone 316,300 5.1% Two or more races 291,763 4.7% Hispanic 132,436 2.1% Asian alone 27,467 0.4% Other race alone 12,313 0.2% American Indian alone 7,528 0.1% Native Hawaiian and Other
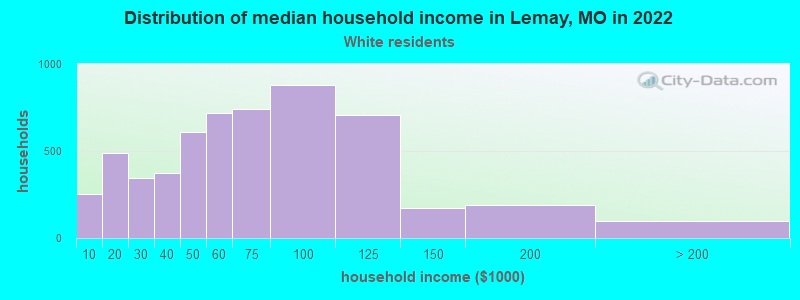
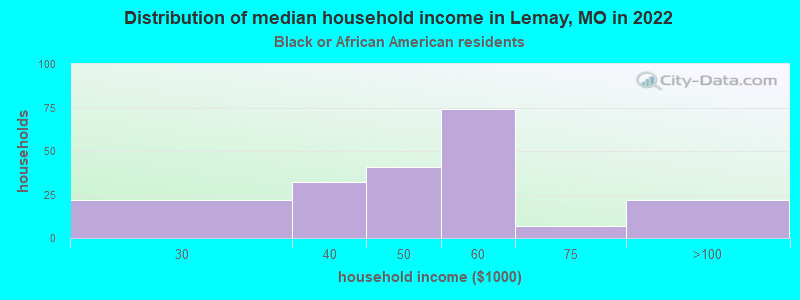
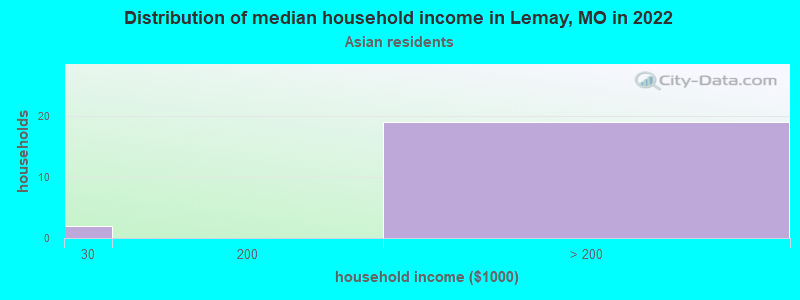
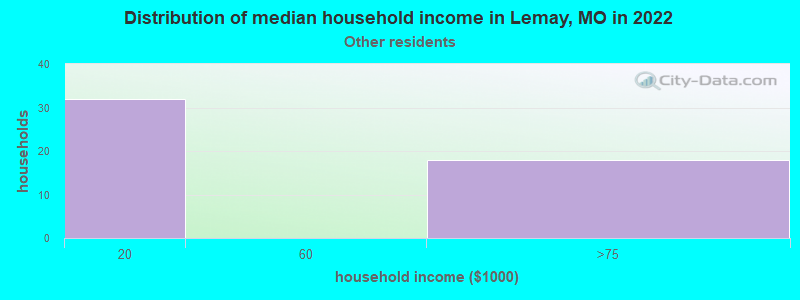
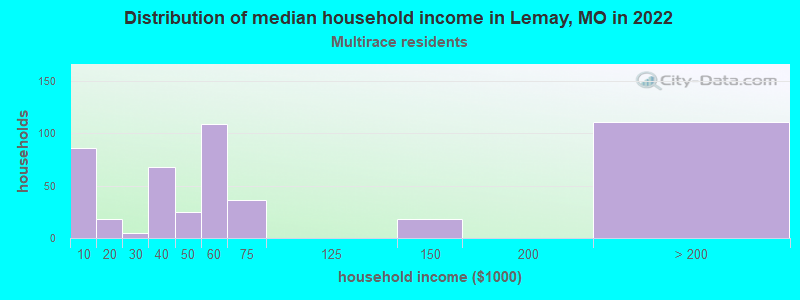
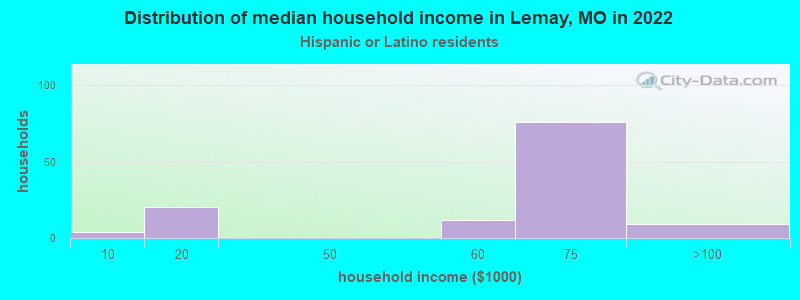
Income and house value in Lemay Median household income in 2022 $58,537 White non-Hispanic householders$50,321 Black householders$50,337 Two or more races householders$62,362 Hispanic or Latino race householdersMedian 2022 house value $148,121 White Non-Hispanic householders$124,842 American Indian or Alaska Native householders $154,507 Asian householders$135,142 Some other race householders$153,271 Two or more races householders$141,323 Hispanic or Latino householders
Median age by race in Lemay
36.6 Median age for White residents37.5 36.0 44.6 Median age for Black or African American residents38.2 66.9 -520,187,792.9 Median age for American Indian / Alaska Native residents-644,003,776.5 -505,494,505.0 19.8 Median age for Asian residents19.3 18.2 -710,303,029.6 Median age for Native Hawaiian / Pacific Islander residents-1,449,781,657.9 -752,136,751.4 2.6 Median age for Other race residents31.5 2.5 35.7 Median age for Two or more races residents39.9 38.3 36.5 Median age for White alone residents37.2 36.1 34.7 Median age for Hispanic or Latino residents36.9 25.4
Owner/renter occupied households by race in Lemay
House owners and renters - White residents 4,454 79.9% Owner occupied1,123 20.1% Renter occupiedHouse owners and renters - Black or African American residents 47 23.6% Owner occupied151 76.4% Renter occupiedHouse owners and renters - American Indian / Alaska Native residents 3 100.0% Renter occupiedHouse owners and renters - Asian residents 18 85.3% Owner occupied3 14.7% Renter occupiedHouse owners and renters - Other race residents 12 34.0% Owner occupied24 66.0% Renter occupiedHouse owners and renters - Two or more races residents 345 65.1% Owner occupied185 34.9% Renter occupiedHouse owners and renters - White alone residents 4,443 80.0% Owner occupied1,111 20.0% Renter occupiedHouse owners and renters - Hispanic or Latino residents 47 53.2% Owner occupied42 46.8% Renter occupied
Language usage in Lemay
English speakers - Total 83.7% of residents of Lemay speak English at home.
1.8% of residents speak Spanish at home 182 66.7% Speak English very well91 33.3% Speak English less than very well14.6% of residents speak other language at home 1,131 52.1% Speak English very well1,038 47.9% Speak English less than very well
English speakers - Born in the United States 96.1% of residents of Lemay speak English at home.
1.7% of residents speak Spanish at home 34 100.0% Speak English very well2.1% of residents speak other language at home 43 100.0% Speak English very well
All residents speak only English at home
English speakers - Foreign-born 5.0% of residents of Lemay speak English at home.
6.9% of residents speak Spanish at home 38 27.5% Speak English very well100 72.5% Speak English less than very well86.3% of residents speak other language at home 832 48.5% Speak English very well884 51.5% Speak English less than very well
White (Caucasian) - Speak only English Native:
96.7% (10,678)Foreign-born:
3.8% (55)
White (Caucasian) - Speak another language Native:
3.3% (364)Foreign-born:
100.0% (1,444)
Black or African American - Speak another language Native:
30.1% (111)Foreign-born:
91.6% (99)
Asian - Speak only English Native:
50.1% (15)Foreign-born:
6.4% (13)
Asian - Speak another language Native:
48.3% (14)Foreign-born:
90.8% (186)
Other race - Speak only English Native:
98.3% (66)Foreign-born:
88.7% (28)
Other race - Speak another language Native:
17.2% (12)Foreign-born:
52.6% (16)
Two or more races - Speak another language Native:
3.2% (47)Foreign-born:
100.0% (24)
White alone - Speak only English Native:
96.7% (10,597)Foreign-born:
4.0% (56)
White alone - Speak another language Native:
3.4% (369)Foreign-born:
100.0% (1,425)
Hispanic or Latino - Speak another language Native:
15.0% (45)Foreign-born:
100.0% (134)
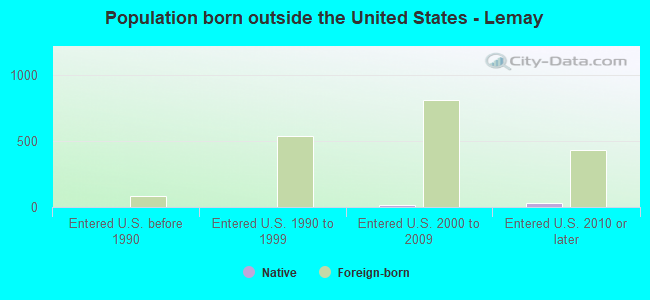
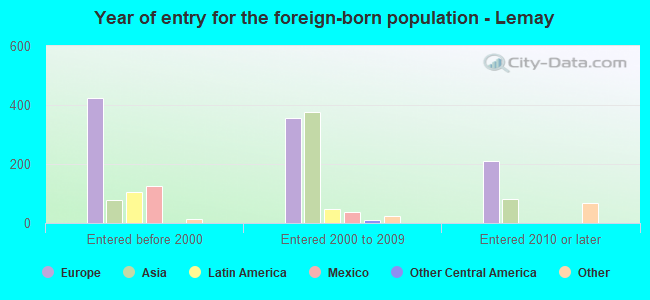
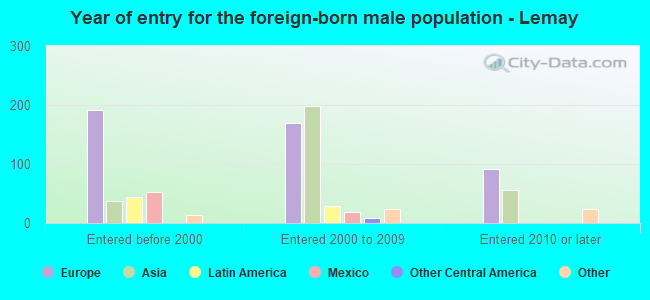
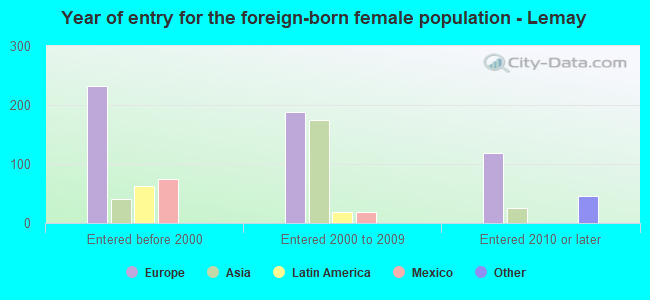
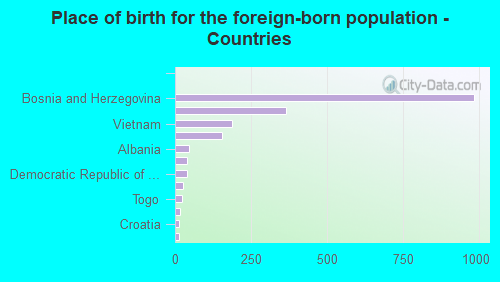
Foreign-born residents in Lemay 1,977 residents are foreign born (7.2% Europe , 3.6% Asia ).
This city:
12.3%Missouri:
4.2%
Marital status for residents in Lemay Marital status - White (Caucasian) population 15 years and over
Males 35.9% Never married42.4% Now married1.6% Separated3.4% Widowed16.7% DivorcedFemales 33.7% Never married40.7% Now married1.1% Separated12.5% Widowed12.0% DivorcedWomen who gave birth in the past 12 months Now married:
85.0% (235)Unmarried:
15.0% (41)
Women who did not give birth in the past 12 months Now married:
39.3% (1,135)Unmarried:
60.7% (1,752)
Marital status - Black or African American population 15 years and over
Males 58.4% Never married37.6% Now married0.0% Separated0.0% Widowed4.0% DivorcedFemales 22.4% Never married21.0% Now married5.6% Separated14.0% Widowed36.9% DivorcedWomen who did not give birth in the past 12 months Now married:
49.5% (43)Unmarried:
50.5% (44)
Marital status - American Indian / Alaska Native population 15 years and over
Males 0.0% Never married100.0% Now married0.0% Separated0.0% Widowed0.0% DivorcedFemales 0.0% Never married0.0% Now married0.0% Separated100.0% Widowed0.0% DivorcedMarital status - Asian population 15 years and over
Males 14.5% Never married81.8% Now married3.6% Separated0.0% Widowed0.0% DivorcedFemales 50.0% Never married50.0% Now married0.0% Separated0.0% Widowed0.0% DivorcedWomen who did not give birth in the past 12 months Now married:
50.0% (33)Unmarried:
50.0% (33)
Marital status - Other race population 15 years and over
Males 41.9% Never married58.1% Now married0.0% Separated0.0% Widowed0.0% DivorcedFemales 0.0% Never married0.0% Now married0.0% Separated0.0% Widowed100.0% DivorcedWomen who gave birth in the past 12 months Now married:
0.0% (0)Unmarried:
100.0% (30)
Women who did not give birth in the past 12 months Now married:
0.0% (0)Unmarried:
100.0% (15)
Marital status - Two or more races population 15 years and over
Males 84.6% Never married15.4% Now married0.0% Separated0.0% Widowed0.0% DivorcedFemales 62.6% Never married25.9% Now married0.0% Separated9.6% Widowed1.9% DivorcedWomen who gave birth in the past 12 months Now married:
0.0% (0)Unmarried:
100.0% (7)
Women who did not give birth in the past 12 months Now married:
4.2% (11)Unmarried:
95.8% (238)
Marital status - White alone, not Hispanic / Latino population 15 years and over
Males 36.2% Never married41.9% Now married1.6% Separated3.4% Widowed16.8% DivorcedFemales 33.4% Never married41.1% Now married1.1% Separated12.9% Widowed11.5% DivorcedWomen who gave birth in the past 12 months Now married:
85.0% (236)Unmarried:
15.0% (42)
Women who did not give birth in the past 12 months Now married:
40.3% (1,133)Unmarried:
59.7% (1,680)
Marital status - Hispanic or Latino population 15 years and over
Males 18.8% Never married81.2% Now married0.0% Separated0.0% Widowed0.0% DivorcedFemales 35.9% Never married31.1% Now married0.0% Separated1.9% Widowed31.1% DivorcedWomen who gave birth in the past 12 months Now married:
0.0% (0)Unmarried:
100.0% (5)
Women who did not give birth in the past 12 months Now married:
10.1% (13)Unmarried:
89.9% (115)
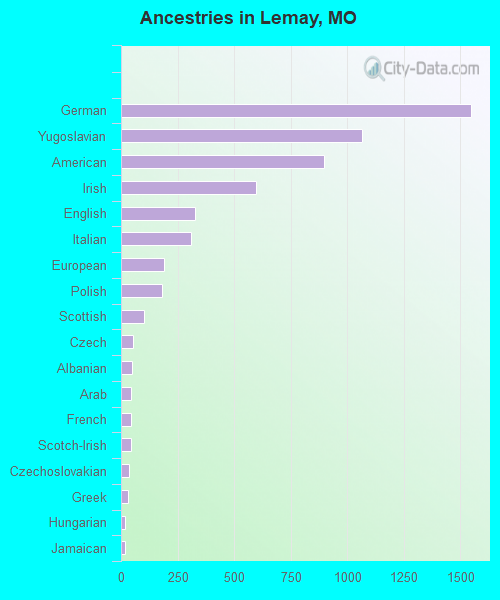
Ancestries in Lemay
1,549 23.8% German1,063 16.3% Yugoslavian896 13.8% American596 9.2% Irish327 5.0% English308 4.7% Italian189 2.9% European180 2.8% Polish103 1.6% Scottish54 0.8% Czech49 0.8% Albanian44 0.7% Arab44 0.7% French43 0.7% Scotch-Irish35 0.5% Czechoslovakian29 0.4% Greek18 0.3% Hungarian16 0.2% Jamaican13 0.2% Austrian11 0.2% Iraqi9 0.1% Norwegian5 0.08% Welsh4 0.06% Swiss
Children Nativity (place of birth) in Lemay
Children under 6 years - Living with two parents Both parents native 541 100.0% NativeBoth parents foreign-born 80 100.0% NativeOne native, one foreign-born parent 93 81.3% Native21 18.7% Foreign-bornChildren under 6 years - Living with one parent Native parent 736 100.0% NativeForeign-born parent 36 100.0% NativeChildren 6 to 17 years - Living with two parents Both parents native 687 100.0% NativeBoth parents foreign-born 94 46.9% Native106 53.1% Foreign-bornOne native, one foreign-born parent 43 44.8% Native53 55.2% Foreign-bornChildren 6 to 17 years - Living with one parent Native parent 795 100.0% NativeForeign-born parent 292 48.6% Native309 51.4% Foreign-born
Grandparents responsible for own grandchildren in Lemay
Grandparents (30 to 59 years) White / Caucasian 131 100.0% Not responsible for grandchildrenTwo or more races 4 100.0% Not responsible for grandchildrenWhite alone, not Hispanic / Latino 131 100.0% Not responsible for grandchildrenHispanic or Latino 4 100.0% Not responsible for grandchildrenGrandparents (60 years and over) White / Caucasian 12 8.8% Responsible for grandchildren127 91.2% Not responsible for grandchildrenTwo or more races 14 17.1% Responsible for grandchildren67 82.9% Not responsible for grandchildrenWhite alone, not Hispanic / Latino 12 8.7% Responsible for grandchildren129 91.3% Not responsible for grandchildrenHispanic or Latino 22 100.0% Responsible for grandchildren