Races in Lemmon Valley-Golden Valley, Nevada (NV) Detailed Stats
Ancestries, Foreign-born residents, place of birth

Discuss Lemmon Valley-Golden Valley, Nevada races on our local forum with over 2,400,000 registered users
3.3% of Lemmon Valley-Golden Valley, NV residents are foreign-born (1.5% born in Latin America, 1.1% born in Asia, 0.5% born in Europe), which is 438.8% less than the foreign-born rate of 18.0% across the entire state of Nevada.
Race distribution in Lemmon Valley-Golden Valley

- 6,02287.8%White alone
- 4065.9%Hispanic
- 1592.3%Two or more races
- 1452.1%American Indian alone
- 801.2%Asian alone
- 240.4%Black alone
- 100.1%Native Hawaiian and Other
Pacific Islander alone - 90.1%Other race alone
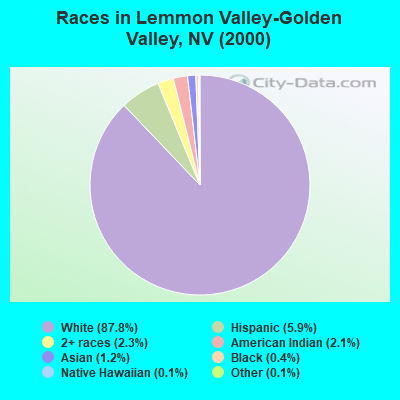
2000
2022
-
- 1,303,00165.2%White alone
- 393,97019.7%Hispanic
- 131,5096.6%Black alone
- 88,5934.4%Asian alone
- 49,2312.5%Two or more races
- 21,3971.1%American Indian alone
- 7,7690.4%Native Hawaiian and Other
Pacific Islander alone - 2,7870.1%Other race alone

-
- 1,410,14544.4%White alone
- 961,35730.3%Hispanic
- 286,4719.0%Black alone
- 281,1498.8%Asian alone
- 182,1515.7%Two or more races
- 20,1020.6%Native Hawaiian and Other
Pacific Islander alone - 18,7810.6%Other race alone
- 17,6160.6%American Indian alone

Income and house value in Lemmon Valley-Golden Valley
- Median household income in 2022
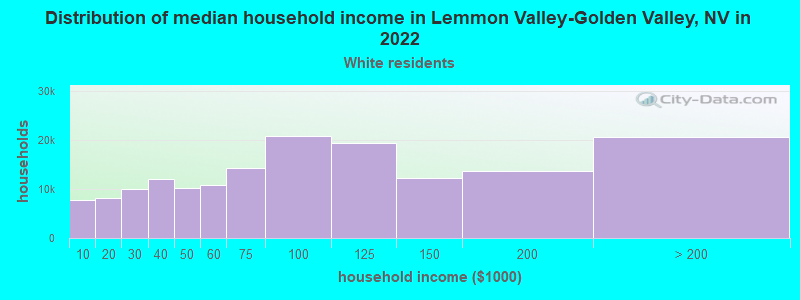
- $90,350White non-Hispanic householders
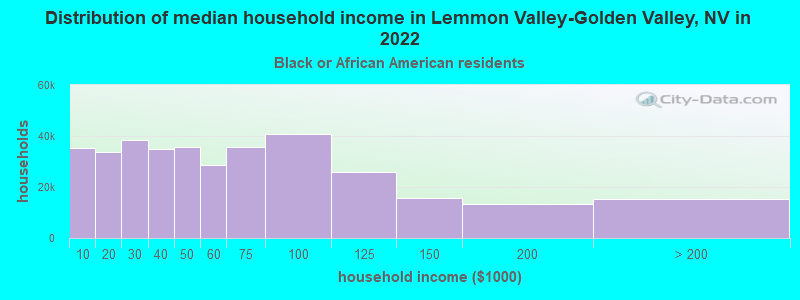
- $182,791Black householders
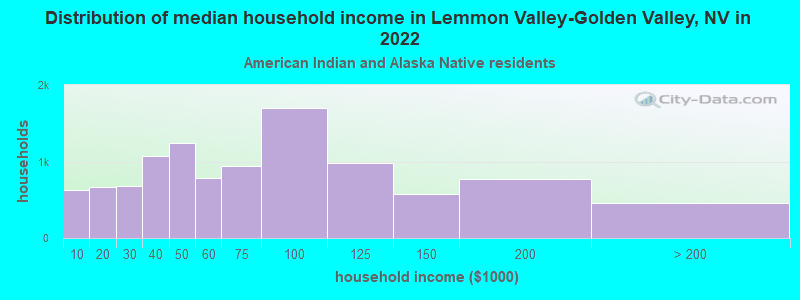
- $113,527American Indian and Alaska Native householders
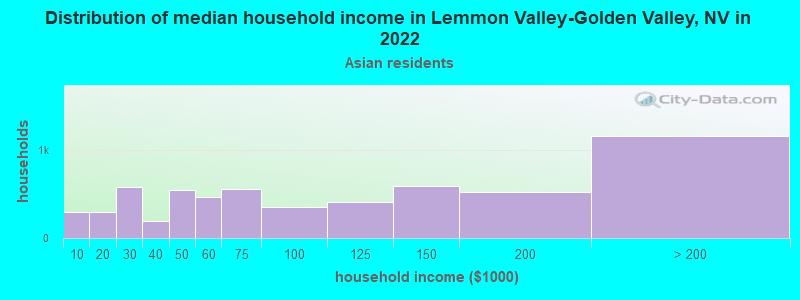
- $51,418Asian householders
- $119,254Some other race householders
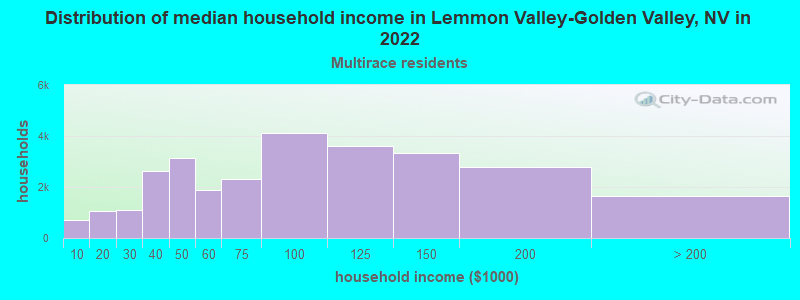
- $105,943Two or more races householders
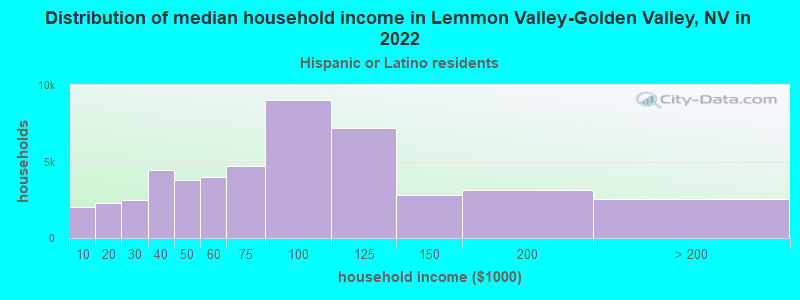
- $102,247Hispanic or Latino race householders
- Median 2022 house value
- $510,886White Non-Hispanic householders
- $975,652Black or African American householders
- $640,382American Indian or Alaska Native householders
- $538,560Asian householders
- $635,770Some other race householders
- $576,521Two or more races householders
- $436,382Hispanic or Latino householders
Household income for White non-Hispanic householders
Household income for Black householders
Household income for American Indian and Alaska Native householders
Household income for Asian householders
Household income for Two or more races householders
Household income for Hispanic or Latino race householders
Foreign-born residents in Lemmon Valley-Golden Valley
229 residents are foreign born (1.5% Latin America, 1.1% Asia, 0.5% Europe).
| This city: | 3.3% |
| Nevada: | 15.8% |
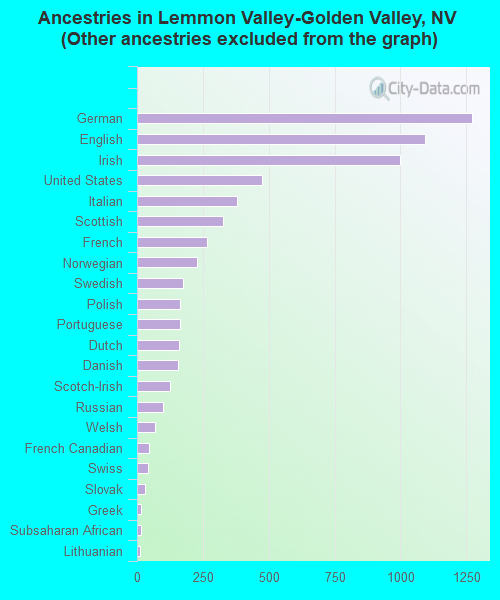
Ancestries in Lemmon Valley-Golden Valley

- 1,38517.9%Other
- 1,27316.5%German
- 1,09414.2%English
- 99912.9%Irish
- 4736.1%United States
- 3794.9%Italian
- 3284.2%Scottish
- 2673.5%French
- 2293.0%Norwegian
- 1732.2%Swedish
- 1642.1%Polish
- 1632.1%Portuguese
- 1612.1%Dutch
- 1572.0%Danish
- 1241.6%Scotch-Irish
- 971.3%Russian
- 670.9%Welsh
- 470.6%French Canadian
- 420.5%Swiss
- 290.4%Slovak
- 160.2%Greek
- 150.2%Subsaharan African
- 130.2%Lithuanian
- 110.1%Ukrainian
- 90.1%Czech
- 90.1%Hungarian
Zip codes: 89506.