Races in Lemont, Illinois (IL) Detailed Stats
Ancestries, Foreign-born residents, place of birth
Settings
X


Recent posts about races in Lemont, Illinois on our local forum with over 2,400,000 registered users:
 | Unique Ethnic Enclaves in Chicago Area (16 replies) |
| Moving to Chicago suburbs 2021 (64 replies) |
| Chicago Suburbs Real Estate (111 replies) |
| South Indians in suburbs (15 replies) |
| Apartments/houses to rent in SW burbs (0 replies) |
| First house....Where to buy now??? (5 replies) |
Latest news about races in Lemont, IL collected exclusively by city-data.com from local newspapers, TV, and radio stations
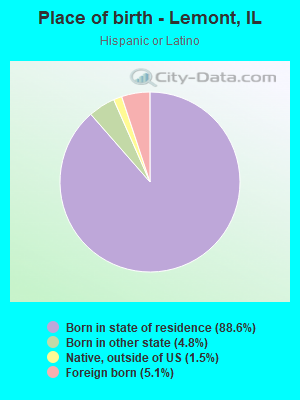
According to 2022 data, the most numerous races in Lemont, IL are White alone (14,847 residents), Hispanic (1,215 residents), and Black alone (243 residents). 74.2% of Lemont residents speak English at home. 15.3% of Lemont, IL residents are foreign-born (13.5% born in Europe), which is 8.5% greater than the foreign-born rate of 14.0% across the entire state of Illinois.
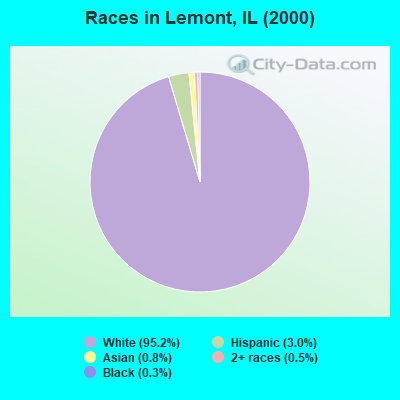
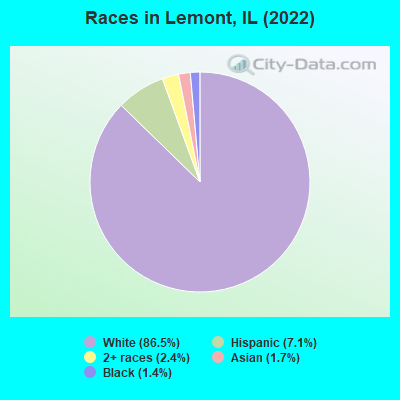
Race distribution in Lemont
2000
2022

- 12,46995.2%White alone
- 3933.0%Hispanic
- 1070.8%Asian alone
- 680.5%Two or more races
- 390.3%Black alone
- 120.09%American Indian alone
- 70.05%Other race alone
- 30.02%Native Hawaiian and Other
Pacific Islander alone
-
- 14,84786.5%White alone
- 1,2157.1%Hispanic
- 4042.4%Two or more races
- 2911.7%Asian alone
- 2431.4%Black alone
- 40.02%American Indian alone
2000
2022
-
- 8,424,14067.8%White alone
- 1,856,15214.9%Black alone
- 1,530,26212.3%Hispanic
- 419,9163.4%Asian alone
- 153,9961.2%Two or more races
- 13,4790.1%Other race alone
- 18,2320.1%American Indian alone
- 3,1160.03%Native Hawaiian and Other
Pacific Islander alone

-
- 7,356,30158.5%White alone
- 2,299,72618.3%Hispanic
- 1,660,42313.2%Black alone
- 747,2965.9%Asian alone
- 458,5993.6%Two or more races
- 45,3860.4%Other race alone
- 10,4050.08%American Indian alone
- 3,8960.03%Native Hawaiian and Other
Pacific Islander alone

Income and house value in Lemont
- Median household income in 2022
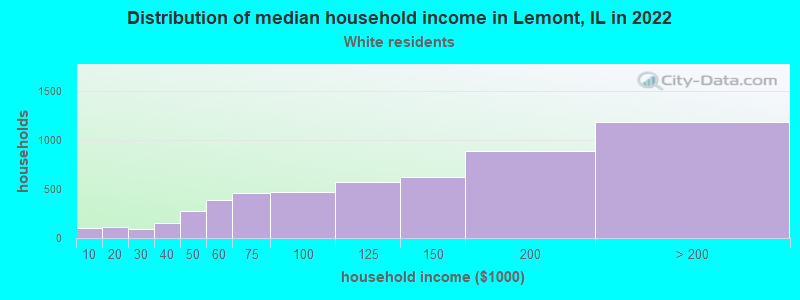
- $125,491White non-Hispanic householders
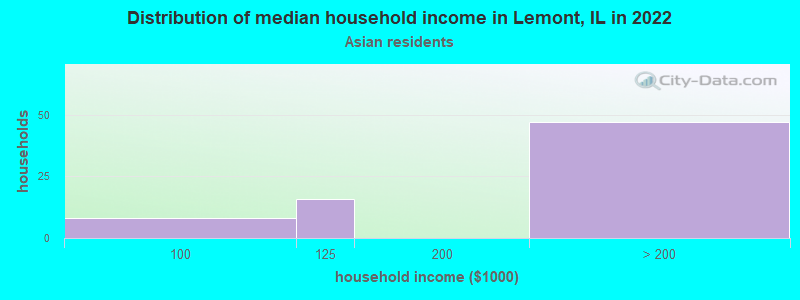
- over $200,000Asian householders
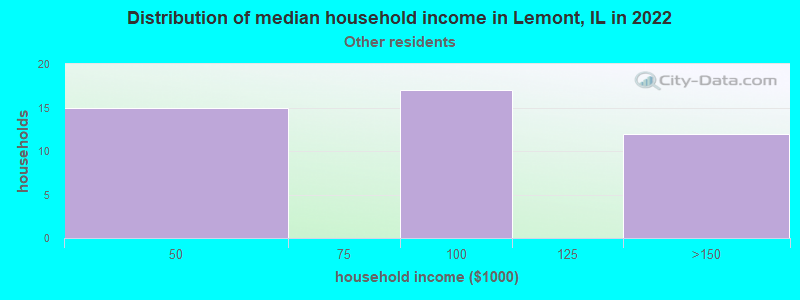
- $100,063Some other race householders
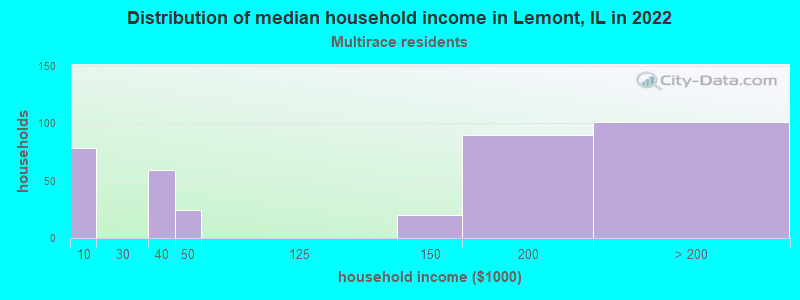
- $177,541Two or more races householders
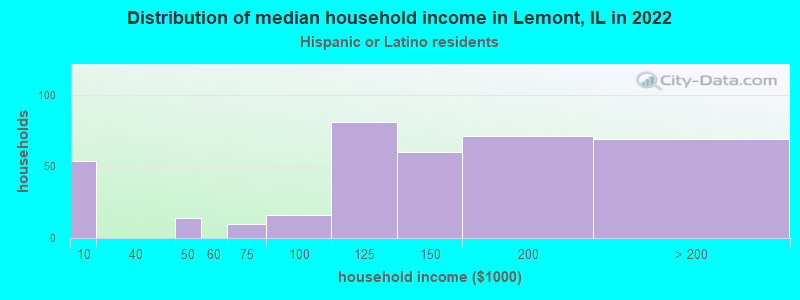
- $144,240Hispanic or Latino race householders
- Median 2022 house value
- $455,453White Non-Hispanic householders
- $707,853Black or African American householders
- $350,084Asian householders
- $328,646Some other race householders
- $707,853Two or more races householders
- $610,574Hispanic or Latino householders
Household income for White non-Hispanic householders
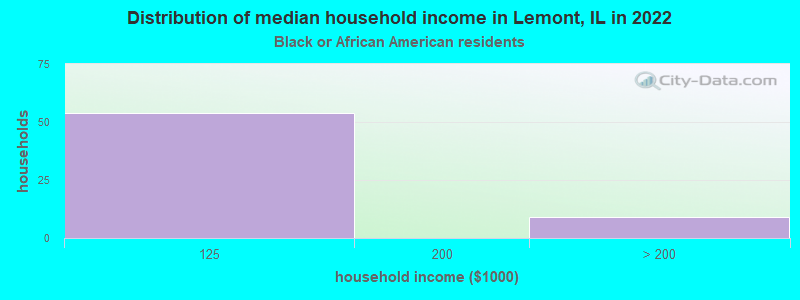
Household income for Black householders
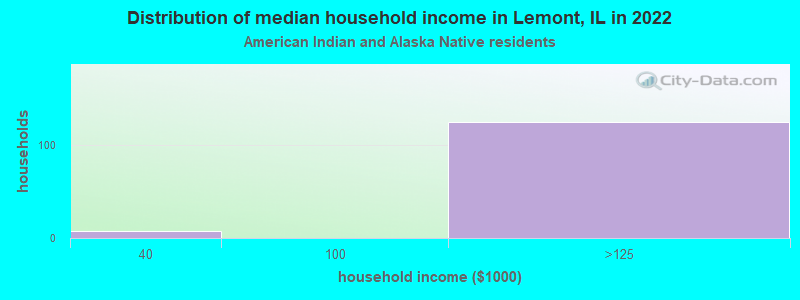
Household income for American Indian and Alaska Native householders
Household income for Asian householders
Household income for Some other race householders
Household income for Two or more races householders
Household income for Hispanic or Latino race householders
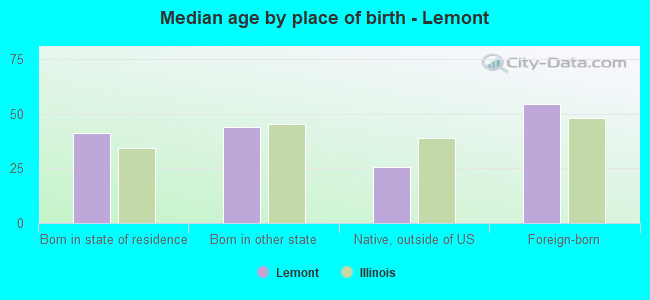
Median age by race in Lemont
- 46.6Median age for White residents
- 45.0Males
- 50.1Females
- 28.1Median age for Black or African American residents
- 59.0Males
- 28.2Females
- -680,473,372.1Median age for American Indian / Alaska Native residents
- -736,736,736.0Males
- -641,399,416.3Females
- 41.3Median age for Asian residents
- 50.5Males
- 30.9Females
- -687,999,999.3Median age for Native Hawaiian / Pacific Islander residents
- -918,721,460.3Males
- -610,229,276.3Females
- 37.1Median age for Other race residents
- 33.4Males
- -687,898,088.5Females
- 45.4Median age for Two or more races residents
- 45.2Males
- 49.1Females
- 46.1Median age for White alone residents
- 44.7Males
- 48.7Females
- 35.7Median age for Hispanic or Latino residents
- 35.6Males
- 40.2Females
Owner/renter occupied households by race in Lemont
- House owners and renters - White residents
- 4,64086.7%Owner occupied
- 71113.3%Renter occupied
- House owners and renters - Black or African American residents
- 60100.0%Owner occupied
- House owners and renters - American Indian / Alaska Native residents
- 10993.4%Owner occupied
- 86.6%Renter occupied
- House owners and renters - Asian residents
- 76100.0%Owner occupied
- House owners and renters - Other race residents
- 49100.0%Owner occupied
- House owners and renters - Two or more races residents
- 373100.0%Owner occupied
- House owners and renters - White alone residents
- 4,83686.0%Owner occupied
- 78414.0%Renter occupied
- House owners and renters - Hispanic or Latino residents
- 377100.0%Owner occupied
Language usage in Lemont
- English speakers - Total
- 74.2% of residents of Lemont speak English at home.
- 1.7% of residents speak Spanish at home
- 21173.5%Speak English very well
- 7626.5%Speak English less than very well
- 24.1% of residents speak other language at home
- 2,94674.3%Speak English very well
- 1,01825.7%Speak English less than very well
- English speakers - Born in the United States
- 91.7% of residents of Lemont speak English at home.
- 0.8% of residents speak Spanish at home
- 14100.0%Speak English very well
- 8.1% of residents speak other language at home
- 141100.0%Speak English very well
- English speakers - Native, born elsewhere
- 44.7% of residents of Lemont speak English at home.
- 16.5% of residents speak Spanish at home
- 17100.0%Speak English very well
- 37.9% of residents speak other language at home
- 39100.0%Speak English very well
- English speakers - Foreign-born
- 10.1% of residents of Lemont speak English at home.
- 2.3% of residents speak Spanish at home
- 1829.5%Speak English very well
- 4370.5%Speak English less than very well
- 87.1% of residents speak other language at home
- 1,30457.0%Speak English very well
- 98243.0%Speak English less than very well
White (Caucasian) - Speak only English
| Native: | 91.2% (10,441) |
| Foreign-born: | 7.3% (131) |
White (Caucasian) - Speak another language
| Native: | 9.5% (1,091) |
| Foreign-born: | 92.2% (1,652) |
Asian - Speak only English
| Native: | 84.7% (80) |
| Foreign-born: | 35.5% (70) |
Asian - Speak another language
| Native: | 15.5% (15) |
| Foreign-born: | 61.0% (121) |
Two or more races - Speak only English
| Native: | 81.2% (878) |
| Foreign-born: | 71.0% (63) |
Two or more races - Speak another language
| Native: | 16.1% (174) |
| Foreign-born: | 29.0% (26) |
White alone - Speak only English
| Native: | 86.2% (10,297) |
| Foreign-born: | 6.4% (145) |
White alone - Speak another language
| Native: | 14.4% (1,715) |
| Foreign-born: | 94.7% (2,158) |
Hispanic or Latino - Speak another language
| Native: | 17.1% (185) |
| Foreign-born: | 100.0% (61) |
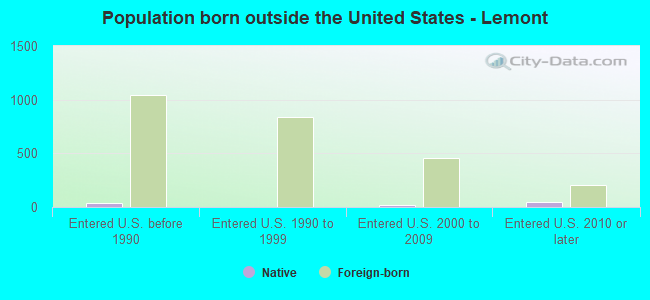
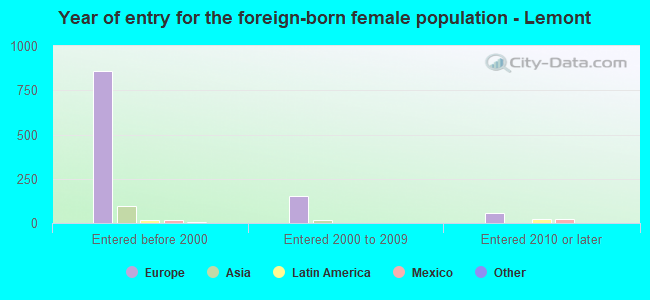
Foreign-born residents in Lemont
2,627 residents are foreign born (13.5% Europe).
| This city: | 15.3% |
| Illinois: | 14.1% |
Marital status for residents in Lemont
Marital status - White (Caucasian) population 15 years and over
- Males
- 26.4%Never married
- 64.0%Now married
- 0.6%Separated
- 2.9%Widowed
- 6.2%Divorced
- Females
- 22.5%Never married
- 58.1%Now married
- 1.8%Separated
- 10.5%Widowed
- 7.1%Divorced
Women who gave birth in the past 12 months
| Now married: | 100.0% (164) |
| Unmarried: | 0.0% (0) |
Women who did not give birth in the past 12 months
| Now married: | 47.0% (1,104) |
| Unmarried: | 53.0% (1,245) |
Marital status - Black or African American population 15 years and over
- Males
- 31.3%Never married
- 68.7%Now married
- 0.0%Separated
- 0.0%Widowed
- 0.0%Divorced
- Females
- 77.5%Never married
- 10.1%Now married
- 0.0%Separated
- 5.6%Widowed
- 6.7%Divorced
Women who did not give birth in the past 12 months
| Now married: | 11.5% (8) |
| Unmarried: | 88.5% (65) |
Marital status - American Indian / Alaska Native population 15 years and over
- Males
- 100.0%Never married
- 0.0%Now married
- 0.0%Separated
- 0.0%Widowed
- 0.0%Divorced
- Females
- 0.0%Never married
- 0.0%Now married
- 100.0%Separated
- 0.0%Widowed
- 0.0%Divorced
Marital status - Asian population 15 years and over
- Males
- 16.3%Never married
- 73.9%Now married
- 0.0%Separated
- 9.8%Widowed
- 0.0%Divorced
- Females
- 51.4%Never married
- 48.6%Now married
- 0.0%Separated
- 0.0%Widowed
- 0.0%Divorced
Women who did not give birth in the past 12 months
| Now married: | 36.6% (41) |
| Unmarried: | 63.4% (72) |
Marital status - Other race population 15 years and over
- Males
- 41.9%Never married
- 23.3%Now married
- 0.0%Separated
- 0.0%Widowed
- 34.9%Divorced
- Females
- 53.3%Never married
- 46.7%Now married
- 0.0%Separated
- 0.0%Widowed
- 0.0%Divorced
Women who did not give birth in the past 12 months
| Now married: | 46.7% (16) |
| Unmarried: | 53.3% (18) |
Marital status - Two or more races population 15 years and over
- Males
- 31.2%Never married
- 29.5%Now married
- 0.0%Separated
- 0.0%Widowed
- 39.3%Divorced
- Females
- 21.0%Never married
- 65.1%Now married
- 3.3%Separated
- 5.1%Widowed
- 5.5%Divorced
Women who gave birth in the past 12 months
| Now married: | 100.0% (24) |
| Unmarried: | 0.0% (0) |
Women who did not give birth in the past 12 months
| Now married: | 0.0% (0) |
| Unmarried: | 100.0% (119) |
Marital status - White alone, not Hispanic / Latino population 15 years and over
- Males
- 26.2%Never married
- 63.9%Now married
- 0.6%Separated
- 2.9%Widowed
- 6.4%Divorced
- Females
- 22.1%Never married
- 58.4%Now married
- 1.8%Separated
- 10.7%Widowed
- 6.9%Divorced
Women who gave birth in the past 12 months
| Now married: | 100.0% (184) |
| Unmarried: | 0.0% (0) |
Women who did not give birth in the past 12 months
| Now married: | 47.5% (1,232) |
| Unmarried: | 52.5% (1,363) |
Marital status - Hispanic or Latino population 15 years and over
- Males
- 34.1%Never married
- 34.5%Now married
- 0.0%Separated
- 0.0%Widowed
- 31.4%Divorced
- Females
- 38.3%Never married
- 44.5%Now married
- 2.9%Separated
- 4.5%Widowed
- 9.7%Divorced
Women who gave birth in the past 12 months
| Now married: | 100.0% (9) |
| Unmarried: | 0.0% (0) |
Women who did not give birth in the past 12 months
| Now married: | 13.7% (22) |
| Unmarried: | 86.3% (139) |
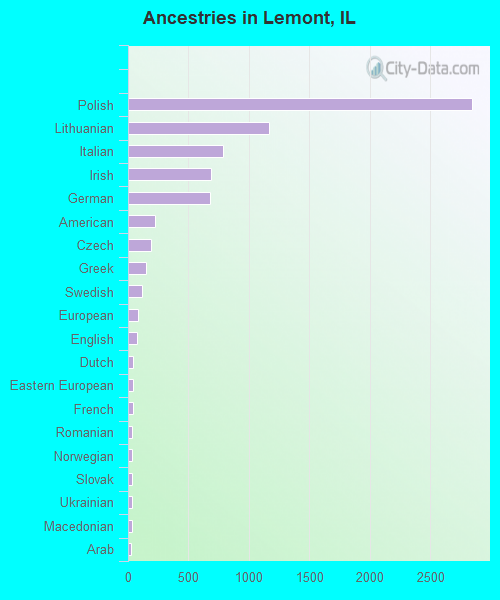
Ancestries in Lemont

- 2,84234.7%Polish
- 1,16914.3%Lithuanian
- 7839.6%Italian
- 6888.4%Irish
- 6808.3%German
- 2212.7%American
- 1922.3%Czech
- 1471.8%Greek
- 1171.4%Swedish
- 861.0%European
- 730.9%English
- 450.5%Dutch
- 400.5%Eastern European
- 380.5%French
- 360.4%Romanian
- 310.4%Norwegian
- 310.4%Slovak
- 300.4%Ukrainian
- 290.4%Macedonian
- 270.3%Arab
- 230.3%Slavic
- 210.3%Scandinavian
- 190.2%Hungarian
- 140.2%Austrian
- 110.1%Russian
- 110.1%Welsh
- 110.1%Haitian
- 100.1%Slovene
- 90.1%British
- 90.1%Croatian
- 80.10%Northern European
- 80.10%French Canadian
- 70.09%Czechoslovakian
- 40.05%Assyrian
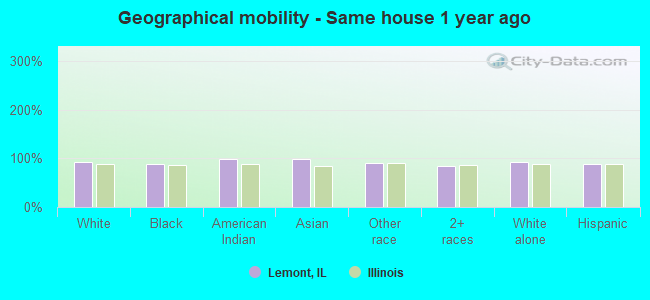
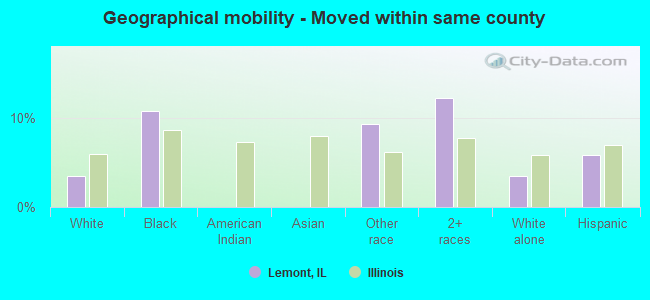
Geographical mobility in Lemont

- Same house 1 year ago
- 12,63692.5%White (Caucasian)
- 21488.1%Black or African American
- 10198.7%American Indian / Alaska Native
- 28899.0%Asian
- 9489.8%Other race
- 1,04584.8%Two or more races
- 13,69192.9%White alone, not Hispanic / Latino
- 1,06888.5%Hispanic or Latino
-
- Moved within same county
- 4703.4%White / Caucasian
- 2610.7%Black or African American
- 109.2%Other race
- 15112.2%Two or more races
- 5183.5%White alone, not Hispanic / Latino
- 705.8%Hispanic or Latino
-
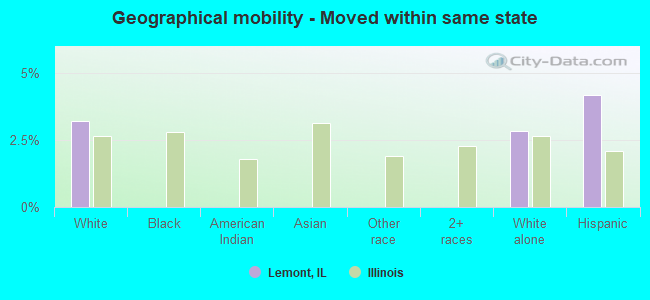
- Moved within same state
- 4393.2%White / Caucasian
- 4172.8%White alone, not Hispanic / Latino
- 504.2%Hispanic or Latino
-
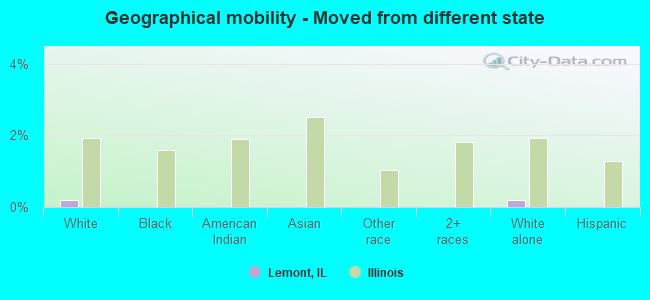
- Moved from different state
- 280.2%White / Caucasian
- 290.2%White alone, not Hispanic / Latino
-
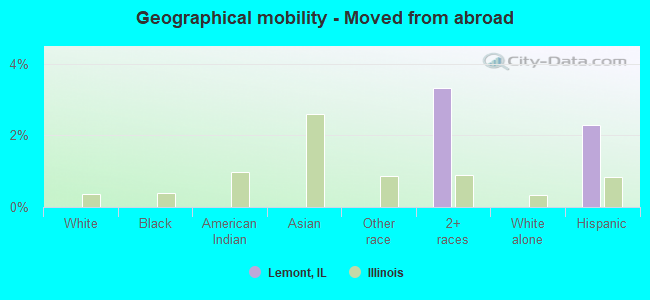
- Moved from abroad
- 413.3%Two or more races
- 282.3%Hispanic or Latino
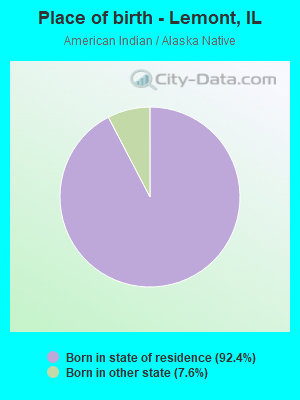
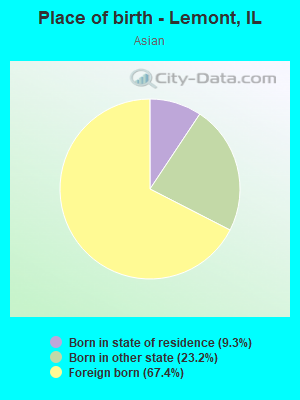
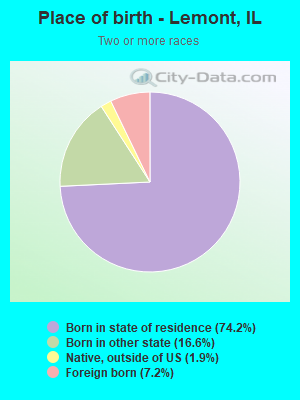
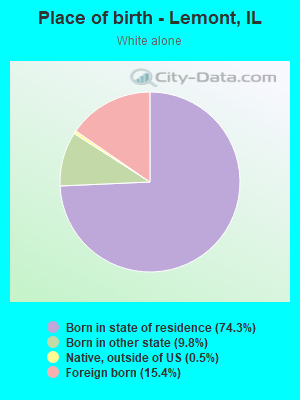
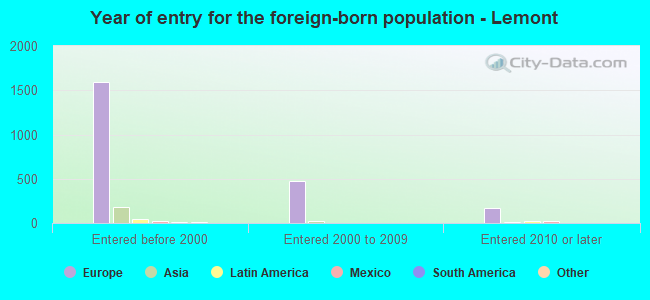
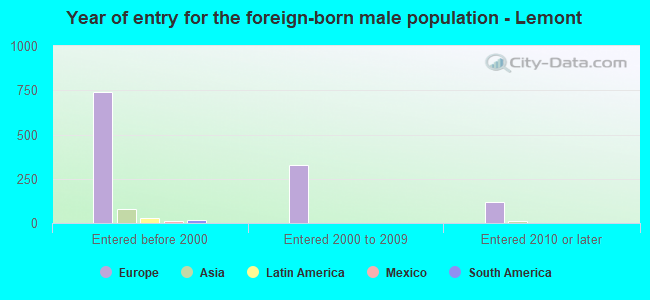
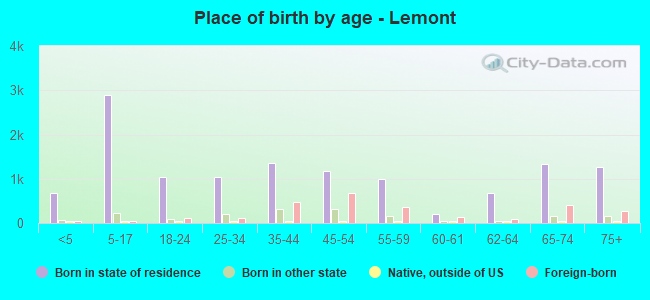
Children Nativity (place of birth) in Lemont
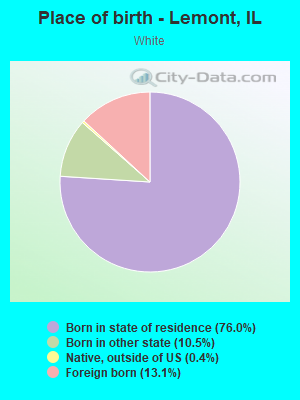
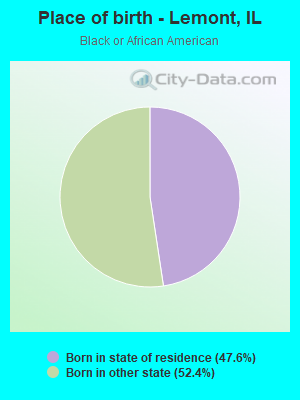
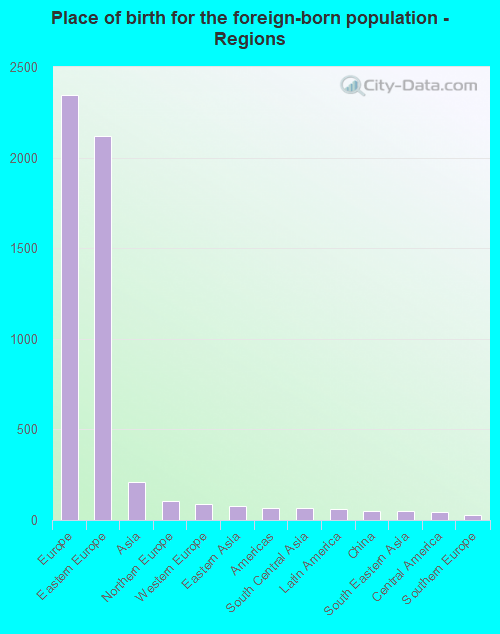
Place of birth for residents in Lemont
![Place of birth for the foreign-born population - Regions]()
- 2,348Europe
- 2,121Eastern Europe
- 209Asia
- 106Northern Europe
- 90Western Europe
- 77Eastern Asia
- 68Americas
- 67South Central Asia
- 60Latin America
- 50China
- 48South Eastern Asia
- 42Central America
- 30Southern Europe
- 17South America
- 15Western Asia
- 7Northern America
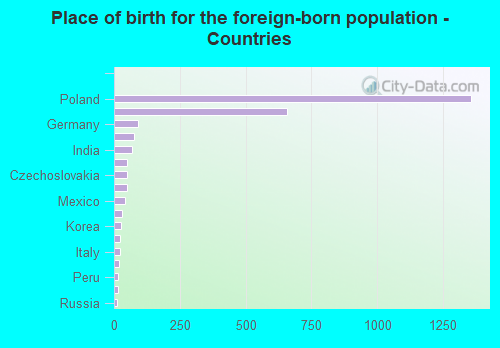
![Place of birth for the foreign-born population - Countries]()
- 1,357Poland
- 657Lithuania
- 90Germany
- 76England
- 67India
- 50China
- 49Czechoslovakia
- 48Philippines
- 42Mexico
- 29Ireland
- 26Korea
- 23Moldova
- 21Italy
- 18North Macedonia (Macedonia)
- 17Peru
- 15Jordan
- 13Russia
- 8Greece
- 7Canada
Grandparents responsible for own grandchildren in Lemont
Zip codes: 60439.