Races in Leonia, New Jersey (NJ) Detailed Stats
Data:
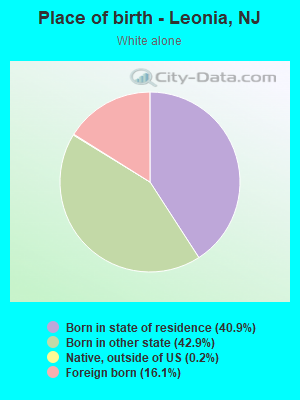
Races - White alone (%)
Races - White alone (% change since 2000)
Races - Black alone (%)
Races - Black alone (% change since 2000)
Races - American Indian alone (%)
Races - American Indian alone (% change since 2000)
Races - Asian alone (%)
Races - Asian alone (% change since 2000)
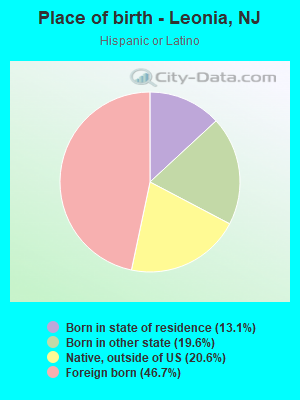
Races - Hispanic (%)
Races - Hispanic (% change since 2000)
Races - Native Hawaiian and Other Pacific Islander alone (%)
Races - Native Hawaiian and Other Pacific Islander alone (% change since 2000)
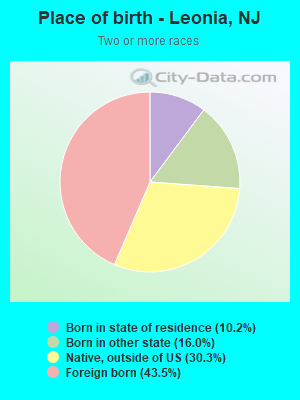
Races - Two or more races(%)
Races - Two or more races(% change since 2000)
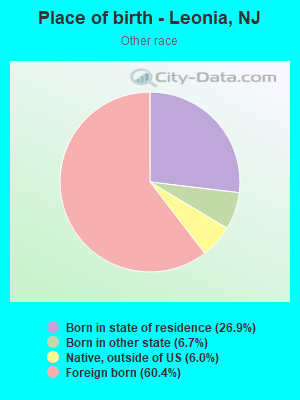
Races - Other race alone (%)
Races - Other race alone (% change since 2000)
Racial diversity
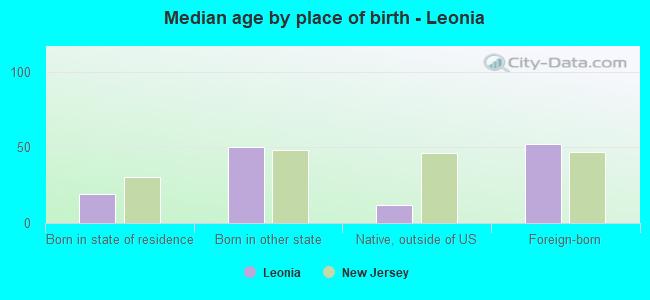
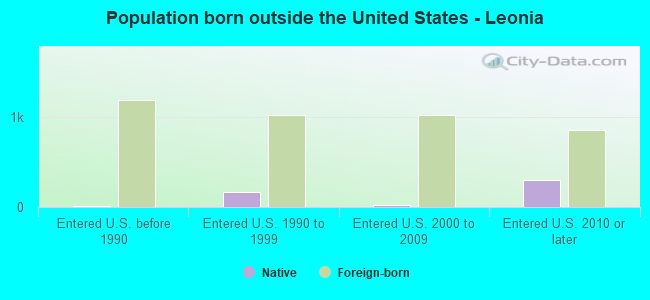
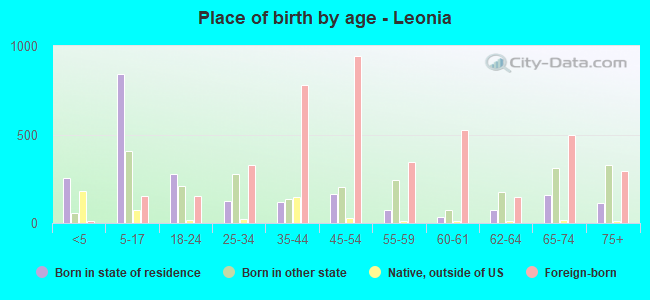
Place of birth - Born in state of residence (%)
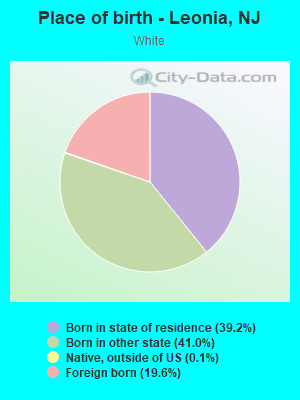
Place of birth - Born in state of residence (%) - White
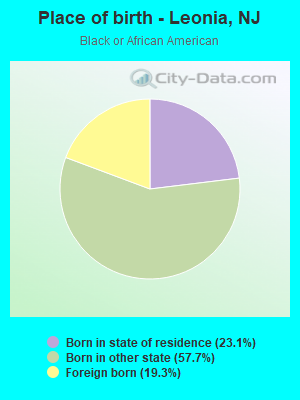
Place of birth - Born in state of residence (%) - Black or African American
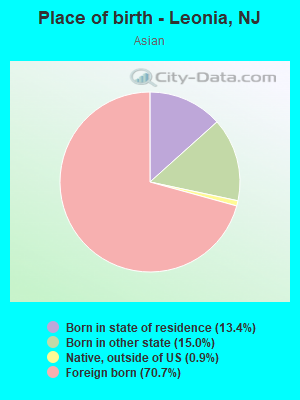
Place of birth - Born in state of residence (%) - Asian
Place of birth - Born in state of residence (%) - Hispanic or Latino
Place of birth - Born in state of residence (%) - American Indian and Alaska Native
Place of birth - Born in state of residence (%) - Multirace
Place of birth - Born in state of residence (%) - Other Race
Place of birth - Born in other state (%)
Place of birth - Born in other state (%) - White
Place of birth - Born in other state (%) - Black or African American
Place of birth - Born in other state (%) - Asian
Place of birth - Born in other state (%) - Hispanic or Latino
Place of birth - Born in other state (%) - American Indian and Alaska Native
Place of birth - Born in other state (%) - Multirace
Place of birth - Born in other state (%) - Other Race
Place of birth - Native, outside of US (%)
Place of birth - Native, outside of US (%) - White
Place of birth - Native, outside of US (%) - Black or African American
Place of birth - Native, outside of US (%) - Asian
Place of birth - Native, outside of US (%) - Hispanic or Latino
Place of birth - Native, outside of US (%) - American Indian and Alaska Native
Place of birth - Native, outside of US (%) - Multirace
Place of birth - Native, outside of US (%) - Other Race
Place of birth - Foreign born (%)
Place of birth - Foreign born (%) - White
Place of birth - Foreign born (%) - Black or African American
Place of birth - Foreign born (%) - Asian
Place of birth - Foreign born (%) - Hispanic or Latino
Place of birth - Foreign born (%) - American Indian and Alaska Native
Place of birth - Foreign born (%) - Multirace
Place of birth - Foreign born (%) - Other Race
Residents speaking English at home (%)
Residents speaking English at home - Born in the United States (%)
Residents speaking English at home - Native, born elsewhere (%)
Residents speaking English at home - Foreign born (%)
Residents speaking Spanish at home (%)
Residents speaking Spanish at home - Born in the United States (%)
Residents speaking Spanish at home - Native, born elsewhere (%)
Residents speaking Spanish at home - Foreign born (%)
Residents speaking other language at home (%)
Residents speaking other language at home - Born in the United States (%)
Residents speaking other language at home - Native, born elsewhere (%)
Residents speaking other language at home - Foreign born (%)
Marital status - Never married (%)
Marital status - Now married (%)
Marital status - Separated (%)
Marital status - Widowed (%)
Marital status - Divorced (%)
Ancestries Reported - Arab (%)
Ancestries Reported - Czech (%)
Ancestries Reported - Danish (%)
Ancestries Reported - Dutch (%)
Ancestries Reported - English (%)
Ancestries Reported - French (%)
Ancestries Reported - French Canadian (%)
Ancestries Reported - German (%)
Ancestries Reported - Greek (%)
Ancestries Reported - Hungarian (%)
Ancestries Reported - Irish (%)
Ancestries Reported - Italian (%)
Ancestries Reported - Lithuanian (%)
Ancestries Reported - Norwegian (%)
Ancestries Reported - Polish (%)
Ancestries Reported - Portuguese (%)
Ancestries Reported - Russian (%)
Ancestries Reported - Scotch-Irish (%)
Ancestries Reported - Scottish (%)
Ancestries Reported - Slovak (%)
Ancestries Reported - Subsaharan African (%)
Ancestries Reported - Swedish (%)
Ancestries Reported - Swiss (%)
Ancestries Reported - Ukrainian (%)
Ancestries Reported - United States (%)
Ancestries Reported - Welsh (%)
Ancestries Reported - West Indian (%)
Ancestries Reported - Other (%)
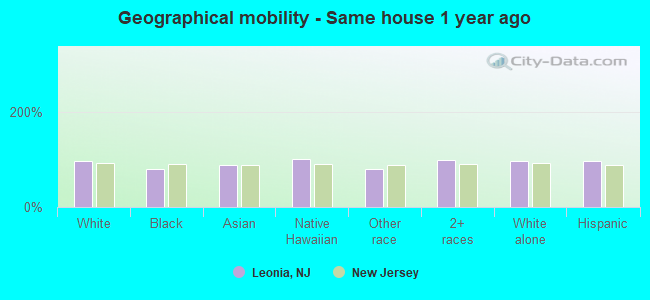
Geographical mobility - Same house 1 year ago (%)
Geographical mobility - Same house 1 year ago (%) - White
Geographical mobility - Same house 1 year ago (%) - Black or African American
Geographical mobility - Same house 1 year ago (%) - Asian
Geographical mobility - Same house 1 year ago (%) - Hispanic or Latino
Geographical mobility - Same house 1 year ago (%) - American Indian and Alaska Native
Geographical mobility - Same house 1 year ago (%) - Multirace
Geographical mobility - Same house 1 year ago (%) - Other Race
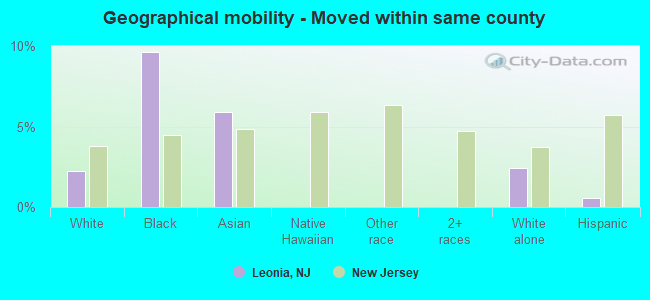
Geographical mobility - Moved within same county (%)
Geographical mobility - Moved within same county (%) - White
Geographical mobility - Moved within same county (%) - Black or African American
Geographical mobility - Moved within same county (%) - Asian
Geographical mobility - Moved within same county (%) - Hispanic or Latino
Geographical mobility - Moved within same county (%) - American Indian and Alaska Native
Geographical mobility - Moved within same county (%) - Multirace
Geographical mobility - Moved within same county (%) - Other Race
Geographical mobility - Moved from different county within same state (%)
Geographical mobility - Moved from different county within same state (%) - White
Geographical mobility - Moved from different county within same state (%) - Black or African American
Geographical mobility - Moved from different county within same state (%) - Asian
Geographical mobility - Moved from different county within same state (%) - Hispanic or Latino
Geographical mobility - Moved from different county within same state (%) - American Indian and Alaska Native
Geographical mobility - Moved from different county within same state (%) - Multirace
Geographical mobility - Moved from different county within same state (%) - Other Race
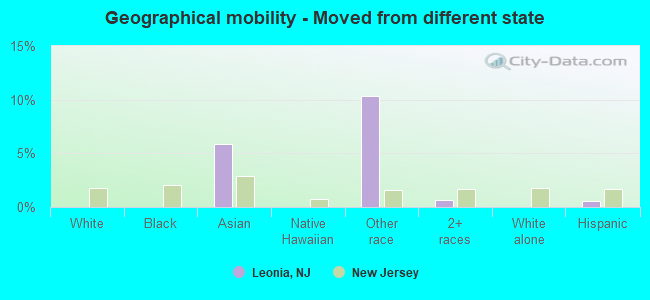
Geographical mobility - Moved from different state (%)
Geographical mobility - Moved from different state (%) - White
Geographical mobility - Moved from different state (%) - Black or African American
Geographical mobility - Moved from different state (%) - Asian
Geographical mobility - Moved from different state (%) - Hispanic or Latino
Geographical mobility - Moved from different state (%) - American Indian and Alaska Native
Geographical mobility - Moved from different state (%) - Multirace
Geographical mobility - Moved from different state (%) - Other Race
Geographical mobility - Moved from abroad (%)
Geographical mobility - Moved from abroad (%) - White
Geographical mobility - Moved from abroad (%) - Black or African American
Geographical mobility - Moved from abroad (%) - Asian
Geographical mobility - Moved from abroad (%) - Hispanic or Latino
Geographical mobility - Moved from abroad (%) - American Indian and Alaska Native
Geographical mobility - Moved from abroad (%) - Multirace
Geographical mobility - Moved from abroad (%) - Other Race
Place of birth for the foreign-born population - Ireland (%)
Place of birth for the foreign-born population - Denmark (%)
Place of birth for the foreign-born population - Norway (%)
Place of birth for the foreign-born population - Sweden (%)
Place of birth for the foreign-born population - United Kingdom (%)
Place of birth for the foreign-born population - England (%)
Place of birth for the foreign-born population - Scotland (%)
Place of birth for the foreign-born population - Other Northern Europe (%)
Place of birth for the foreign-born population - Austria (%)
Place of birth for the foreign-born population - Belgium (%)
Place of birth for the foreign-born population - France (%)
Place of birth for the foreign-born population - Germany (%)
Place of birth for the foreign-born population - Netherlands (%)
Place of birth for the foreign-born population - Switzerland (%)
Place of birth for the foreign-born population - Other Western Europe (%)
Place of birth for the foreign-born population - Greece (%)
Place of birth for the foreign-born population - Italy (%)
Place of birth for the foreign-born population - Portugal (%)
Place of birth for the foreign-born population - Spain (%)
Place of birth for the foreign-born population - Other Southern Europe (%)
Place of birth for the foreign-born population - Albania (%)
Place of birth for the foreign-born population - Belarus (%)
Place of birth for the foreign-born population - Bosnia and Herzegovina (%)
Place of birth for the foreign-born population - Bulgaria (%)
Place of birth for the foreign-born population - Croatia (%)
Place of birth for the foreign-born population - Czechoslovakia (%)
Place of birth for the foreign-born population - Hungary (%)
Place of birth for the foreign-born population - Latvia (%)
Place of birth for the foreign-born population - Lithuania (%)
Place of birth for the foreign-born population - North Macedonia (Macedonia) (%)
Place of birth for the foreign-born population - Moldova (%)
Place of birth for the foreign-born population - Poland (%)
Place of birth for the foreign-born population - Romania (%)
Place of birth for the foreign-born population - Russia (%)
Place of birth for the foreign-born population - Serbia (%)
Place of birth for the foreign-born population - Ukraine (%)
Place of birth for the foreign-born population - Other Eastern Europe (%)
Place of birth for the foreign-born population - China (%)
Place of birth for the foreign-born population - Hong Kong (%)
Place of birth for the foreign-born population - Taiwan (%)
Place of birth for the foreign-born population - Japan (%)
Place of birth for the foreign-born population - Korea (%)
Place of birth for the foreign-born population - Other Eastern Asia (%)
Place of birth for the foreign-born population - Afghanistan (%)
Place of birth for the foreign-born population - Bangladesh (%)
Place of birth for the foreign-born population - India (%)
Place of birth for the foreign-born population - Iran (%)
Place of birth for the foreign-born population - Kazakhstan (%)
Place of birth for the foreign-born population - Nepal (%)
Place of birth for the foreign-born population - Pakistan (%)
Place of birth for the foreign-born population - Sri Lanka (%)
Place of birth for the foreign-born population - Uzbekistan (%)
Place of birth for the foreign-born population - Other South Central Asia (%)
Place of birth for the foreign-born population - Burma (%)
Place of birth for the foreign-born population - Cambodia (%)
Place of birth for the foreign-born population - Indonesia (%)
Place of birth for the foreign-born population - Laos (%)
Place of birth for the foreign-born population - Malaysia (%)
Place of birth for the foreign-born population - Philippines (%)
Place of birth for the foreign-born population - Singapore (%)
Place of birth for the foreign-born population - Thailand (%)
Place of birth for the foreign-born population - Vietnam (%)
Place of birth for the foreign-born population - Other South Eastern Asia (%)
Place of birth for the foreign-born population - Armenia (%)
Place of birth for the foreign-born population - Iraq (%)
Place of birth for the foreign-born population - Israel (%)
Place of birth for the foreign-born population - Jordan (%)
Place of birth for the foreign-born population - Kuwait (%)
Place of birth for the foreign-born population - Lebanon (%)
Place of birth for the foreign-born population - Saudi Arabia (%)
Place of birth for the foreign-born population - Syria (%)
Place of birth for the foreign-born population - Turkey (%)
Place of birth for the foreign-born population - Yemen (%)
Place of birth for the foreign-born population - Other Western Asia (%)
Place of birth for the foreign-born population - Eritrea (%)
Place of birth for the foreign-born population - Ethiopia (%)
Place of birth for the foreign-born population - Kenya (%)
Place of birth for the foreign-born population - Somalia (%)
Place of birth for the foreign-born population - Uganda (%)
Place of birth for the foreign-born population - Zimbabwe (%)
Place of birth for the foreign-born population - Other Eastern Africa (%)
Place of birth for the foreign-born population - Cameroon (%)
Place of birth for the foreign-born population - Congo (%)
Place of birth for the foreign-born population - Democratic Republic of Congo (Zaire) (%)
Place of birth for the foreign-born population - Other Middle Africa (%)
Place of birth for the foreign-born population - Egypt (%)
Place of birth for the foreign-born population - Morocco (%)
Place of birth for the foreign-born population - Sudan (%)
Place of birth for the foreign-born population - Other Northern Africa (%)
Place of birth for the foreign-born population - South Africa (%)
Place of birth for the foreign-born population - Other Southern Africa (%)
Place of birth for the foreign-born population - Cabo Verde (%)
Place of birth for the foreign-born population - Ghana (%)
Place of birth for the foreign-born population - Liberia (%)
Place of birth for the foreign-born population - Nigeria (%)
Place of birth for the foreign-born population - Senegal (%)
Place of birth for the foreign-born population - Sierra Leone (%)
Place of birth for the foreign-born population - Other Western Africa (%)
Place of birth for the foreign-born population - Australia (%)
Place of birth for the foreign-born population - New Zealand (%)
Place of birth for the foreign-born population - Fiji (%)
Place of birth for the foreign-born population - Micronesia (%)
Place of birth for the foreign-born population - Bahamas (%)
Place of birth for the foreign-born population - Barbados (%)
Place of birth for the foreign-born population - Cuba (%)
Place of birth for the foreign-born population - Dominica (%)
Place of birth for the foreign-born population - Dominican Republic (%)
Place of birth for the foreign-born population - Grenada (%)
Place of birth for the foreign-born population - Haiti (%)
Place of birth for the foreign-born population - Jamaica (%)
Place of birth for the foreign-born population - St. Vincent and the Grenadines (%)
Place of birth for the foreign-born population - Trinidad and Tobago (%)
Place of birth for the foreign-born population - West Indies (%)
Place of birth for the foreign-born population - Other Caribbean (%)
Place of birth for the foreign-born population - Belize (%)
Place of birth for the foreign-born population - Costa Rica (%)
Place of birth for the foreign-born population - El Salvador (%)
Place of birth for the foreign-born population - Guatemala (%)
Place of birth for the foreign-born population - Honduras (%)
Place of birth for the foreign-born population - Mexico (%)
Place of birth for the foreign-born population - Nicaragua (%)
Place of birth for the foreign-born population - Panama (%)
Place of birth for the foreign-born population - Other Central America (%)
Place of birth for the foreign-born population - Argentina (%)
Place of birth for the foreign-born population - Bolivia (%)
Place of birth for the foreign-born population - Brazil (%)
Place of birth for the foreign-born population - Chile (%)
Place of birth for the foreign-born population - Colombia (%)
Place of birth for the foreign-born population - Ecuador (%)
Place of birth for the foreign-born population - Guyana (%)
Place of birth for the foreign-born population - Peru (%)
Place of birth for the foreign-born population - Uruguay (%)
Place of birth for the foreign-born population - Venezuela (%)
Place of birth for the foreign-born population - Other South America (%)
Place of birth for the foreign-born population - Canada (%)
Place of birth for the foreign-born population - Other Northern America (%)
Place of birth for the foreign-born population - Other (%)
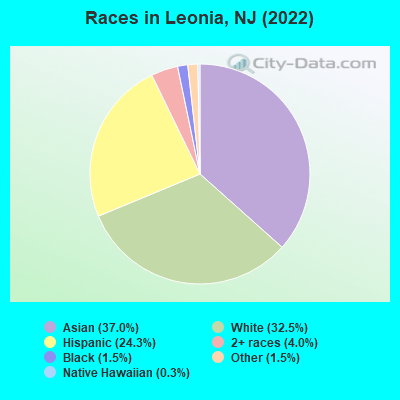
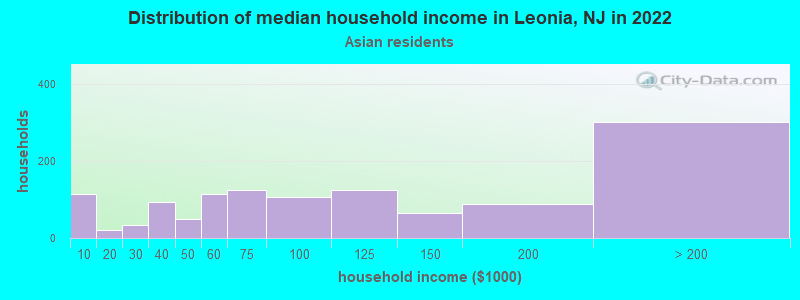
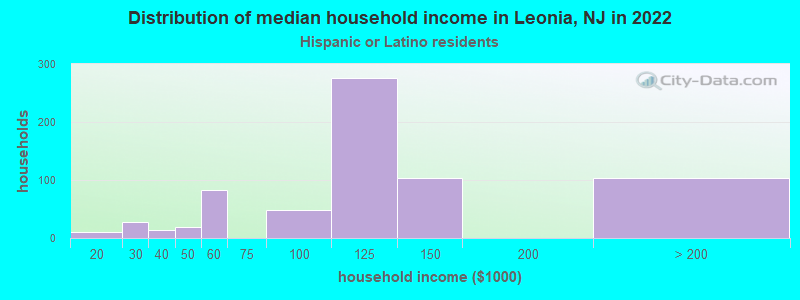
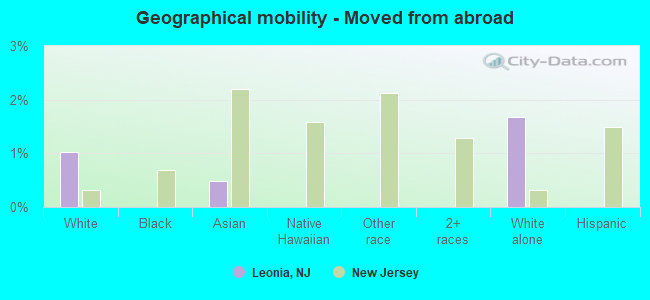
According to 2022 data, the most numerous races in Leonia, NJ are White alone (3,013 residents), Hispanic (2,255 residents), and Black alone (141 residents). 45.6% of Leonia residents speak English at home. 44.8% of Leonia, NJ residents are foreign-born (28.0% born in Asia, 11.3% born in Latin America), which is 48.7% greater than the foreign-born rate of 23.0% across the entire state of New Jersey.
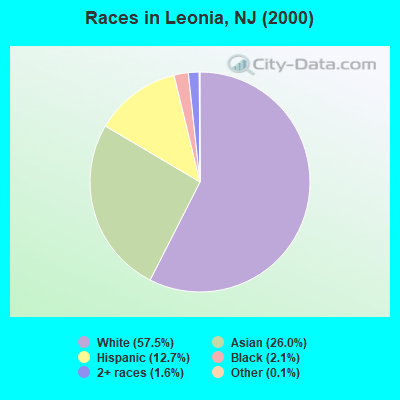
Race distribution in Leonia
2000 2022
5,557,209 66.0% White alone 1,117,191 13.3% Hispanic 1,096,171 13.0% Black alone 477,012 5.7% Asian alone 133,689 1.6% Two or more races 19,565 0.2% Other race alone 11,338 0.1% American Indian alone 2,175 0.03% Native Hawaiian and Other
4,766,476 51.5% White alone 2,028,470 21.9% Hispanic 1,111,632 12.0% Black alone 923,546 10.0% Asian alone 332,237 3.6% Two or more races 89,847 1.0% Other race alone 8,557 0.09% American Indian alone 934 0.01% Native Hawaiian and Other
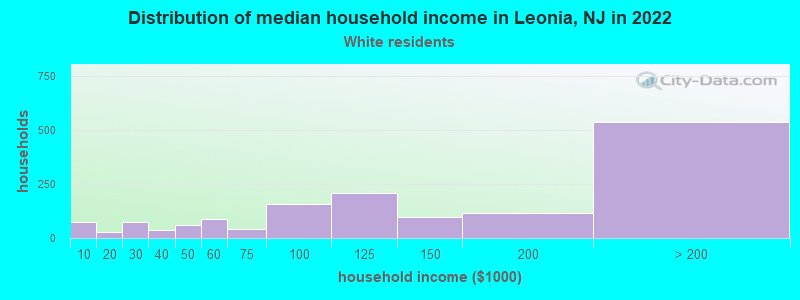
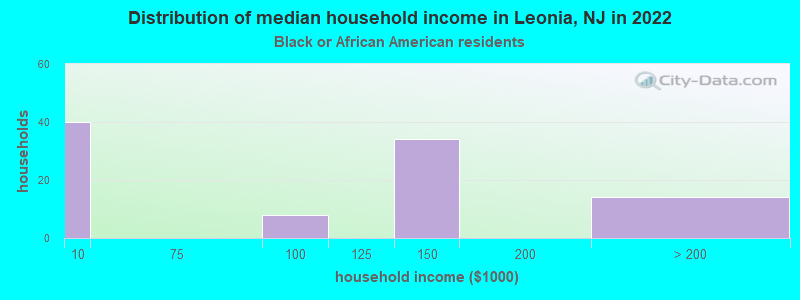
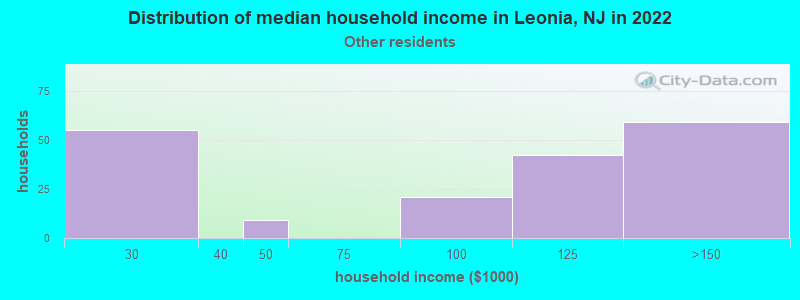
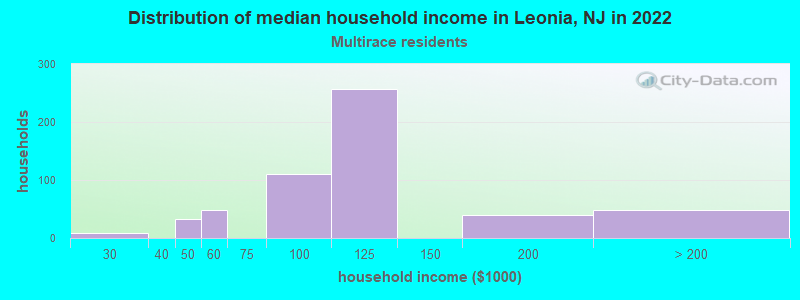
Income and house value in Leonia Median household income in 2022 $132,351 White non-Hispanic householders$98,411 Asian householders$99,735 Two or more races householders$109,126 Hispanic or Latino race householdersMedian 2022 house value $658,083 White Non-Hispanic householders $642,704 Asian householders$594,730 Some other race householders$631,227 Two or more races householders$587,844 Hispanic or Latino householders
Median age by race in Leonia
54.9 Median age for White residents48.7 60.9 51.4 Median age for Black or African American residents36.2 67.5 -766,197,182.3 Median age for American Indian / Alaska Native residents-686,322,685.6 -753,722,794.2 43.2 Median age for Asian residents40.0 44.5 -510,460,250.5 Median age for Native Hawaiian / Pacific Islander residents-514,767,932.0 -713,070,378.3 31.8 Median age for Other race residents31.5 38.0 39.4 Median age for Two or more races residents59.5 38.1 55.0 Median age for White alone residents52.0 59.1 39.7 Median age for Hispanic or Latino residents43.7 36.4
Owner/renter occupied households by race in Leonia
House owners and renters - White residents 1,235 79.9% Owner occupied312 20.1% Renter occupiedHouse owners and renters - Black or African American residents 49 56.6% Owner occupied37 43.4% Renter occupiedHouse owners and renters - Asian residents 678 57.4% Owner occupied503 42.6% Renter occupiedHouse owners and renters - Native Hawaiian / Pacific Islander residents 21 100.0% Renter occupiedHouse owners and renters - Other race residents 119 51.2% Owner occupied114 48.8% Renter occupiedHouse owners and renters - Two or more races residents 322 61.7% Owner occupied200 38.3% Renter occupiedHouse owners and renters - White alone residents 1,085 80.7% Owner occupied260 19.3% Renter occupiedHouse owners and renters - Hispanic or Latino residents 493 74.0% Owner occupied174 26.0% Renter occupied
Language usage in Leonia
English speakers - Total 45.6% of residents of Leonia speak English at home.
15.7% of residents speak Spanish at home 877 63.7% Speak English very well499 36.3% Speak English less than very well39.0% of residents speak other language at home 1,790 52.6% Speak English very well1,615 47.4% Speak English less than very well
English speakers - Born in the United States 69.9% of residents of Leonia speak English at home.
16.5% of residents speak Spanish at home 290 74.0% Speak English very well102 26.0% Speak English less than very well15.5% of residents speak other language at home 362 98.4% Speak English very well6 1.6% Speak English less than very well
English speakers - Native, born elsewhere 71.2% of residents of Leonia speak English at home.
4.0% of residents speak Spanish at home 7 58.3% Speak English very well5 41.7% Speak English less than very well18.5% of residents speak other language at home 32 57.1% Speak English very well24 42.9% Speak English less than very well
English speakers - Foreign-born 16.0% of residents of Leonia speak English at home.
20.0% of residents speak Spanish at home 437 52.8% Speak English very well391 47.2% Speak English less than very well63.3% of residents speak other language at home 1,096 41.9% Speak English very well1,521 58.1% Speak English less than very well
White (Caucasian) - Speak only English Native:
90.0% (2,345)Foreign-born:
42.7% (288)
White (Caucasian) - Speak another language Native:
10.1% (262)Foreign-born:
62.2% (419)
Black or African American - Speak only English Native:
99.9% (154)Foreign-born:
76.3% (29)
Asian - Speak only English Native:
32.6% (289)Foreign-born:
8.0% (194)
Asian - Speak another language Native:
66.8% (593)Foreign-born:
92.1% (2,230)
Other race - Speak only English Native:
11.3% (15)Foreign-born:
15.8% (41)
Other race - Speak another language Native:
93.2% (124)Foreign-born:
77.1% (201)
Two or more races - Speak only English Native:
64.3% (587)Foreign-born:
15.0% (135)
Two or more races - Speak another language Native:
34.9% (318)Foreign-born:
84.5% (760)
White alone - Speak only English Native:
94.8% (2,263)Foreign-born:
40.4% (197)
White alone - Speak another language Native:
5.4% (129)Foreign-born:
58.9% (287)
Hispanic or Latino - Speak only English Native:
44.2% (423)Foreign-born:
19.3% (204)
Hispanic or Latino - Speak another language Native:
54.6% (523)Foreign-born:
82.3% (867)
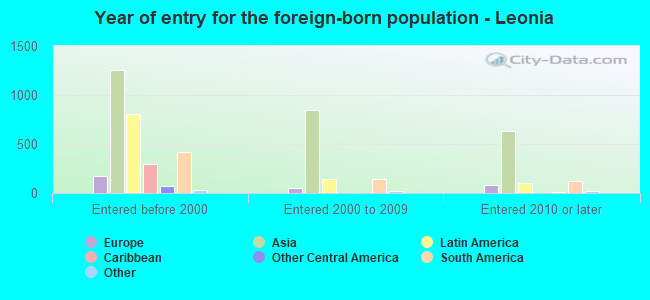
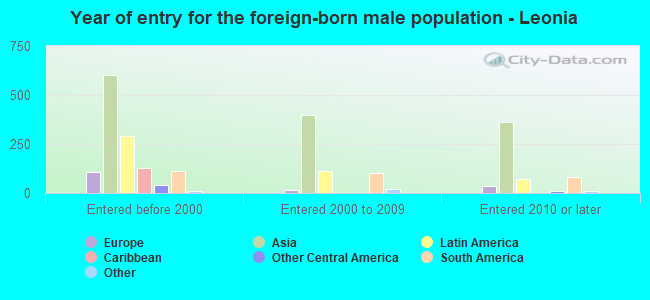
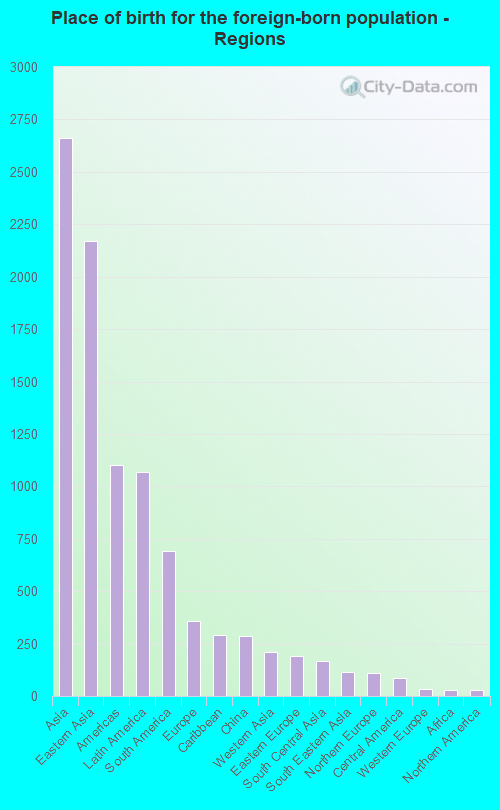
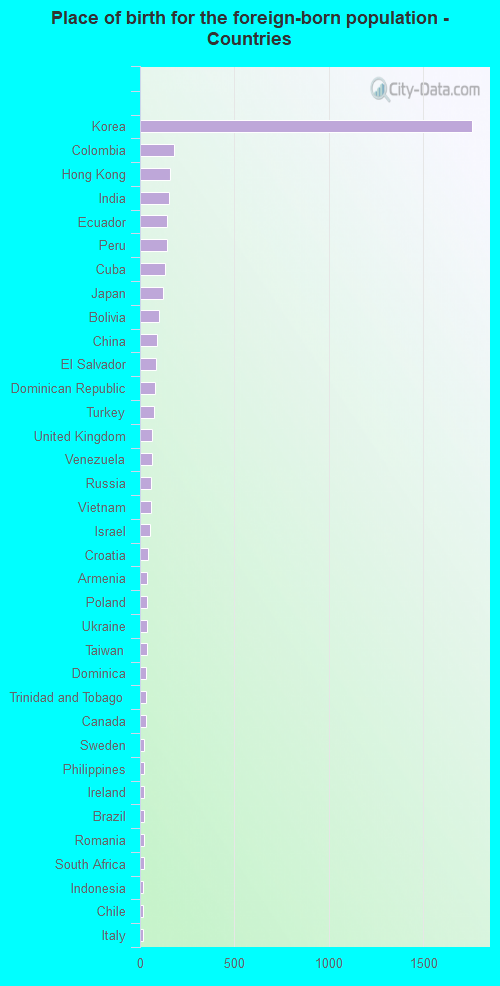
Foreign-born residents in Leonia 4,153 residents are foreign born (28.0% Asia , 11.3% Latin America ).
This city:
44.8%New Jersey:
23.2%
Marital status for residents in Leonia Marital status - White (Caucasian) population 15 years and over
Males 30.2% Never married55.2% Now married0.6% Separated5.3% Widowed8.7% DivorcedFemales 12.9% Never married64.2% Now married0.0% Separated10.1% Widowed12.8% DivorcedWomen who gave birth in the past 12 months Now married:
68.4% (21)Unmarried:
31.6% (10)
Women who did not give birth in the past 12 months Now married:
50.9% (164)Unmarried:
49.1% (158)
Marital status - Black or African American population 15 years and over
Males 39.8% Never married43.5% Now married0.0% Separated0.0% Widowed16.7% DivorcedFemales 20.2% Never married27.4% Now married0.0% Separated13.1% Widowed39.3% DivorcedWomen who did not give birth in the past 12 months Now married:
73.7% (14)Unmarried:
26.3% (5)
Marital status - Asian population 15 years and over
Males 25.9% Never married71.6% Now married0.0% Separated0.0% Widowed2.6% DivorcedFemales 22.8% Never married65.2% Now married3.4% Separated4.6% Widowed3.9% DivorcedWomen who gave birth in the past 12 months Now married:
100.0% (19)Unmarried:
0.0% (0)
Women who did not give birth in the past 12 months Now married:
59.8% (501)Unmarried:
40.2% (337)
Marital status - Other race population 15 years and over
Males 36.0% Never married53.5% Now married0.0% Separated0.0% Widowed10.5% DivorcedFemales 39.4% Never married40.4% Now married15.4% Separated0.0% Widowed4.8% DivorcedWomen who did not give birth in the past 12 months Now married:
48.9% (78)Unmarried:
51.1% (81)
Marital status - Two or more races population 15 years and over
Males 30.3% Never married67.9% Now married1.8% Separated0.0% Widowed0.0% DivorcedFemales 20.7% Never married76.1% Now married1.8% Separated0.0% Widowed1.3% DivorcedWomen who did not give birth in the past 12 months Now married:
58.5% (271)Unmarried:
41.5% (193)
Marital status - White alone, not Hispanic / Latino population 15 years and over
Males 27.0% Never married55.0% Now married0.8% Separated6.9% Widowed10.4% DivorcedFemales 10.8% Never married62.4% Now married0.0% Separated12.2% Widowed14.5% DivorcedWomen who gave birth in the past 12 months Now married:
68.4% (25)Unmarried:
31.6% (11)
Women who did not give birth in the past 12 months Now married:
54.2% (146)Unmarried:
45.8% (123)
Marital status - Hispanic or Latino population 15 years and over
Males 33.5% Never married62.7% Now married0.8% Separated0.0% Widowed2.9% DivorcedFemales 14.6% Never married80.4% Now married2.0% Separated0.0% Widowed3.0% DivorcedWomen who did not give birth in the past 12 months Now married:
65.7% (260)Unmarried:
34.3% (136)
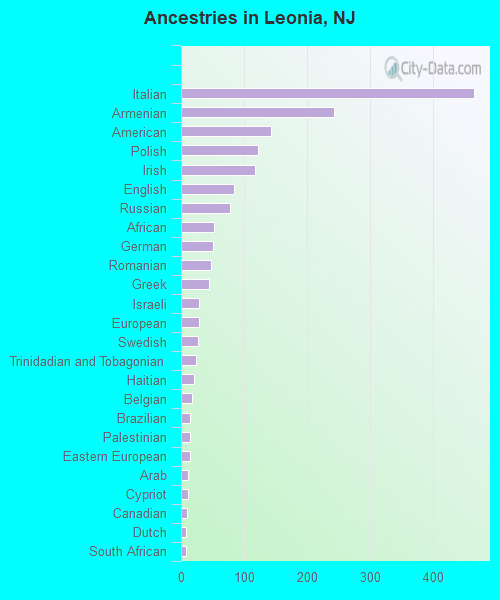
Ancestries in Leonia
465 8.4% Italian242 4.4% Armenian142 2.6% American122 2.2% Polish118 2.1% Irish84 1.5% English77 1.4% Russian52 0.9% African51 0.9% German47 0.9% Romanian45 0.8% Greek29 0.5% Israeli28 0.5% European27 0.5% Swedish24 0.4% Trinidadian and Tobagonian20 0.4% Haitian18 0.3% Belgian15 0.3% Brazilian14 0.3% Palestinian14 0.3% Eastern European11 0.2% Arab11 0.2% Cypriot10 0.2% Canadian8 0.1% Dutch8 0.1% South African7 0.1% Macedonian7 0.1% Scottish6 0.1% Lebanese6 0.1% Ukrainian5 0.09% Iranian5 0.09% French5 0.09% Scotch-Irish4 0.07% French Canadian
Children Nativity (place of birth) in Leonia
Children under 6 years - Living with two parents Both parents native 44 100.0% NativeBoth parents foreign-born 143 78.7% Native39 21.3% Foreign-bornOne native, one foreign-born parent 129 100.0% NativeChildren under 6 years - Living with one parent Native parent 213 100.0% NativeForeign-born parent 24 100.0% NativeChildren 6 to 17 years - Living with two parents Both parents native 197 95.6% Native9 4.4% Foreign-bornBoth parents foreign-born 570 83.1% Native116 16.9% Foreign-bornOne native, one foreign-born parent 145 100.0% NativeChildren 6 to 17 years - Living with one parent Native parent 214 100.0% NativeForeign-born parent 64 49.5% Native66 50.5% Foreign-born