Races in Lincoln Park, Michigan (MI) Detailed Stats
Data:
Races - White alone (%)
Races - White alone (% change since 2000)
Races - Black alone (%)
Races - Black alone (% change since 2000)
Races - American Indian alone (%)
Races - American Indian alone (% change since 2000)
Races - Asian alone (%)
Races - Asian alone (% change since 2000)
Races - Hispanic (%)
Races - Hispanic (% change since 2000)
Races - Native Hawaiian and Other Pacific Islander alone (%)
Races - Native Hawaiian and Other Pacific Islander alone (% change since 2000)
Races - Two or more races(%)
Races - Two or more races(% change since 2000)
Races - Other race alone (%)
Races - Other race alone (% change since 2000)
Racial diversity
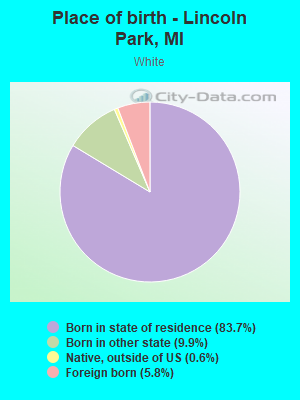
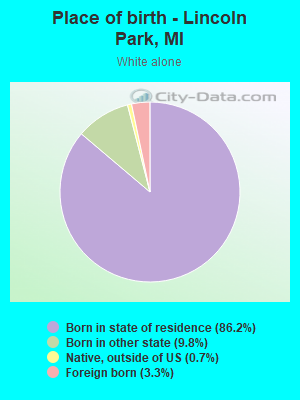
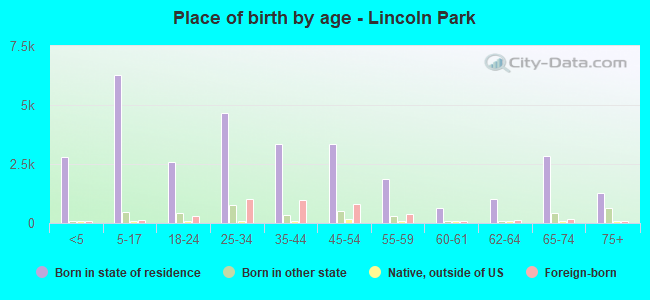
Place of birth - Born in state of residence (%)
Place of birth - Born in state of residence (%) - White
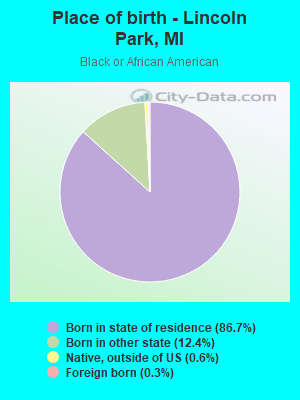
Place of birth - Born in state of residence (%) - Black or African American
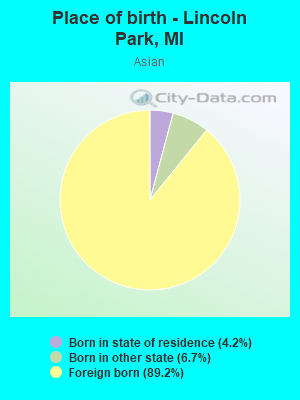
Place of birth - Born in state of residence (%) - Asian
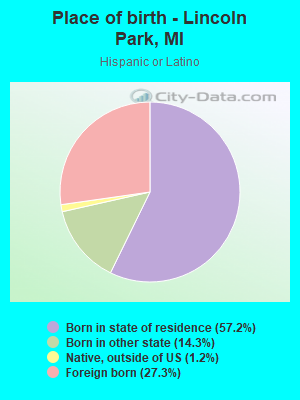
Place of birth - Born in state of residence (%) - Hispanic or Latino
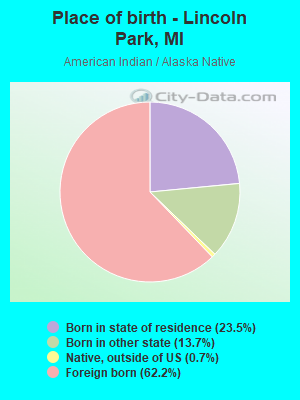
Place of birth - Born in state of residence (%) - American Indian and Alaska Native
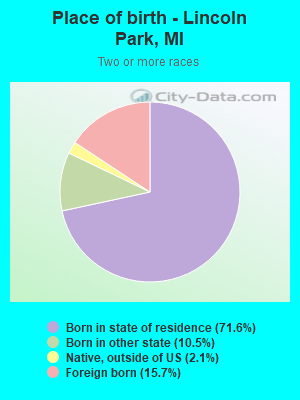
Place of birth - Born in state of residence (%) - Multirace
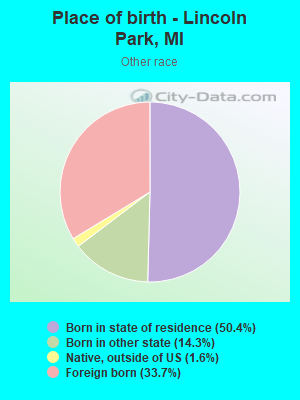
Place of birth - Born in state of residence (%) - Other Race
Place of birth - Born in other state (%)
Place of birth - Born in other state (%) - White
Place of birth - Born in other state (%) - Black or African American
Place of birth - Born in other state (%) - Asian
Place of birth - Born in other state (%) - Hispanic or Latino
Place of birth - Born in other state (%) - American Indian and Alaska Native
Place of birth - Born in other state (%) - Multirace
Place of birth - Born in other state (%) - Other Race
Place of birth - Native, outside of US (%)
Place of birth - Native, outside of US (%) - White
Place of birth - Native, outside of US (%) - Black or African American
Place of birth - Native, outside of US (%) - Asian
Place of birth - Native, outside of US (%) - Hispanic or Latino
Place of birth - Native, outside of US (%) - American Indian and Alaska Native
Place of birth - Native, outside of US (%) - Multirace
Place of birth - Native, outside of US (%) - Other Race
Place of birth - Foreign born (%)
Place of birth - Foreign born (%) - White
Place of birth - Foreign born (%) - Black or African American
Place of birth - Foreign born (%) - Asian
Place of birth - Foreign born (%) - Hispanic or Latino
Place of birth - Foreign born (%) - American Indian and Alaska Native
Place of birth - Foreign born (%) - Multirace
Place of birth - Foreign born (%) - Other Race
Residents speaking English at home (%)
Residents speaking English at home - Born in the United States (%)
Residents speaking English at home - Native, born elsewhere (%)
Residents speaking English at home - Foreign born (%)
Residents speaking Spanish at home (%)
Residents speaking Spanish at home - Born in the United States (%)
Residents speaking Spanish at home - Native, born elsewhere (%)
Residents speaking Spanish at home - Foreign born (%)
Residents speaking other language at home (%)
Residents speaking other language at home - Born in the United States (%)
Residents speaking other language at home - Native, born elsewhere (%)
Residents speaking other language at home - Foreign born (%)
Marital status - Never married (%)
Marital status - Now married (%)
Marital status - Separated (%)
Marital status - Widowed (%)
Marital status - Divorced (%)
Ancestries Reported - Arab (%)
Ancestries Reported - Czech (%)
Ancestries Reported - Danish (%)
Ancestries Reported - Dutch (%)
Ancestries Reported - English (%)
Ancestries Reported - French (%)
Ancestries Reported - French Canadian (%)
Ancestries Reported - German (%)
Ancestries Reported - Greek (%)
Ancestries Reported - Hungarian (%)
Ancestries Reported - Irish (%)
Ancestries Reported - Italian (%)
Ancestries Reported - Lithuanian (%)
Ancestries Reported - Norwegian (%)
Ancestries Reported - Polish (%)
Ancestries Reported - Portuguese (%)
Ancestries Reported - Russian (%)
Ancestries Reported - Scotch-Irish (%)
Ancestries Reported - Scottish (%)
Ancestries Reported - Slovak (%)
Ancestries Reported - Subsaharan African (%)
Ancestries Reported - Swedish (%)
Ancestries Reported - Swiss (%)
Ancestries Reported - Ukrainian (%)
Ancestries Reported - United States (%)
Ancestries Reported - Welsh (%)
Ancestries Reported - West Indian (%)
Ancestries Reported - Other (%)
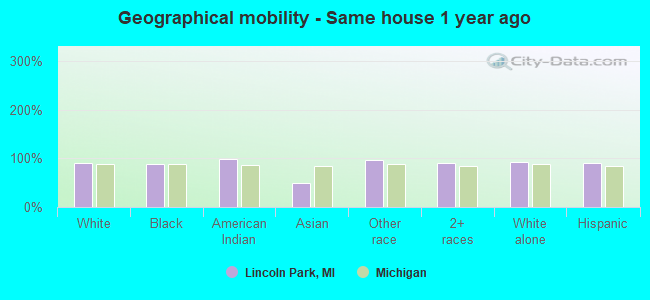
Geographical mobility - Same house 1 year ago (%)
Geographical mobility - Same house 1 year ago (%) - White
Geographical mobility - Same house 1 year ago (%) - Black or African American
Geographical mobility - Same house 1 year ago (%) - Asian
Geographical mobility - Same house 1 year ago (%) - Hispanic or Latino
Geographical mobility - Same house 1 year ago (%) - American Indian and Alaska Native
Geographical mobility - Same house 1 year ago (%) - Multirace
Geographical mobility - Same house 1 year ago (%) - Other Race
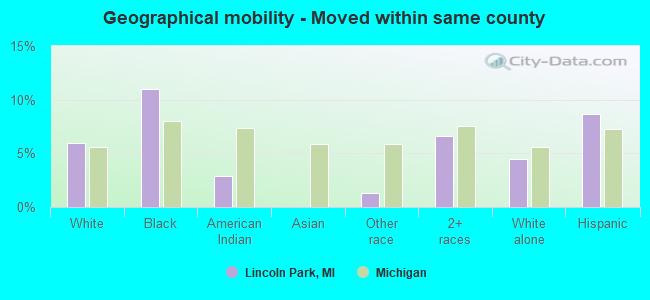
Geographical mobility - Moved within same county (%)
Geographical mobility - Moved within same county (%) - White
Geographical mobility - Moved within same county (%) - Black or African American
Geographical mobility - Moved within same county (%) - Asian
Geographical mobility - Moved within same county (%) - Hispanic or Latino
Geographical mobility - Moved within same county (%) - American Indian and Alaska Native
Geographical mobility - Moved within same county (%) - Multirace
Geographical mobility - Moved within same county (%) - Other Race
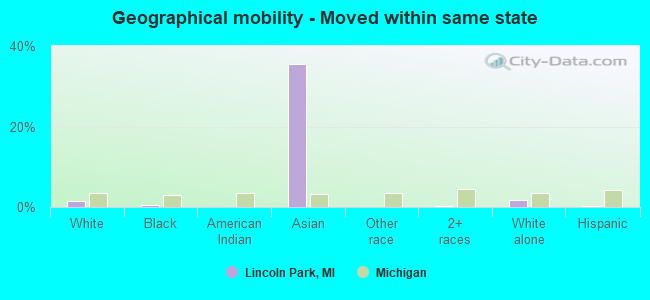
Geographical mobility - Moved from different county within same state (%)
Geographical mobility - Moved from different county within same state (%) - White
Geographical mobility - Moved from different county within same state (%) - Black or African American
Geographical mobility - Moved from different county within same state (%) - Asian
Geographical mobility - Moved from different county within same state (%) - Hispanic or Latino
Geographical mobility - Moved from different county within same state (%) - American Indian and Alaska Native
Geographical mobility - Moved from different county within same state (%) - Multirace
Geographical mobility - Moved from different county within same state (%) - Other Race
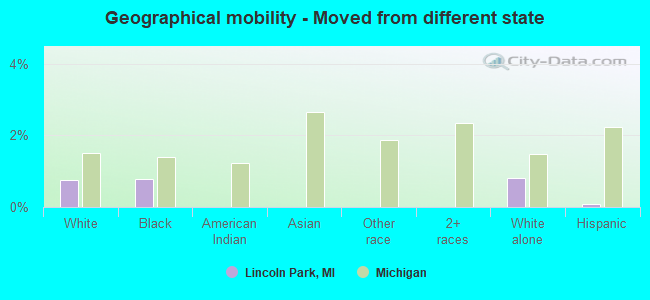
Geographical mobility - Moved from different state (%)
Geographical mobility - Moved from different state (%) - White
Geographical mobility - Moved from different state (%) - Black or African American
Geographical mobility - Moved from different state (%) - Asian
Geographical mobility - Moved from different state (%) - Hispanic or Latino
Geographical mobility - Moved from different state (%) - American Indian and Alaska Native
Geographical mobility - Moved from different state (%) - Multirace
Geographical mobility - Moved from different state (%) - Other Race
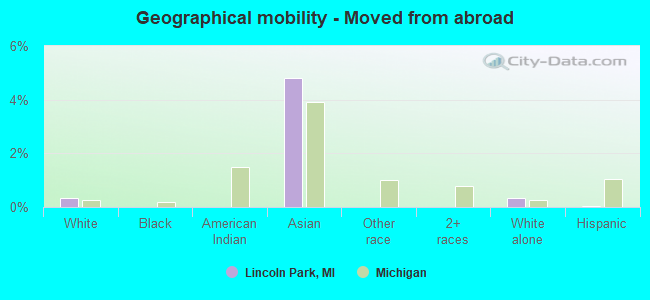
Geographical mobility - Moved from abroad (%)
Geographical mobility - Moved from abroad (%) - White
Geographical mobility - Moved from abroad (%) - Black or African American
Geographical mobility - Moved from abroad (%) - Asian
Geographical mobility - Moved from abroad (%) - Hispanic or Latino
Geographical mobility - Moved from abroad (%) - American Indian and Alaska Native
Geographical mobility - Moved from abroad (%) - Multirace
Geographical mobility - Moved from abroad (%) - Other Race
Place of birth for the foreign-born population - Ireland (%)
Place of birth for the foreign-born population - Denmark (%)
Place of birth for the foreign-born population - Norway (%)
Place of birth for the foreign-born population - Sweden (%)
Place of birth for the foreign-born population - United Kingdom (%)
Place of birth for the foreign-born population - England (%)
Place of birth for the foreign-born population - Scotland (%)
Place of birth for the foreign-born population - Other Northern Europe (%)
Place of birth for the foreign-born population - Austria (%)
Place of birth for the foreign-born population - Belgium (%)
Place of birth for the foreign-born population - France (%)
Place of birth for the foreign-born population - Germany (%)
Place of birth for the foreign-born population - Netherlands (%)
Place of birth for the foreign-born population - Switzerland (%)
Place of birth for the foreign-born population - Other Western Europe (%)
Place of birth for the foreign-born population - Greece (%)
Place of birth for the foreign-born population - Italy (%)
Place of birth for the foreign-born population - Portugal (%)
Place of birth for the foreign-born population - Spain (%)
Place of birth for the foreign-born population - Other Southern Europe (%)
Place of birth for the foreign-born population - Albania (%)
Place of birth for the foreign-born population - Belarus (%)
Place of birth for the foreign-born population - Bosnia and Herzegovina (%)
Place of birth for the foreign-born population - Bulgaria (%)
Place of birth for the foreign-born population - Croatia (%)
Place of birth for the foreign-born population - Czechoslovakia (%)
Place of birth for the foreign-born population - Hungary (%)
Place of birth for the foreign-born population - Latvia (%)
Place of birth for the foreign-born population - Lithuania (%)
Place of birth for the foreign-born population - North Macedonia (Macedonia) (%)
Place of birth for the foreign-born population - Moldova (%)
Place of birth for the foreign-born population - Poland (%)
Place of birth for the foreign-born population - Romania (%)
Place of birth for the foreign-born population - Russia (%)
Place of birth for the foreign-born population - Serbia (%)
Place of birth for the foreign-born population - Ukraine (%)
Place of birth for the foreign-born population - Other Eastern Europe (%)
Place of birth for the foreign-born population - China (%)
Place of birth for the foreign-born population - Hong Kong (%)
Place of birth for the foreign-born population - Taiwan (%)
Place of birth for the foreign-born population - Japan (%)
Place of birth for the foreign-born population - Korea (%)
Place of birth for the foreign-born population - Other Eastern Asia (%)
Place of birth for the foreign-born population - Afghanistan (%)
Place of birth for the foreign-born population - Bangladesh (%)
Place of birth for the foreign-born population - India (%)
Place of birth for the foreign-born population - Iran (%)
Place of birth for the foreign-born population - Kazakhstan (%)
Place of birth for the foreign-born population - Nepal (%)
Place of birth for the foreign-born population - Pakistan (%)
Place of birth for the foreign-born population - Sri Lanka (%)
Place of birth for the foreign-born population - Uzbekistan (%)
Place of birth for the foreign-born population - Other South Central Asia (%)
Place of birth for the foreign-born population - Burma (%)
Place of birth for the foreign-born population - Cambodia (%)
Place of birth for the foreign-born population - Indonesia (%)
Place of birth for the foreign-born population - Laos (%)
Place of birth for the foreign-born population - Malaysia (%)
Place of birth for the foreign-born population - Philippines (%)
Place of birth for the foreign-born population - Singapore (%)
Place of birth for the foreign-born population - Thailand (%)
Place of birth for the foreign-born population - Vietnam (%)
Place of birth for the foreign-born population - Other South Eastern Asia (%)
Place of birth for the foreign-born population - Armenia (%)
Place of birth for the foreign-born population - Iraq (%)
Place of birth for the foreign-born population - Israel (%)
Place of birth for the foreign-born population - Jordan (%)
Place of birth for the foreign-born population - Kuwait (%)
Place of birth for the foreign-born population - Lebanon (%)
Place of birth for the foreign-born population - Saudi Arabia (%)
Place of birth for the foreign-born population - Syria (%)
Place of birth for the foreign-born population - Turkey (%)
Place of birth for the foreign-born population - Yemen (%)
Place of birth for the foreign-born population - Other Western Asia (%)
Place of birth for the foreign-born population - Eritrea (%)
Place of birth for the foreign-born population - Ethiopia (%)
Place of birth for the foreign-born population - Kenya (%)
Place of birth for the foreign-born population - Somalia (%)
Place of birth for the foreign-born population - Uganda (%)
Place of birth for the foreign-born population - Zimbabwe (%)
Place of birth for the foreign-born population - Other Eastern Africa (%)
Place of birth for the foreign-born population - Cameroon (%)
Place of birth for the foreign-born population - Congo (%)
Place of birth for the foreign-born population - Democratic Republic of Congo (Zaire) (%)
Place of birth for the foreign-born population - Other Middle Africa (%)
Place of birth for the foreign-born population - Egypt (%)
Place of birth for the foreign-born population - Morocco (%)
Place of birth for the foreign-born population - Sudan (%)
Place of birth for the foreign-born population - Other Northern Africa (%)
Place of birth for the foreign-born population - South Africa (%)
Place of birth for the foreign-born population - Other Southern Africa (%)
Place of birth for the foreign-born population - Cabo Verde (%)
Place of birth for the foreign-born population - Ghana (%)
Place of birth for the foreign-born population - Liberia (%)
Place of birth for the foreign-born population - Nigeria (%)
Place of birth for the foreign-born population - Senegal (%)
Place of birth for the foreign-born population - Sierra Leone (%)
Place of birth for the foreign-born population - Other Western Africa (%)
Place of birth for the foreign-born population - Australia (%)
Place of birth for the foreign-born population - New Zealand (%)
Place of birth for the foreign-born population - Fiji (%)
Place of birth for the foreign-born population - Micronesia (%)
Place of birth for the foreign-born population - Bahamas (%)
Place of birth for the foreign-born population - Barbados (%)
Place of birth for the foreign-born population - Cuba (%)
Place of birth for the foreign-born population - Dominica (%)
Place of birth for the foreign-born population - Dominican Republic (%)
Place of birth for the foreign-born population - Grenada (%)
Place of birth for the foreign-born population - Haiti (%)
Place of birth for the foreign-born population - Jamaica (%)
Place of birth for the foreign-born population - St. Vincent and the Grenadines (%)
Place of birth for the foreign-born population - Trinidad and Tobago (%)
Place of birth for the foreign-born population - West Indies (%)
Place of birth for the foreign-born population - Other Caribbean (%)
Place of birth for the foreign-born population - Belize (%)
Place of birth for the foreign-born population - Costa Rica (%)
Place of birth for the foreign-born population - El Salvador (%)
Place of birth for the foreign-born population - Guatemala (%)
Place of birth for the foreign-born population - Honduras (%)
Place of birth for the foreign-born population - Mexico (%)
Place of birth for the foreign-born population - Nicaragua (%)
Place of birth for the foreign-born population - Panama (%)
Place of birth for the foreign-born population - Other Central America (%)
Place of birth for the foreign-born population - Argentina (%)
Place of birth for the foreign-born population - Bolivia (%)
Place of birth for the foreign-born population - Brazil (%)
Place of birth for the foreign-born population - Chile (%)
Place of birth for the foreign-born population - Colombia (%)
Place of birth for the foreign-born population - Ecuador (%)
Place of birth for the foreign-born population - Guyana (%)
Place of birth for the foreign-born population - Peru (%)
Place of birth for the foreign-born population - Uruguay (%)
Place of birth for the foreign-born population - Venezuela (%)
Place of birth for the foreign-born population - Other South America (%)
Place of birth for the foreign-born population - Canada (%)
Place of birth for the foreign-born population - Other Northern America (%)
Place of birth for the foreign-born population - Other (%)
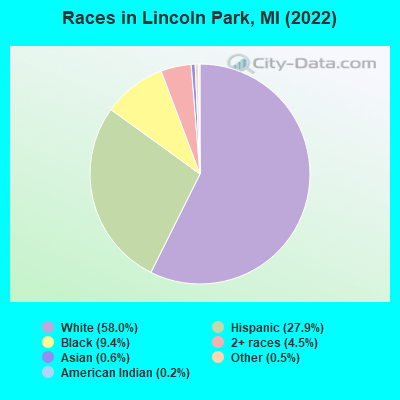
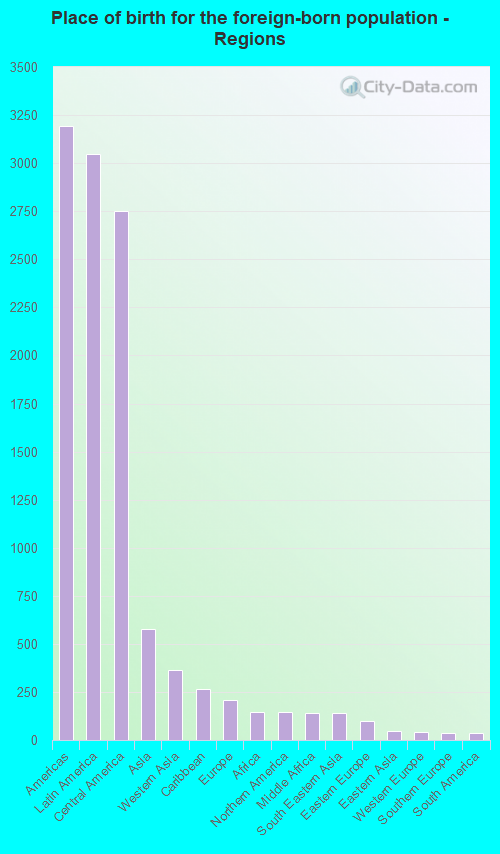
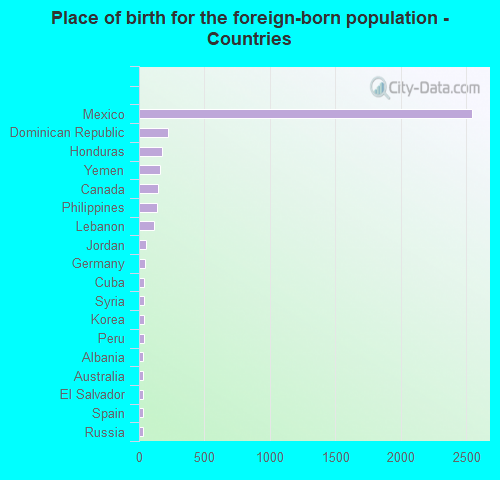
According to 2022 data, the most numerous races in Lincoln Park, MI are White alone (22,780 residents), Black alone (3,672 residents), and Hispanic (10,949 residents). 78.0% of Lincoln Park residents speak English at home. 10.6% of Lincoln Park, MI residents are foreign-born (7.7% born in Latin America, 1.5% born in Asia), which is 43.4% greater than the foreign-born rate of 6.0% across the entire state of Michigan.
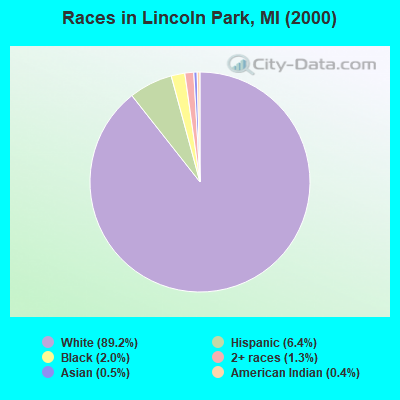
Race distribution in Lincoln Park
2000 2022
7,806,691 78.6% White alone 1,402,047 14.1% Black alone 323,877 3.3% Hispanic 175,311 1.8% Asian alone 163,487 1.6% Two or more races 53,421 0.5% American Indian alone 11,465 0.1% Other race alone 2,145 0.02% Native Hawaiian and Other
7,289,051 72.6% White alone 1,310,464 13.1% Black alone 572,405 5.7% Hispanic 450,031 4.5% Two or more races 335,732 3.3% Asian alone 45,217 0.5% Other race alone 29,011 0.3% American Indian alone 2,207 0.02% Native Hawaiian and Other
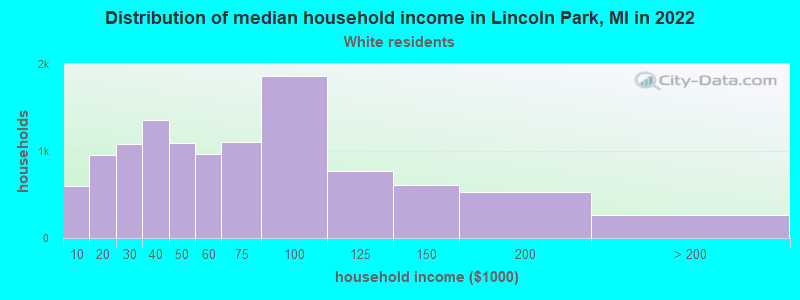
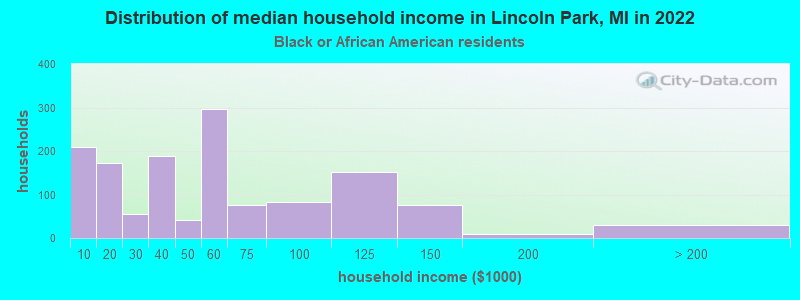
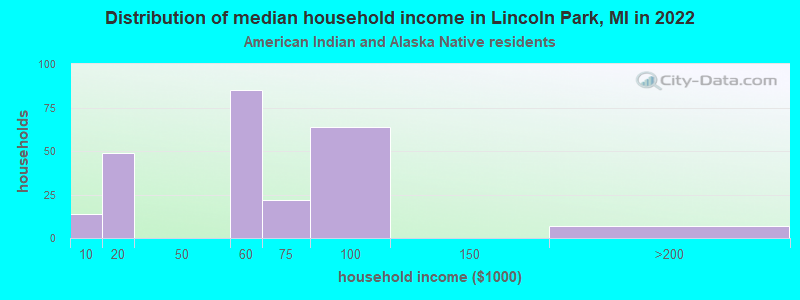
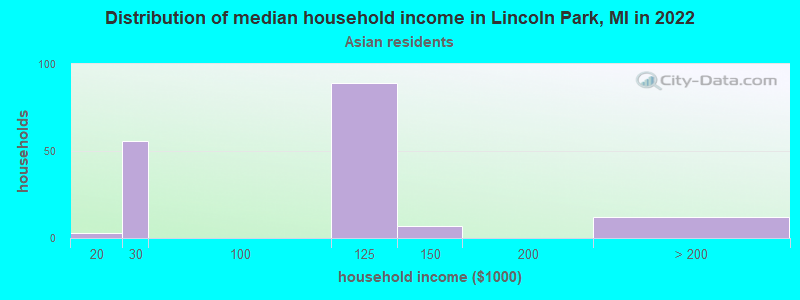
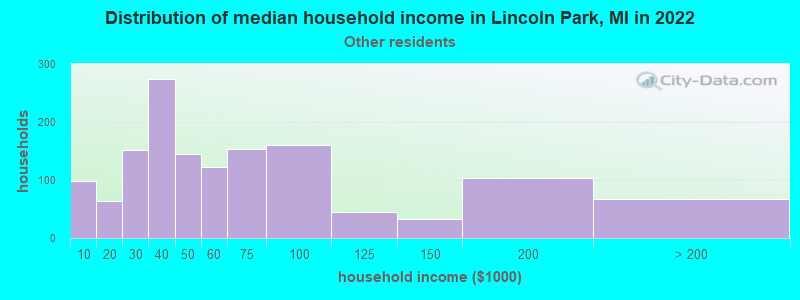
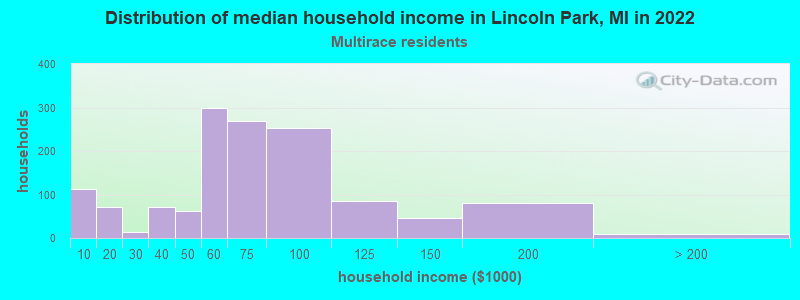
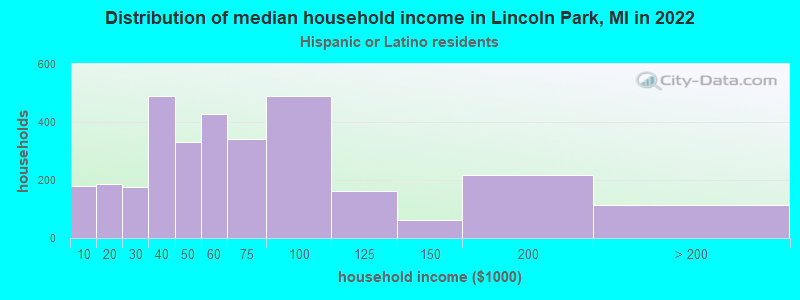
Income and house value in Lincoln Park Median household income in 2022 $53,292 White non-Hispanic householders$50,886 Black householders$57,287 American Indian and Alaska Native householders$89,381 Asian householders$49,539 Some other race householders$59,498 Two or more races householders$55,566 Hispanic or Latino race householdersMedian 2022 house value $119,644 White Non-Hispanic householders$119,929 Black or African American householders$72,529 American Indian or Alaska Native householders $117,788 Asian householders$117,217 Some other race householders$126,069 Two or more races householders$130,209 Hispanic or Latino householders
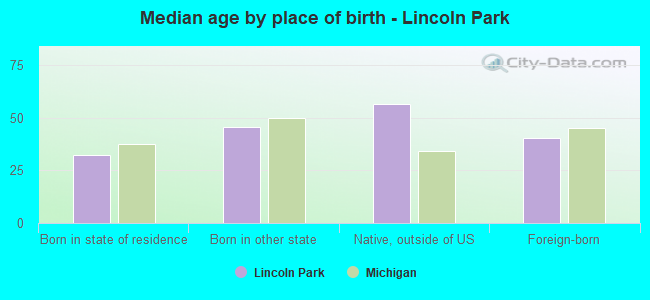
Median age by race in Lincoln Park
40.5 Median age for White residents39.1 41.8 30.8 Median age for Black or African American residents30.9 30.8 38.3 Median age for American Indian / Alaska Native residents48.1 26.4 38.6 Median age for Asian residents51.8 39.9 -934,108,526.2 Median age for Native Hawaiian / Pacific Islander residents-674,772,035.8 -699,588,476.7 26.4 Median age for Other race residents25.6 27.9 26.2 Median age for Two or more races residents21.5 29.3 43.1 Median age for White alone residents41.0 46.0 27.2 Median age for Hispanic or Latino residents26.7 27.8
Owner/renter occupied households by race in Lincoln Park
House owners and renters - White residents 8,402 75.7% Owner occupied2,700 24.3% Renter occupiedHouse owners and renters - Black or African American residents 443 33.0% Owner occupied899 67.0% Renter occupiedHouse owners and renters - American Indian / Alaska Native residents 134 54.1% Owner occupied113 45.9% Renter occupiedHouse owners and renters - Asian residents 179 93.4% Owner occupied13 6.6% Renter occupiedHouse owners and renters - Other race residents 1,118 78.8% Owner occupied301 21.2% Renter occupiedHouse owners and renters - Two or more races residents 938 72.1% Owner occupied363 27.9% Renter occupiedHouse owners and renters - White alone residents 7,752 75.4% Owner occupied2,527 24.6% Renter occupiedHouse owners and renters - Hispanic or Latino residents 2,396 76.9% Owner occupied721 23.1% Renter occupied
Language usage in Lincoln Park
English speakers - Total 78.0% of residents of Lincoln Park speak English at home.
18.9% of residents speak Spanish at home 4,365 63.6% Speak English very well2,503 36.4% Speak English less than very well2.8% of residents speak other language at home 735 71.3% Speak English very well296 28.7% Speak English less than very well
English speakers - Born in the United States 72.3% of residents of Lincoln Park speak English at home.
32.8% of residents speak Spanish at home 941 71.5% Speak English very well375 28.5% Speak English less than very well0.2% of residents speak other language at home 7 100.0% Speak English very well
English speakers - Native, born elsewhere 62.9% of residents of Lincoln Park speak English at home.
34.4% of residents speak Spanish at home 71 61.2% Speak English very well45 38.8% Speak English less than very well11.0% of residents speak other language at home 37 100.0% Speak English very well
English speakers - Foreign-born 9.6% of residents of Lincoln Park speak English at home.
66.5% of residents speak Spanish at home 1,234 43.9% Speak English very well1,579 56.1% Speak English less than very well16.3% of residents speak other language at home 409 59.2% Speak English very well282 40.8% Speak English less than very well
White (Caucasian) - Speak only English Native:
95.2% (21,050)Foreign-born:
20.3% (299)
White (Caucasian) - Speak another language Native:
5.2% (1,157)Foreign-born:
79.8% (1,176)
Black or African American - Speak another language Native:
1.1% (39)Foreign-born:
96.9% (10)
American Indian / Alaska Native - Speak another language Native:
63.4% (160)Foreign-born:
100.0% (467)
Asian - Speak only English Native:
94.1% (25)Foreign-born:
24.1% (50)
Other race - Speak only English Native:
28.2% (808)Foreign-born:
1.4% (23)
Other race - Speak another language Native:
73.7% (2,109)Foreign-born:
100.0% (1,720)
Two or more races - Speak only English Native:
66.8% (2,614)Foreign-born:
4.7% (36)
Two or more races - Speak another language Native:
35.6% (1,395)Foreign-born:
97.2% (745)
White alone - Speak only English Native:
98.5% (20,365)Foreign-born:
24.9% (187)
White alone - Speak another language Native:
1.9% (403)Foreign-born:
74.7% (559)
Hispanic or Latino - Speak only English Native:
38.8% (2,599)Foreign-born:
3.9% (113)
Hispanic or Latino - Speak another language Native:
61.8% (4,145)Foreign-born:
96.6% (2,831)
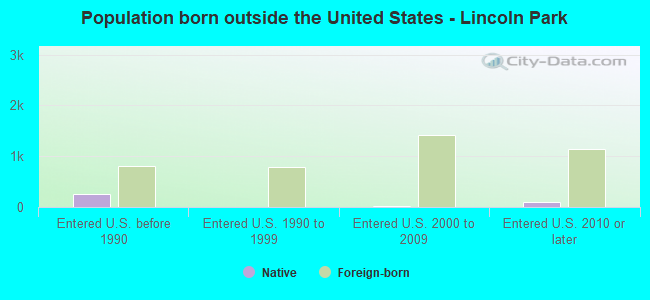
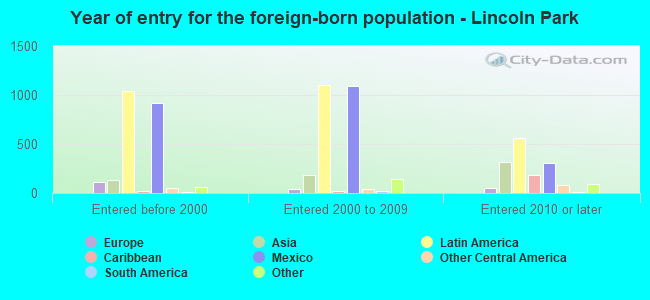
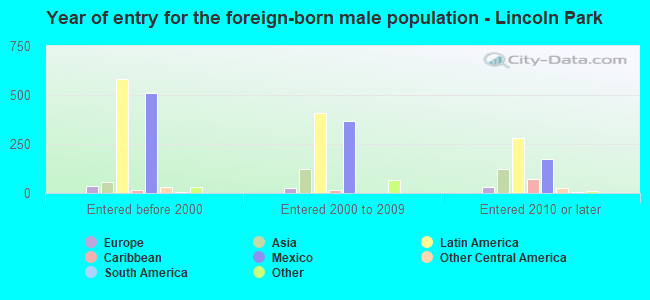
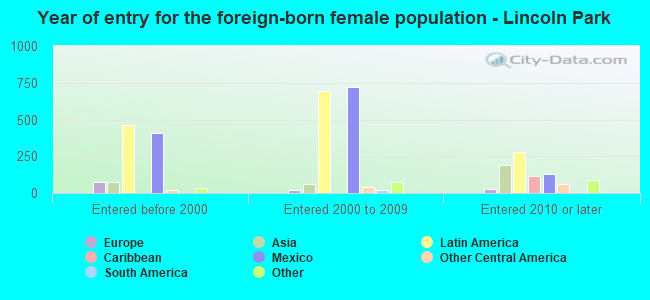
Foreign-born residents in Lincoln Park 4,158 residents are foreign born (7.7% Latin America , 1.5% Asia ).
This city:
10.6%Michigan:
6.9%
Marital status for residents in Lincoln Park Marital status - White (Caucasian) population 15 years and over
Males 41.2% Never married40.0% Now married1.4% Separated2.6% Widowed14.7% DivorcedFemales 30.2% Never married40.1% Now married0.8% Separated11.4% Widowed17.6% DivorcedWomen who gave birth in the past 12 months Now married:
65.1% (118)Unmarried:
34.9% (63)
Women who did not give birth in the past 12 months Now married:
36.3% (1,762)Unmarried:
63.7% (3,094)
Marital status - Black or African American population 15 years and over
Males 66.0% Never married21.7% Now married1.0% Separated2.8% Widowed8.5% DivorcedFemales 52.0% Never married18.8% Now married5.2% Separated10.1% Widowed13.8% DivorcedWomen who gave birth in the past 12 months Now married:
79.4% (51)Unmarried:
20.6% (13)
Women who did not give birth in the past 12 months Now married:
25.7% (188)Unmarried:
74.3% (542)
Marital status - American Indian / Alaska Native population 15 years and over
Males 40.4% Never married46.0% Now married2.5% Separated3.7% Widowed7.5% DivorcedFemales 44.7% Never married24.6% Now married0.0% Separated5.6% Widowed25.0% DivorcedWomen who did not give birth in the past 12 months Now married:
25.9% (52)Unmarried:
74.1% (148)
Marital status - Asian population 15 years and over
Males 21.2% Never married51.9% Now married0.0% Separated0.0% Widowed26.9% DivorcedFemales 17.4% Never married13.6% Now married0.0% Separated7.1% Widowed62.0% DivorcedWomen who did not give birth in the past 12 months Now married:
9.3% (15)Unmarried:
90.7% (142)
Marital status - Other race population 15 years and over
Males 53.0% Never married41.4% Now married0.4% Separated1.2% Widowed4.0% DivorcedFemales 52.2% Never married41.5% Now married3.4% Separated0.2% Widowed2.7% DivorcedWomen who gave birth in the past 12 months Now married:
100.0% (53)Unmarried:
0.0% (0)
Women who did not give birth in the past 12 months Now married:
36.8% (510)Unmarried:
63.2% (878)
Marital status - Two or more races population 15 years and over
Males 51.2% Never married42.0% Now married0.0% Separated0.1% Widowed6.8% DivorcedFemales 45.2% Never married38.4% Now married2.1% Separated1.1% Widowed13.2% DivorcedWomen who gave birth in the past 12 months Now married:
100.0% (24)Unmarried:
0.0% (0)
Women who did not give birth in the past 12 months Now married:
37.5% (548)Unmarried:
62.5% (912)
Marital status - White alone, not Hispanic / Latino population 15 years and over
Males 40.2% Never married40.1% Now married1.4% Separated2.8% Widowed15.5% DivorcedFemales 30.3% Never married38.9% Now married0.6% Separated12.1% Widowed18.2% DivorcedWomen who gave birth in the past 12 months Now married:
79.5% (90)Unmarried:
20.5% (23)
Women who did not give birth in the past 12 months Now married:
33.4% (1,433)Unmarried:
66.6% (2,853)
Marital status - Hispanic or Latino population 15 years and over
Males 52.8% Never married40.9% Now married0.5% Separated0.9% Widowed4.9% DivorcedFemales 42.5% Never married44.5% Now married2.5% Separated1.6% Widowed8.8% DivorcedWomen who gave birth in the past 12 months Now married:
65.3% (84)Unmarried:
34.7% (44)
Women who did not give birth in the past 12 months Now married:
43.2% (1,216)Unmarried:
56.8% (1,601)
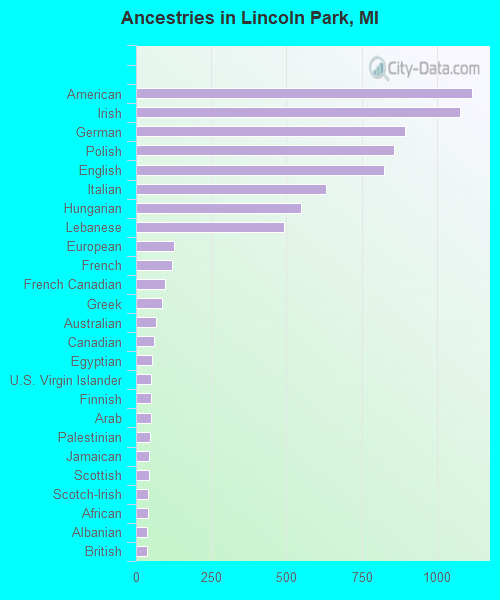
Ancestries in Lincoln Park
1,118 5.5% American1,078 5.3% Irish896 4.4% German858 4.2% Polish824 4.0% English631 3.1% Italian550 2.7% Hungarian493 2.4% Lebanese127 0.6% European120 0.6% French98 0.5% French Canadian87 0.4% Greek67 0.3% Australian59 0.3% Canadian54 0.3% Egyptian51 0.3% U.S. Virgin Islander50 0.2% Finnish50 0.2% Arab46 0.2% Palestinian44 0.2% Jamaican43 0.2% Scottish41 0.2% Scotch-Irish41 0.2% African38 0.2% Albanian37 0.2% British27 0.1% Slovak26 0.1% Portuguese23 0.1% Senegalese14 0.07% Russian13 0.06% Slavic11 0.05% Welsh9 0.04% Dutch9 0.04% Ethiopian8 0.04% Celtic8 0.04% Serbian7 0.03% Austrian7 0.03% German Russian6 0.03% Eastern European6 0.03% Romanian5 0.02% Armenian5 0.02% Ukrainian4 0.02% Lithuanian3 0.01% Maltese
Geographical mobility in Lincoln Park Same house 1 year ago 22,792 91.1% White (Caucasian)3,211 87.7% Black or African American578 98.9% American Indian / Alaska Native116 48.7% Asian4,822 95.6% Other race4,770 91.4% Two or more races20,972 92.6% White alone, not Hispanic / Latino9,723 89.8% Hispanic or LatinoMoved within same county 1,490 6.0% White / Caucasian402 11.0% Black or African American17 2.9% American Indian / Alaska Native65 1.3% Other race343 6.6% Two or more races1,006 4.4% White alone, not Hispanic / Latino942 8.7% Hispanic or LatinoMoved within same state 387 1.5% White / Caucasian15 0.4% Black or African American85 35.5% Asian19 0.4% Two or more races395 1.7% White alone, not Hispanic / Latino15 0.1% Hispanic or LatinoMoved from different state 192 0.8% White / Caucasian28 0.8% Black or African American183 0.8% White alone, not Hispanic / Latino9 0.1% Hispanic or LatinoMoved from abroad 80 0.3% White11 4.8% Asian75 0.3% White alone, not Hispanic / Latino4 0.0% Hispanic or Latino
Children Nativity (place of birth) in Lincoln Park
Children under 6 years - Living with two parents Both parents native 1,478 100.0% NativeBoth parents foreign-born 336 100.0% NativeOne native, one foreign-born parent 194 100.0% NativeChildren under 6 years - Living with one parent Native parent 1,165 100.0% NativeForeign-born parent 144 78.6% Native39 21.4% Foreign-bornChildren 6 to 17 years - Living with two parents Both parents native 1,718 99.8% Native3 0.2% Foreign-bornBoth parents foreign-born 914 93.3% Native66 6.7% Foreign-bornOne native, one foreign-born parent 308 100.0% NativeChildren 6 to 17 years - Living with one parent Native parent 2,433 100.0% NativeForeign-born parent 260 52.6% Native235 47.4% Foreign-born
Grandparents responsible for own grandchildren in Lincoln Park
Grandparents (30 to 59 years) White / Caucasian 84 52.0% Responsible for grandchildren77 48.0% Not responsible for grandchildrenBlack or African American 14 42.9% Responsible for grandchildren18 57.1% Not responsible for grandchildrenOther race 78 100.0% Responsible for grandchildrenTwo or more races 15 100.0% Responsible for grandchildrenWhite alone, not Hispanic / Latino 84 50.6% Responsible for grandchildren82 49.4% Not responsible for grandchildrenHispanic or Latino 32 100.0% Responsible for grandchildrenGrandparents (60 years and over) White / Caucasian 137 63.2% Responsible for grandchildren80 36.8% Not responsible for grandchildrenBlack or African American 98 100.0% Not responsible for grandchildrenOther race 16 30.5% Responsible for grandchildren37 69.5% Not responsible for grandchildrenTwo or more races 50 100.0% Not responsible for grandchildrenWhite alone, not Hispanic / Latino 128 63.0% Responsible for grandchildren75 37.0% Not responsible for grandchildrenHispanic or Latino 14 12.9% Responsible for grandchildren94 87.1% Not responsible for grandchildren