Races in Lincoln, Rhode Island (RI) Detailed Stats
Ancestries, Foreign-born residents, place of birth
7.5% of Lincoln, RI residents are foreign-born (3.3% born in Europe, 2.6% born in Asia), which is 86.5% less than the foreign-born rate of 14.0% across the entire state of Rhode Island.
Race distribution in Lincoln

- 19,73694.4%White alone
- 3661.8%Asian alone
- 3431.6%Hispanic
- 2061.0%Two or more races
- 1660.8%Black alone
- 640.3%Other race alone
- 150.07%American Indian alone
- 20.01%Native Hawaiian and Other
Pacific Islander alone
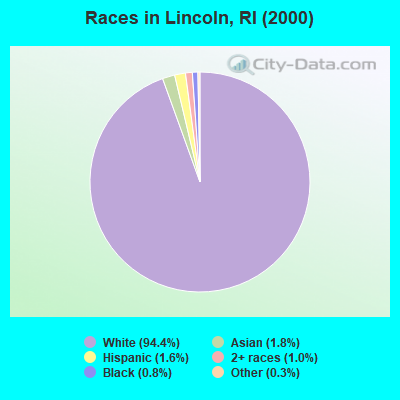
2000
2022
-
- 858,43381.9%White alone
- 90,8208.7%Hispanic
- 41,9224.0%Black alone
- 23,4162.2%Asian alone
- 20,8162.0%Two or more races
- 8,4110.8%Other race alone
- 4,1810.4%American Indian alone
- 3200.03%Native Hawaiian and Other
Pacific Islander alone

-
- 745,82568.2%White alone
- 191,97917.6%Hispanic
- 56,7385.2%Two or more races
- 51,3264.7%Black alone
- 37,2343.4%Asian alone
- 9,5140.9%Other race alone
- 9780.09%American Indian alone
- 1400.01%Native Hawaiian and Other
Pacific Islander alone

Income and house value in Lincoln
- Median household income in 2022
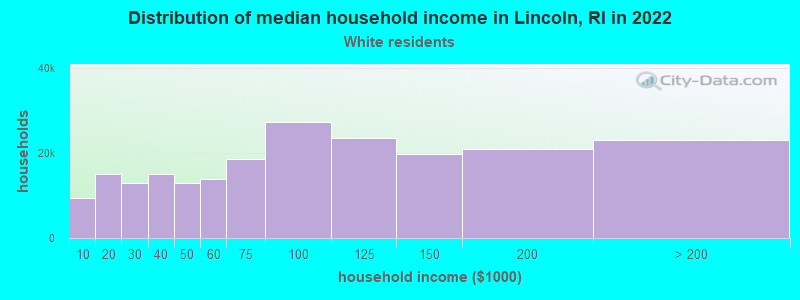
- $94,220White non-Hispanic householders
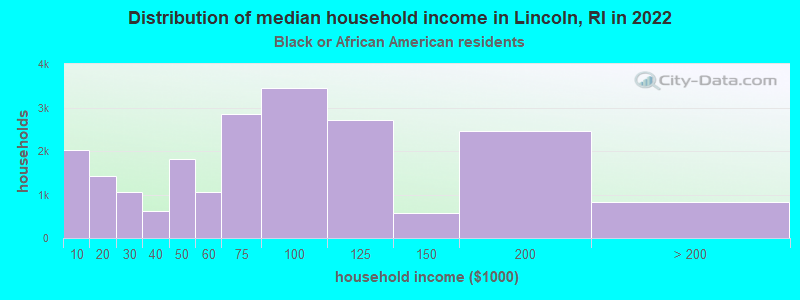
- $90,159Black householders
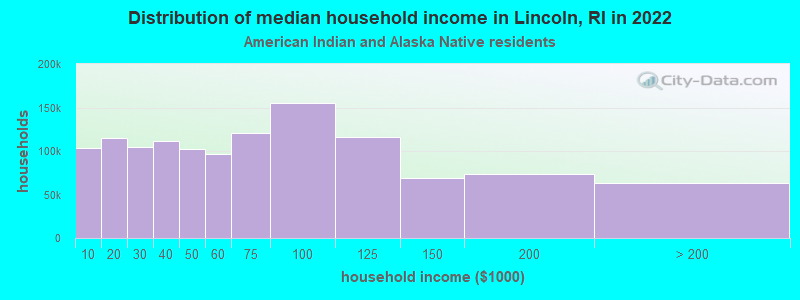
- $174,917American Indian and Alaska Native householders
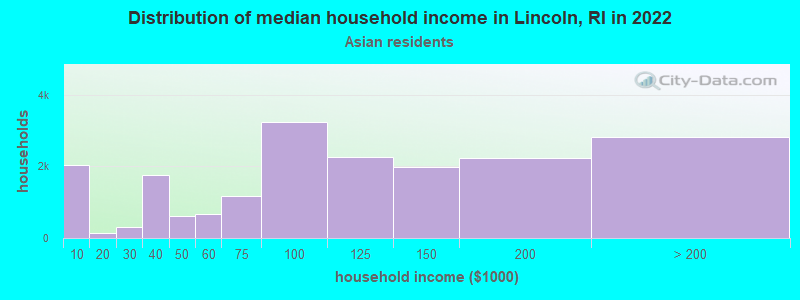
- $198,539Asian householders
- $129,804Some other race householders
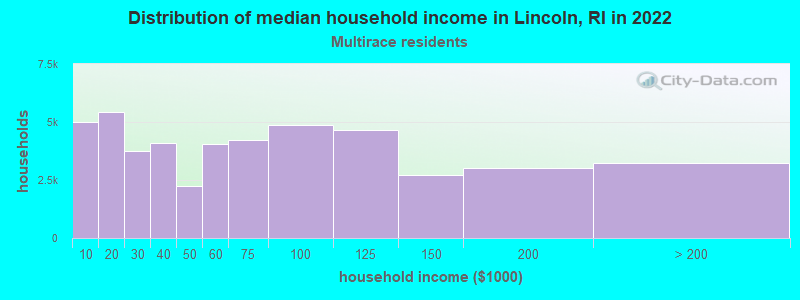
- $85,765Two or more races householders
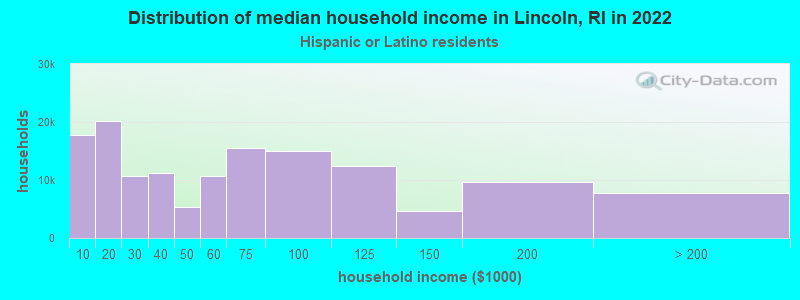
- $147,239Hispanic or Latino race householders
- Median 2022 house value
- $472,530White Non-Hispanic householders
- $332,248Black or African American householders
- $191,965American Indian or Alaska Native householders
- $793,851Asian householders
- $280,565Some other race householders
- $437,681Two or more races householders
- $332,248Hispanic or Latino householders
Household income for White non-Hispanic householders
Household income for Black householders
Household income for American Indian and Alaska Native householders
Household income for Asian householders
Household income for Two or more races householders
Household income for Hispanic or Latino race householders
Foreign-born residents in Lincoln
1,569 residents are foreign born (3.3% Europe, 2.6% Asia).
| This city: | 7.5% |
| Rhode Island: | 11.4% |
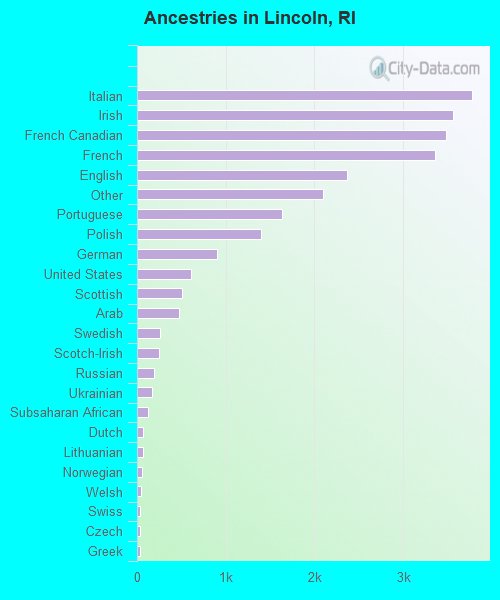
Ancestries in Lincoln

- 3,77914.8%Italian
- 3,56113.9%Irish
- 3,48513.6%French Canadian
- 3,36213.2%French
- 2,3709.3%English
- 2,0928.2%Other
- 1,6366.4%Portuguese
- 1,3965.5%Polish
- 9063.5%German
- 6142.4%United States
- 5092.0%Scottish
- 4771.9%Arab
- 2541.0%Swedish
- 2491.0%Scotch-Irish
- 1860.7%Russian
- 1710.7%Ukrainian
- 1190.5%Subsaharan African
- 710.3%Dutch
- 680.3%Lithuanian
- 590.2%Norwegian
- 480.2%Welsh
- 380.1%Swiss
- 360.1%Czech
- 360.1%Greek
- 160.06%Danish
- 70.03%Hungarian
- 70.03%Slovak
- 60.02%West Indian
Zip codes: 02865.