Races in Linden, New Jersey (NJ) Detailed Stats
Data:
Races - White alone (%)
Races - White alone (% change since 2000)
Races - Black alone (%)
Races - Black alone (% change since 2000)
Races - American Indian alone (%)
Races - American Indian alone (% change since 2000)
Races - Asian alone (%)
Races - Asian alone (% change since 2000)
Races - Hispanic (%)
Races - Hispanic (% change since 2000)
Races - Native Hawaiian and Other Pacific Islander alone (%)
Races - Native Hawaiian and Other Pacific Islander alone (% change since 2000)
Races - Two or more races(%)
Races - Two or more races(% change since 2000)
Races - Other race alone (%)
Races - Other race alone (% change since 2000)
Racial diversity
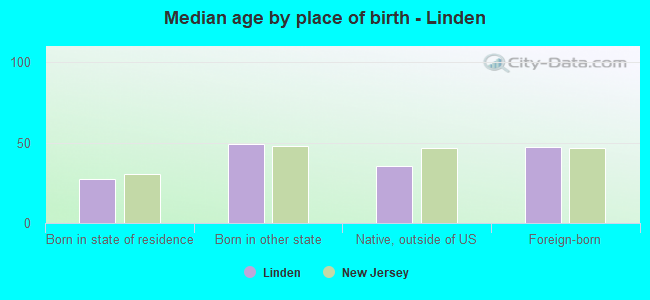
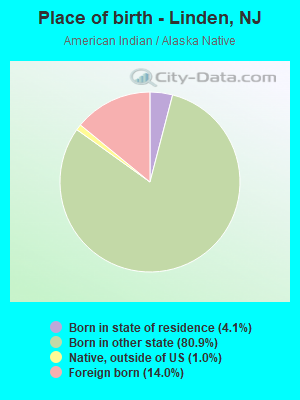
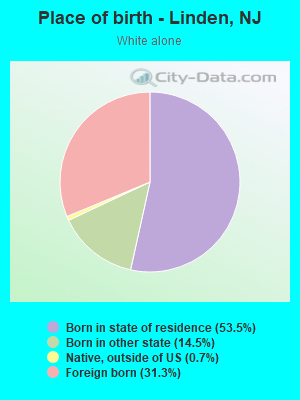
Place of birth - Born in state of residence (%)
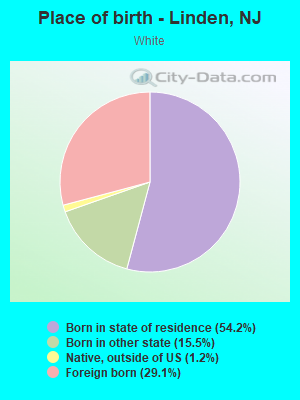
Place of birth - Born in state of residence (%) - White
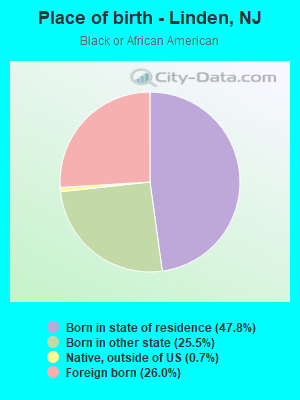
Place of birth - Born in state of residence (%) - Black or African American
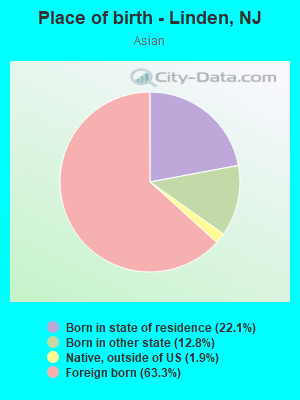
Place of birth - Born in state of residence (%) - Asian
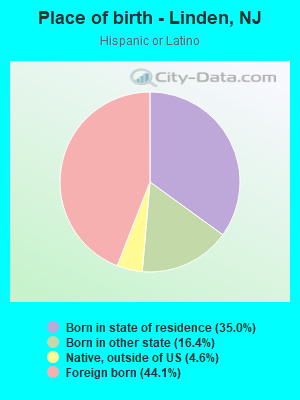
Place of birth - Born in state of residence (%) - Hispanic or Latino
Place of birth - Born in state of residence (%) - American Indian and Alaska Native
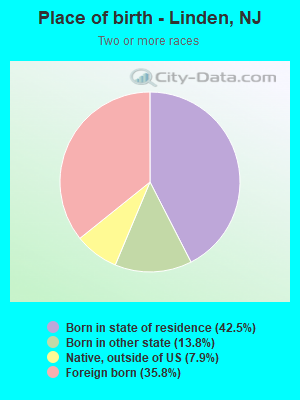
Place of birth - Born in state of residence (%) - Multirace
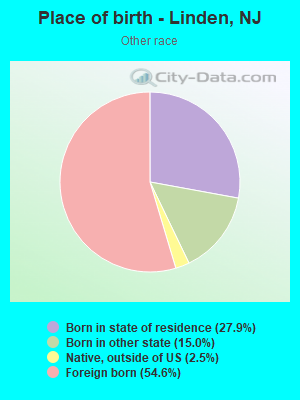
Place of birth - Born in state of residence (%) - Other Race
Place of birth - Born in other state (%)
Place of birth - Born in other state (%) - White
Place of birth - Born in other state (%) - Black or African American
Place of birth - Born in other state (%) - Asian
Place of birth - Born in other state (%) - Hispanic or Latino
Place of birth - Born in other state (%) - American Indian and Alaska Native
Place of birth - Born in other state (%) - Multirace
Place of birth - Born in other state (%) - Other Race
Place of birth - Native, outside of US (%)
Place of birth - Native, outside of US (%) - White
Place of birth - Native, outside of US (%) - Black or African American
Place of birth - Native, outside of US (%) - Asian
Place of birth - Native, outside of US (%) - Hispanic or Latino
Place of birth - Native, outside of US (%) - American Indian and Alaska Native
Place of birth - Native, outside of US (%) - Multirace
Place of birth - Native, outside of US (%) - Other Race
Place of birth - Foreign born (%)
Place of birth - Foreign born (%) - White
Place of birth - Foreign born (%) - Black or African American
Place of birth - Foreign born (%) - Asian
Place of birth - Foreign born (%) - Hispanic or Latino
Place of birth - Foreign born (%) - American Indian and Alaska Native
Place of birth - Foreign born (%) - Multirace
Place of birth - Foreign born (%) - Other Race
Residents speaking English at home (%)
Residents speaking English at home - Born in the United States (%)
Residents speaking English at home - Native, born elsewhere (%)
Residents speaking English at home - Foreign born (%)
Residents speaking Spanish at home (%)
Residents speaking Spanish at home - Born in the United States (%)
Residents speaking Spanish at home - Native, born elsewhere (%)
Residents speaking Spanish at home - Foreign born (%)
Residents speaking other language at home (%)
Residents speaking other language at home - Born in the United States (%)
Residents speaking other language at home - Native, born elsewhere (%)
Residents speaking other language at home - Foreign born (%)
Marital status - Never married (%)
Marital status - Now married (%)
Marital status - Separated (%)
Marital status - Widowed (%)
Marital status - Divorced (%)
Ancestries Reported - Arab (%)
Ancestries Reported - Czech (%)
Ancestries Reported - Danish (%)
Ancestries Reported - Dutch (%)
Ancestries Reported - English (%)
Ancestries Reported - French (%)
Ancestries Reported - French Canadian (%)
Ancestries Reported - German (%)
Ancestries Reported - Greek (%)
Ancestries Reported - Hungarian (%)
Ancestries Reported - Irish (%)
Ancestries Reported - Italian (%)
Ancestries Reported - Lithuanian (%)
Ancestries Reported - Norwegian (%)
Ancestries Reported - Polish (%)
Ancestries Reported - Portuguese (%)
Ancestries Reported - Russian (%)
Ancestries Reported - Scotch-Irish (%)
Ancestries Reported - Scottish (%)
Ancestries Reported - Slovak (%)
Ancestries Reported - Subsaharan African (%)
Ancestries Reported - Swedish (%)
Ancestries Reported - Swiss (%)
Ancestries Reported - Ukrainian (%)
Ancestries Reported - United States (%)
Ancestries Reported - Welsh (%)
Ancestries Reported - West Indian (%)
Ancestries Reported - Other (%)
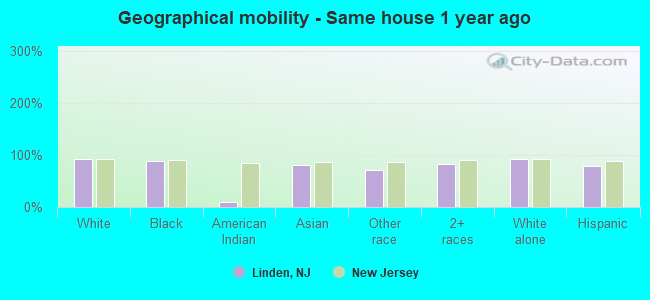
Geographical mobility - Same house 1 year ago (%)
Geographical mobility - Same house 1 year ago (%) - White
Geographical mobility - Same house 1 year ago (%) - Black or African American
Geographical mobility - Same house 1 year ago (%) - Asian
Geographical mobility - Same house 1 year ago (%) - Hispanic or Latino
Geographical mobility - Same house 1 year ago (%) - American Indian and Alaska Native
Geographical mobility - Same house 1 year ago (%) - Multirace
Geographical mobility - Same house 1 year ago (%) - Other Race
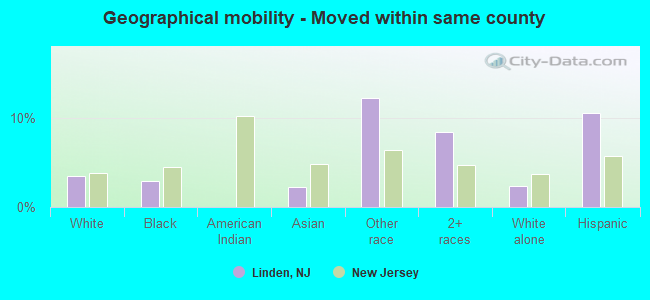
Geographical mobility - Moved within same county (%)
Geographical mobility - Moved within same county (%) - White
Geographical mobility - Moved within same county (%) - Black or African American
Geographical mobility - Moved within same county (%) - Asian
Geographical mobility - Moved within same county (%) - Hispanic or Latino
Geographical mobility - Moved within same county (%) - American Indian and Alaska Native
Geographical mobility - Moved within same county (%) - Multirace
Geographical mobility - Moved within same county (%) - Other Race
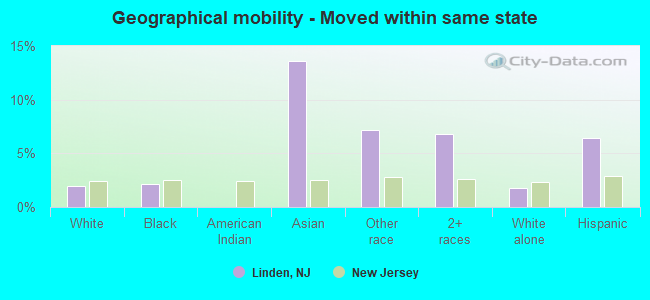
Geographical mobility - Moved from different county within same state (%)
Geographical mobility - Moved from different county within same state (%) - White
Geographical mobility - Moved from different county within same state (%) - Black or African American
Geographical mobility - Moved from different county within same state (%) - Asian
Geographical mobility - Moved from different county within same state (%) - Hispanic or Latino
Geographical mobility - Moved from different county within same state (%) - American Indian and Alaska Native
Geographical mobility - Moved from different county within same state (%) - Multirace
Geographical mobility - Moved from different county within same state (%) - Other Race
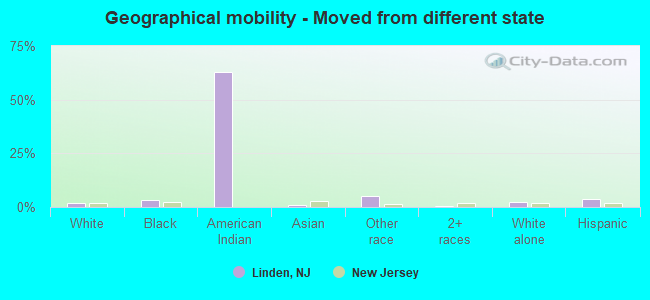
Geographical mobility - Moved from different state (%)
Geographical mobility - Moved from different state (%) - White
Geographical mobility - Moved from different state (%) - Black or African American
Geographical mobility - Moved from different state (%) - Asian
Geographical mobility - Moved from different state (%) - Hispanic or Latino
Geographical mobility - Moved from different state (%) - American Indian and Alaska Native
Geographical mobility - Moved from different state (%) - Multirace
Geographical mobility - Moved from different state (%) - Other Race
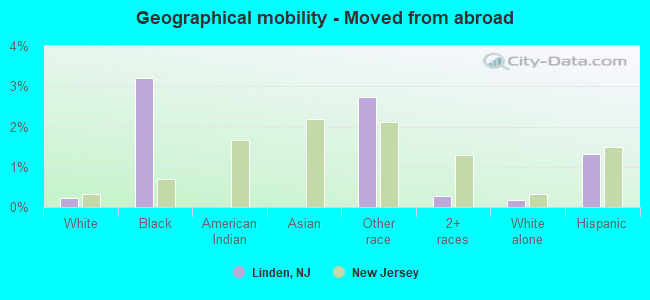
Geographical mobility - Moved from abroad (%)
Geographical mobility - Moved from abroad (%) - White
Geographical mobility - Moved from abroad (%) - Black or African American
Geographical mobility - Moved from abroad (%) - Asian
Geographical mobility - Moved from abroad (%) - Hispanic or Latino
Geographical mobility - Moved from abroad (%) - American Indian and Alaska Native
Geographical mobility - Moved from abroad (%) - Multirace
Geographical mobility - Moved from abroad (%) - Other Race
Place of birth for the foreign-born population - Ireland (%)
Place of birth for the foreign-born population - Denmark (%)
Place of birth for the foreign-born population - Norway (%)
Place of birth for the foreign-born population - Sweden (%)
Place of birth for the foreign-born population - United Kingdom (%)
Place of birth for the foreign-born population - England (%)
Place of birth for the foreign-born population - Scotland (%)
Place of birth for the foreign-born population - Other Northern Europe (%)
Place of birth for the foreign-born population - Austria (%)
Place of birth for the foreign-born population - Belgium (%)
Place of birth for the foreign-born population - France (%)
Place of birth for the foreign-born population - Germany (%)
Place of birth for the foreign-born population - Netherlands (%)
Place of birth for the foreign-born population - Switzerland (%)
Place of birth for the foreign-born population - Other Western Europe (%)
Place of birth for the foreign-born population - Greece (%)
Place of birth for the foreign-born population - Italy (%)
Place of birth for the foreign-born population - Portugal (%)
Place of birth for the foreign-born population - Spain (%)
Place of birth for the foreign-born population - Other Southern Europe (%)
Place of birth for the foreign-born population - Albania (%)
Place of birth for the foreign-born population - Belarus (%)
Place of birth for the foreign-born population - Bosnia and Herzegovina (%)
Place of birth for the foreign-born population - Bulgaria (%)
Place of birth for the foreign-born population - Croatia (%)
Place of birth for the foreign-born population - Czechoslovakia (%)
Place of birth for the foreign-born population - Hungary (%)
Place of birth for the foreign-born population - Latvia (%)
Place of birth for the foreign-born population - Lithuania (%)
Place of birth for the foreign-born population - North Macedonia (Macedonia) (%)
Place of birth for the foreign-born population - Moldova (%)
Place of birth for the foreign-born population - Poland (%)
Place of birth for the foreign-born population - Romania (%)
Place of birth for the foreign-born population - Russia (%)
Place of birth for the foreign-born population - Serbia (%)
Place of birth for the foreign-born population - Ukraine (%)
Place of birth for the foreign-born population - Other Eastern Europe (%)
Place of birth for the foreign-born population - China (%)
Place of birth for the foreign-born population - Hong Kong (%)
Place of birth for the foreign-born population - Taiwan (%)
Place of birth for the foreign-born population - Japan (%)
Place of birth for the foreign-born population - Korea (%)
Place of birth for the foreign-born population - Other Eastern Asia (%)
Place of birth for the foreign-born population - Afghanistan (%)
Place of birth for the foreign-born population - Bangladesh (%)
Place of birth for the foreign-born population - India (%)
Place of birth for the foreign-born population - Iran (%)
Place of birth for the foreign-born population - Kazakhstan (%)
Place of birth for the foreign-born population - Nepal (%)
Place of birth for the foreign-born population - Pakistan (%)
Place of birth for the foreign-born population - Sri Lanka (%)
Place of birth for the foreign-born population - Uzbekistan (%)
Place of birth for the foreign-born population - Other South Central Asia (%)
Place of birth for the foreign-born population - Burma (%)
Place of birth for the foreign-born population - Cambodia (%)
Place of birth for the foreign-born population - Indonesia (%)
Place of birth for the foreign-born population - Laos (%)
Place of birth for the foreign-born population - Malaysia (%)
Place of birth for the foreign-born population - Philippines (%)
Place of birth for the foreign-born population - Singapore (%)
Place of birth for the foreign-born population - Thailand (%)
Place of birth for the foreign-born population - Vietnam (%)
Place of birth for the foreign-born population - Other South Eastern Asia (%)
Place of birth for the foreign-born population - Armenia (%)
Place of birth for the foreign-born population - Iraq (%)
Place of birth for the foreign-born population - Israel (%)
Place of birth for the foreign-born population - Jordan (%)
Place of birth for the foreign-born population - Kuwait (%)
Place of birth for the foreign-born population - Lebanon (%)
Place of birth for the foreign-born population - Saudi Arabia (%)
Place of birth for the foreign-born population - Syria (%)
Place of birth for the foreign-born population - Turkey (%)
Place of birth for the foreign-born population - Yemen (%)
Place of birth for the foreign-born population - Other Western Asia (%)
Place of birth for the foreign-born population - Eritrea (%)
Place of birth for the foreign-born population - Ethiopia (%)
Place of birth for the foreign-born population - Kenya (%)
Place of birth for the foreign-born population - Somalia (%)
Place of birth for the foreign-born population - Uganda (%)
Place of birth for the foreign-born population - Zimbabwe (%)
Place of birth for the foreign-born population - Other Eastern Africa (%)
Place of birth for the foreign-born population - Cameroon (%)
Place of birth for the foreign-born population - Congo (%)
Place of birth for the foreign-born population - Democratic Republic of Congo (Zaire) (%)
Place of birth for the foreign-born population - Other Middle Africa (%)
Place of birth for the foreign-born population - Egypt (%)
Place of birth for the foreign-born population - Morocco (%)
Place of birth for the foreign-born population - Sudan (%)
Place of birth for the foreign-born population - Other Northern Africa (%)
Place of birth for the foreign-born population - South Africa (%)
Place of birth for the foreign-born population - Other Southern Africa (%)
Place of birth for the foreign-born population - Cabo Verde (%)
Place of birth for the foreign-born population - Ghana (%)
Place of birth for the foreign-born population - Liberia (%)
Place of birth for the foreign-born population - Nigeria (%)
Place of birth for the foreign-born population - Senegal (%)
Place of birth for the foreign-born population - Sierra Leone (%)
Place of birth for the foreign-born population - Other Western Africa (%)
Place of birth for the foreign-born population - Australia (%)
Place of birth for the foreign-born population - New Zealand (%)
Place of birth for the foreign-born population - Fiji (%)
Place of birth for the foreign-born population - Micronesia (%)
Place of birth for the foreign-born population - Bahamas (%)
Place of birth for the foreign-born population - Barbados (%)
Place of birth for the foreign-born population - Cuba (%)
Place of birth for the foreign-born population - Dominica (%)
Place of birth for the foreign-born population - Dominican Republic (%)
Place of birth for the foreign-born population - Grenada (%)
Place of birth for the foreign-born population - Haiti (%)
Place of birth for the foreign-born population - Jamaica (%)
Place of birth for the foreign-born population - St. Vincent and the Grenadines (%)
Place of birth for the foreign-born population - Trinidad and Tobago (%)
Place of birth for the foreign-born population - West Indies (%)
Place of birth for the foreign-born population - Other Caribbean (%)
Place of birth for the foreign-born population - Belize (%)
Place of birth for the foreign-born population - Costa Rica (%)
Place of birth for the foreign-born population - El Salvador (%)
Place of birth for the foreign-born population - Guatemala (%)
Place of birth for the foreign-born population - Honduras (%)
Place of birth for the foreign-born population - Mexico (%)
Place of birth for the foreign-born population - Nicaragua (%)
Place of birth for the foreign-born population - Panama (%)
Place of birth for the foreign-born population - Other Central America (%)
Place of birth for the foreign-born population - Argentina (%)
Place of birth for the foreign-born population - Bolivia (%)
Place of birth for the foreign-born population - Brazil (%)
Place of birth for the foreign-born population - Chile (%)
Place of birth for the foreign-born population - Colombia (%)
Place of birth for the foreign-born population - Ecuador (%)
Place of birth for the foreign-born population - Guyana (%)
Place of birth for the foreign-born population - Peru (%)
Place of birth for the foreign-born population - Uruguay (%)
Place of birth for the foreign-born population - Venezuela (%)
Place of birth for the foreign-born population - Other South America (%)
Place of birth for the foreign-born population - Canada (%)
Place of birth for the foreign-born population - Other Northern America (%)
Place of birth for the foreign-born population - Other (%)
Latest news about races in Linden, NJ collected exclusively by city-data.com from local newspapers, TV, and radio stations
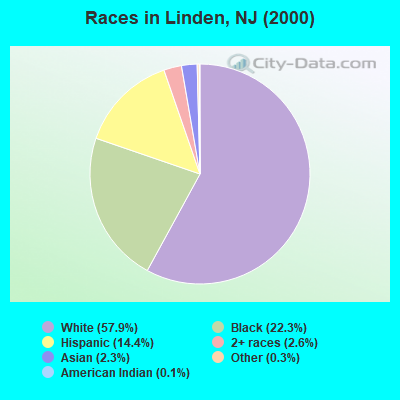
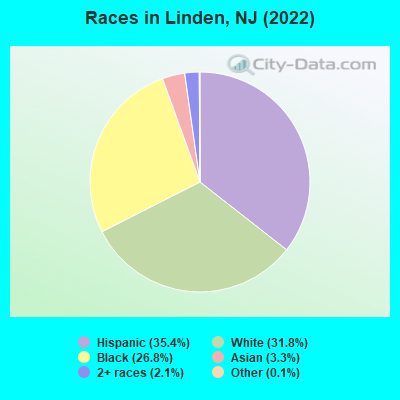
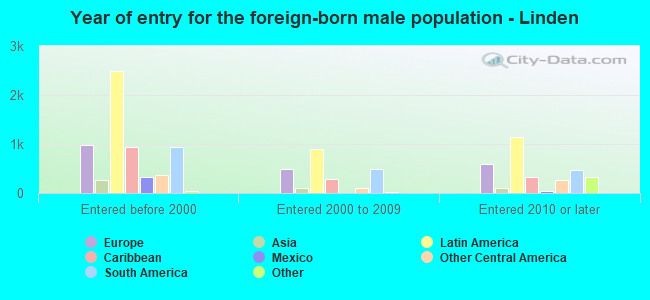
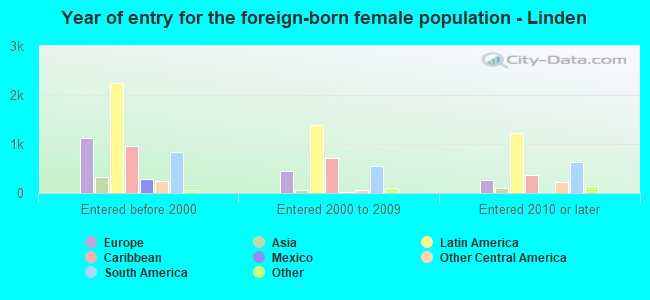
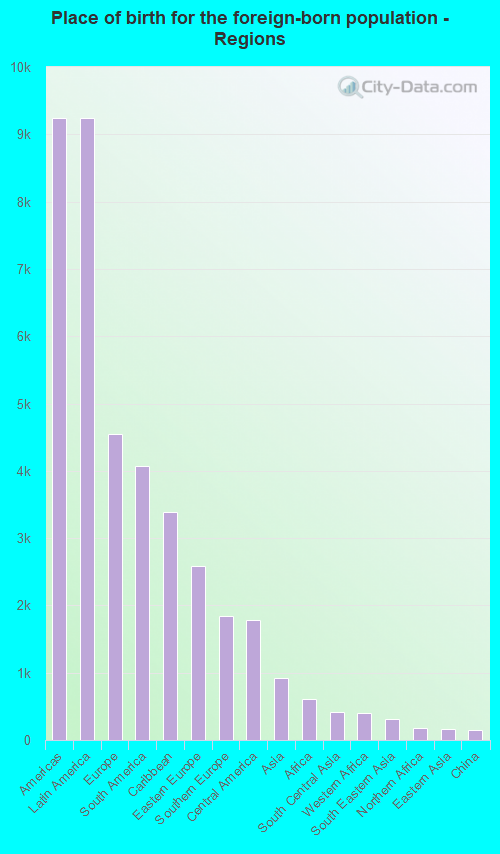
According to 2022 data, the most numerous races in Linden, NJ are White alone (13,791 residents), Hispanic (15,339 residents), and Black alone (11,616 residents). 44.3% of Linden residents speak English at home. 35.3% of Linden, NJ residents are foreign-born (20.9% born in Latin America, 10.3% born in Europe), which is 34.9% greater than the foreign-born rate of 23.0% across the entire state of New Jersey.
Race distribution in Linden
2000 2022
5,557,209 66.0% White alone 1,117,191 13.3% Hispanic 1,096,171 13.0% Black alone 477,012 5.7% Asian alone 133,689 1.6% Two or more races 19,565 0.2% Other race alone 11,338 0.1% American Indian alone 2,175 0.03% Native Hawaiian and Other
4,766,476 51.5% White alone 2,028,470 21.9% Hispanic 1,111,632 12.0% Black alone 923,546 10.0% Asian alone 332,237 3.6% Two or more races 89,847 1.0% Other race alone 8,557 0.09% American Indian alone 934 0.01% Native Hawaiian and Other
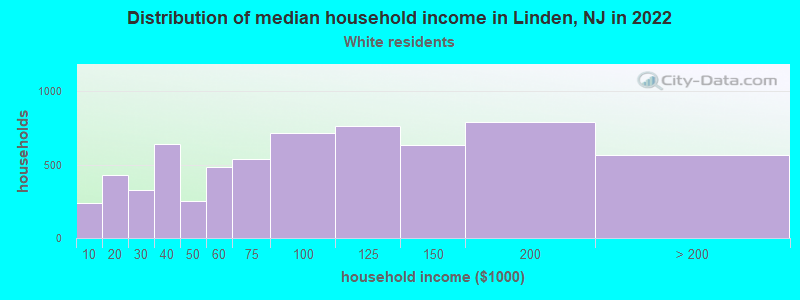
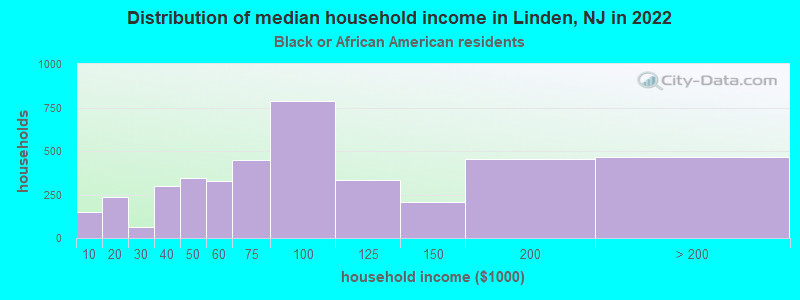
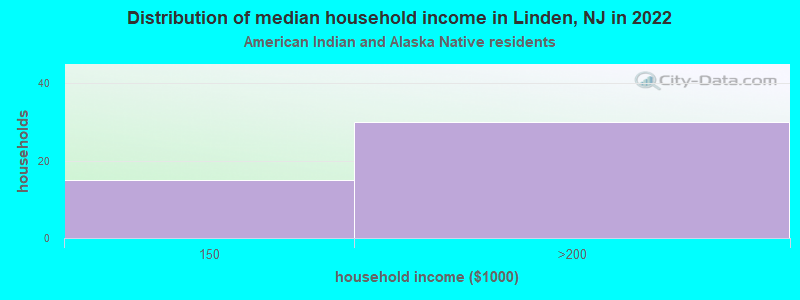
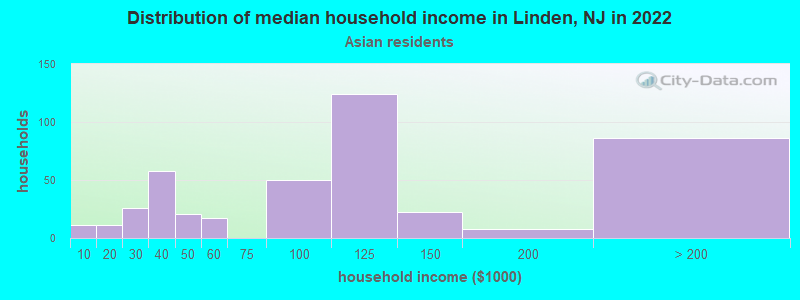
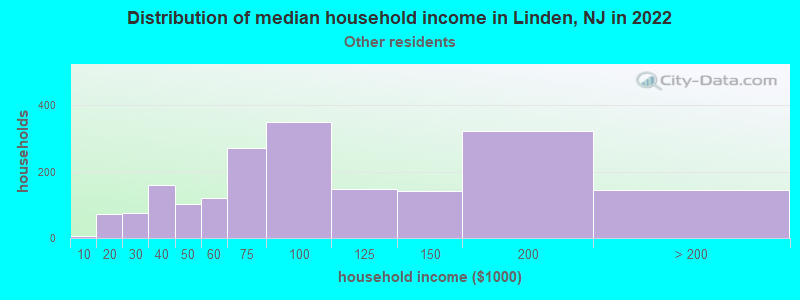
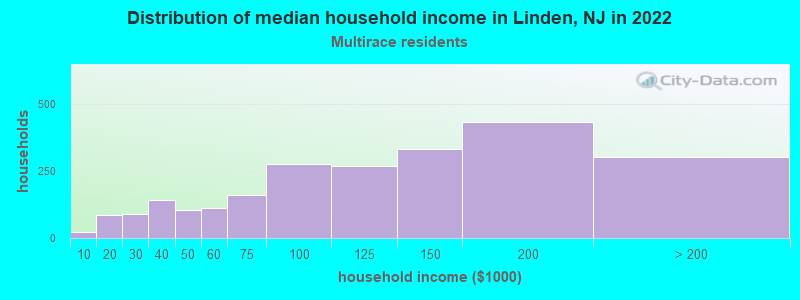
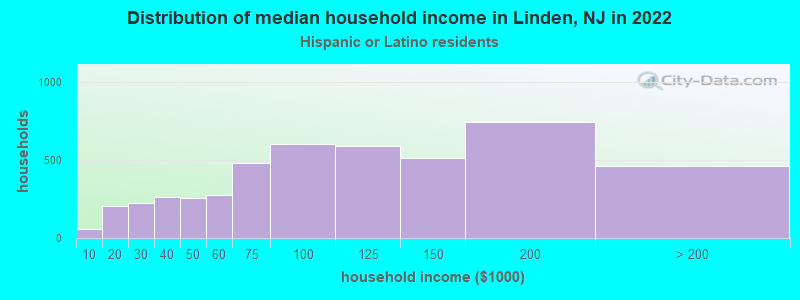
Income and house value in Linden Median household income in 2022 $87,269 White non-Hispanic householders$83,578 Black householders$104,651 Asian householders$88,931 Some other race householders$111,027 Two or more races householders$101,154 Hispanic or Latino race householdersMedian 2022 house value $384,894 White Non-Hispanic householders$343,921 Black or African American householders$416,136 American Indian or Alaska Native householders $415,368 Asian householders$396,418 Some other race householders$390,016 Two or more races householders$387,711 Hispanic or Latino householders
Median age by race in Linden
43.8 Median age for White residents42.2 45.4 40.1 Median age for Black or African American residents40.9 39.0 14.4 Median age for American Indian / Alaska Native residents16.3 29.5 40.7 Median age for Asian residents36.4 44.7 -1,010,045,661.1 Median age for Native Hawaiian / Pacific Islander residents-860,335,194.7 -713,070,378.3 36.6 Median age for Other race residents36.9 33.4 34.1 Median age for Two or more races residents30.9 41.2 46.0 Median age for White alone residents45.5 47.0 35.5 Median age for Hispanic or Latino residents36.1 35.0
Owner/renter occupied households by race in Linden
House owners and renters - White residents 4,245 64.9% Owner occupied2,295 35.1% Renter occupiedHouse owners and renters - Black or African American residents 1,858 45.9% Owner occupied2,193 54.1% Renter occupiedHouse owners and renters - American Indian / Alaska Native residents 27 58.5% Owner occupied19 41.5% Renter occupiedHouse owners and renters - Asian residents 388 80.5% Owner occupied94 19.5% Renter occupiedHouse owners and renters - Other race residents 1,357 68.2% Owner occupied632 31.8% Renter occupiedHouse owners and renters - Two or more races residents 1,577 66.0% Owner occupied814 34.0% Renter occupiedHouse owners and renters - White alone residents 3,793 63.8% Owner occupied2,154 36.2% Renter occupiedHouse owners and renters - Hispanic or Latino residents 3,090 65.7% Owner occupied1,615 34.3% Renter occupied
Language usage in Linden
English speakers - Total 44.3% of residents of Linden speak English at home.
29.0% of residents speak Spanish at home 7,256 61.1% Speak English very well4,627 38.9% Speak English less than very well26.6% of residents speak other language at home 6,527 59.9% Speak English very well4,378 40.1% Speak English less than very well
English speakers - Born in the United States 67.9% of residents of Linden speak English at home.
24.7% of residents speak Spanish at home 1,573 89.6% Speak English very well183 10.4% Speak English less than very well7.1% of residents speak other language at home 374 74.4% Speak English very well129 25.6% Speak English less than very well
English speakers - Native, born elsewhere 20.2% of residents of Linden speak English at home.
71.9% of residents speak Spanish at home 533 80.4% Speak English very well130 19.6% Speak English less than very well10.2% of residents speak other language at home 39 41.5% Speak English very well55 58.5% Speak English less than very well
English speakers - Foreign-born 9.0% of residents of Linden speak English at home.
40.5% of residents speak Spanish at home 2,308 36.6% Speak English very well4,006 63.4% Speak English less than very well49.9% of residents speak other language at home 3,636 46.8% Speak English very well4,137 53.2% Speak English less than very well
White (Caucasian) - Speak only English Native:
71.3% (7,371)Foreign-born:
8.3% (363)
White (Caucasian) - Speak another language Native:
24.1% (2,494)Foreign-born:
91.4% (4,003)
Black or African American - Speak only English Native:
87.6% (7,069)Foreign-born:
16.0% (492)
Black or African American - Speak another language Native:
12.6% (1,019)Foreign-born:
86.1% (2,642)
American Indian / Alaska Native - Speak another language Native:
100.0% (101)Foreign-born:
97.6% (29)
Asian - Speak only English Native:
47.1% (218)Foreign-born:
9.9% (91)
Asian - Speak another language Native:
46.1% (214)Foreign-born:
89.7% (824)
Other race - Speak only English Native:
27.4% (626)Foreign-born:
10.2% (327)
Other race - Speak another language Native:
73.3% (1,675)Foreign-born:
91.7% (2,950)
Two or more races - Speak only English Native:
31.0% (1,462)Foreign-born:
3.9% (111)
Two or more races - Speak another language Native:
73.4% (3,459)Foreign-born:
95.8% (2,753)
White alone - Speak only English Native:
78.1% (6,987)Foreign-born:
9.2% (385)
White alone - Speak another language Native:
21.5% (1,921)Foreign-born:
91.9% (3,851)
Hispanic or Latino - Speak only English Native:
25.4% (1,898)Foreign-born:
3.7% (251)
Hispanic or Latino - Speak another language Native:
74.6% (5,579)Foreign-born:
96.3% (6,488)
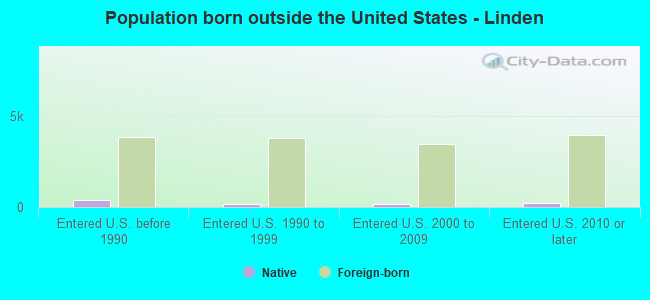
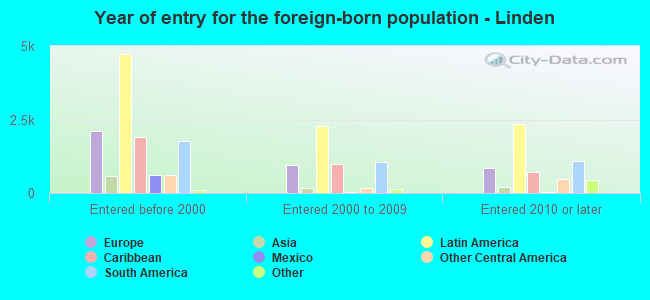
Foreign-born residents in Linden 15,308 residents are foreign born (20.9% Latin America , 10.3% Europe ).
This city:
35.3%New Jersey:
23.2%
Marital status for residents in Linden Marital status - White (Caucasian) population 15 years and over
Males 35.5% Never married49.9% Now married1.1% Separated2.7% Widowed10.8% DivorcedFemales 30.7% Never married47.0% Now married2.4% Separated9.7% Widowed10.1% DivorcedWomen who gave birth in the past 12 months Now married:
79.8% (134)Unmarried:
20.2% (34)
Women who did not give birth in the past 12 months Now married:
44.5% (1,488)Unmarried:
55.5% (1,857)
Marital status - Black or African American population 15 years and over
Males 41.7% Never married41.5% Now married2.8% Separated3.9% Widowed10.2% DivorcedFemales 46.2% Never married31.1% Now married2.3% Separated10.0% Widowed10.4% DivorcedWomen who gave birth in the past 12 months Now married:
41.3% (81)Unmarried:
58.7% (115)
Women who did not give birth in the past 12 months Now married:
27.6% (855)Unmarried:
72.4% (2,238)
Marital status - American Indian / Alaska Native population 15 years and over
Males 4.8% Never married95.2% Now married0.0% Separated0.0% Widowed0.0% DivorcedFemales 0.0% Never married100.0% Now married0.0% Separated0.0% Widowed0.0% DivorcedWomen who did not give birth in the past 12 months Now married:
100.0% (43)Unmarried:
0.0% (0)
Marital status - Asian population 15 years and over
Males 44.4% Never married53.8% Now married0.0% Separated0.0% Widowed1.8% DivorcedFemales 13.4% Never married61.5% Now married0.0% Separated17.7% Widowed7.5% DivorcedWomen who gave birth in the past 12 months Now married:
100.0% (43)Unmarried:
0.0% (0)
Women who did not give birth in the past 12 months Now married:
69.1% (168)Unmarried:
30.9% (75)
Marital status - Other race population 15 years and over
Males 33.7% Never married53.4% Now married6.7% Separated0.0% Widowed6.2% DivorcedFemales 35.9% Never married44.4% Now married0.4% Separated5.7% Widowed13.7% DivorcedWomen who gave birth in the past 12 months Now married:
74.2% (51)Unmarried:
25.8% (18)
Women who did not give birth in the past 12 months Now married:
39.3% (420)Unmarried:
60.7% (649)
Marital status - Two or more races population 15 years and over
Males 51.2% Never married38.3% Now married0.5% Separated4.2% Widowed5.9% DivorcedFemales 50.6% Never married32.7% Now married2.1% Separated6.8% Widowed7.8% DivorcedWomen who gave birth in the past 12 months Now married:
44.5% (80)Unmarried:
55.5% (100)
Women who did not give birth in the past 12 months Now married:
24.1% (573)Unmarried:
75.9% (1,805)
Marital status - White alone, not Hispanic / Latino population 15 years and over
Males 33.4% Never married50.6% Now married1.3% Separated3.4% Widowed11.4% DivorcedFemales 29.3% Never married48.0% Now married2.6% Separated11.3% Widowed8.8% DivorcedWomen who gave birth in the past 12 months Now married:
77.3% (99)Unmarried:
22.7% (29)
Women who did not give birth in the past 12 months Now married:
44.4% (1,215)Unmarried:
55.6% (1,525)
Marital status - Hispanic or Latino population 15 years and over
Males 41.7% Never married47.6% Now married2.5% Separated1.3% Widowed6.8% DivorcedFemales 41.3% Never married41.2% Now married1.4% Separated4.8% Widowed11.3% DivorcedWomen who gave birth in the past 12 months Now married:
66.4% (156)Unmarried:
33.6% (79)
Women who did not give birth in the past 12 months Now married:
35.6% (1,333)Unmarried:
64.4% (2,407)
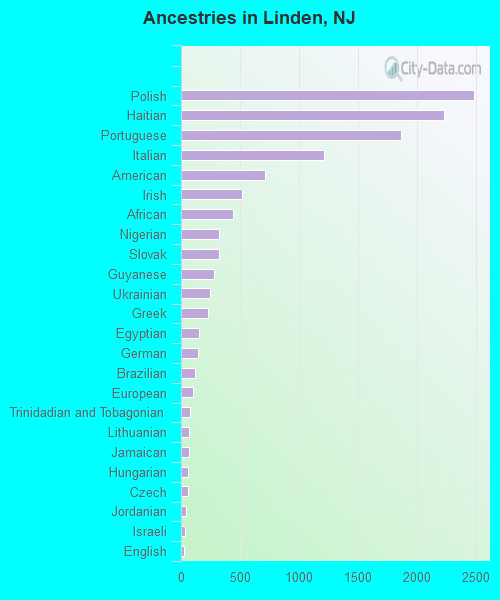
Ancestries in Linden
2,487 9.3% Polish2,230 8.3% Haitian1,863 7.0% Portuguese1,212 4.5% Italian708 2.6% American513 1.9% Irish443 1.7% African326 1.2% Nigerian323 1.2% Slovak281 1.1% Guyanese248 0.9% Ukrainian229 0.9% Greek155 0.6% Egyptian147 0.6% German122 0.5% Brazilian101 0.4% European80 0.3% Trinidadian and Tobagonian69 0.3% Lithuanian68 0.3% Jamaican63 0.2% Hungarian60 0.2% Czech40 0.1% Jordanian31 0.1% Israeli28 0.1% English22 0.08% Slavic21 0.08% French20 0.07% Dutch18 0.07% Croatian15 0.06% Yugoslavian14 0.05% Ghanaian13 0.05% Serbian9 0.03% Albanian8 0.03% Romanian8 0.03% Scotch-Irish7 0.03% Czechoslovakian6 0.02% Eastern European6 0.02% Liberian5 0.02% Austrian3 0.01% Bulgarian3 0.01% Scottish
Geographical mobility in Linden Same house 1 year ago 14,528 92.1% White (Caucasian)10,552 89.5% Black or African American17 10.3% American Indian / Alaska Native1,179 81.5% Asian4,285 71.7% Other race6,547 82.2% Two or more races12,646 92.9% White alone, not Hispanic / Latino11,842 78.1% Hispanic or LatinoMoved within same county 541 3.4% White / Caucasian346 2.9% Black or African American33 2.3% Asian729 12.2% Other race667 8.4% Two or more races326 2.4% White alone, not Hispanic / Latino1,591 10.5% Hispanic or LatinoMoved within same state 315 2.0% White / Caucasian257 2.2% Black or African American197 13.6% Asian428 7.2% Other race541 6.8% Two or more races239 1.8% White alone, not Hispanic / Latino980 6.5% Hispanic or LatinoMoved from different state 304 1.9% White / Caucasian381 3.2% Black or African American104 62.8% American Indian / Alaska Native12 0.8% Asian302 5.1% Other race52 0.7% Two or more races315 2.3% White alone, not Hispanic / Latino537 3.5% Hispanic or LatinoMoved from abroad 37 0.2% White378 3.2% Black or African American164 2.7% Other race21 0.3% Two or more races25 0.2% White alone, not Hispanic / Latino201 1.3% Hispanic or Latino
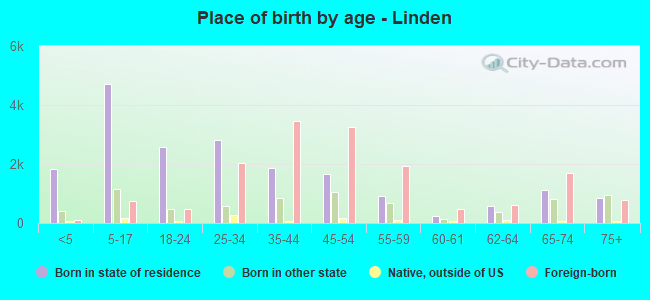
Children Nativity (place of birth) in Linden
Children under 6 years - Living with two parents Both parents native 382 100.0% NativeBoth parents foreign-born 608 100.0% NativeOne native, one foreign-born parent 206 100.0% NativeChildren under 6 years - Living with one parent Native parent 1,094 94.8% Native60 5.2% Foreign-bornForeign-born parent 375 93.4% Native27 6.6% Foreign-bornChildren 6 to 17 years - Living with two parents Both parents native 886 100.0% NativeBoth parents foreign-born 1,903 84.0% Native364 16.0% Foreign-bornOne native, one foreign-born parent 356 100.0% NativeChildren 6 to 17 years - Living with one parent Native parent 846 100.0% NativeForeign-born parent 1,546 55.5% Native1,238 44.5% Foreign-born
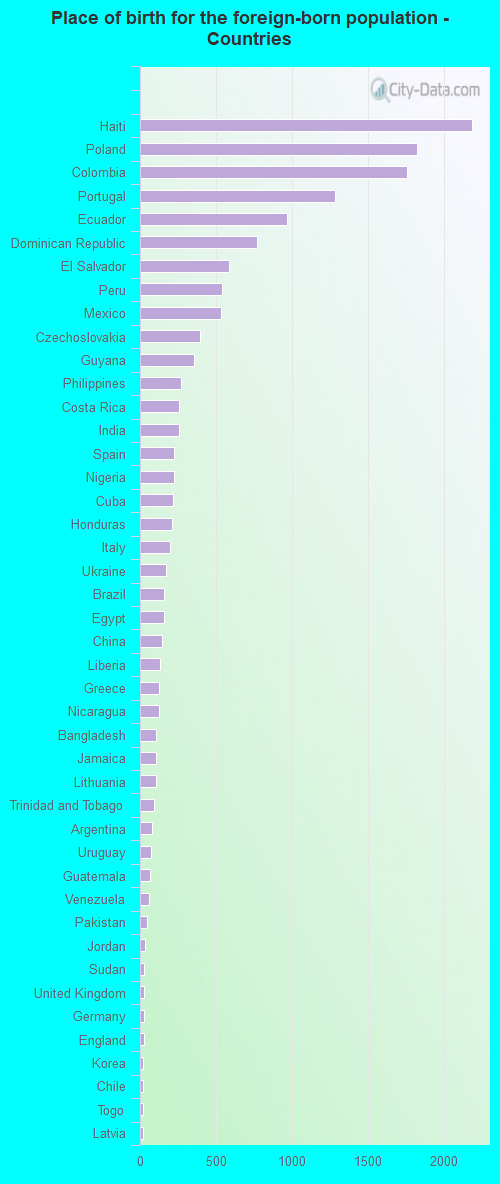
Place of birth for residents in Linden 9,238 Americas9,238 Latin America4,543 Europe4,069 South America3,386 Caribbean2,591 Eastern Europe1,839 Southern Europe1,782 Central America923 Asia602 Africa409 South Central Asia395 Western Africa306 South Eastern Asia185 Northern Africa170 Eastern Asia147 China59 Northern Europe52 Western Europe36 Western Asia12 Eastern Africa10 Middle Africa2,190 Haiti1,828 Poland1,760 Colombia1,287 Portugal970 Ecuador772 Dominican Republic587 El Salvador542 Peru533 Mexico397 Czechoslovakia354 Guyana273 Philippines258 Costa Rica255 India225 Spain224 Nigeria220 Cuba211 Honduras200 Italy170 Ukraine161 Brazil155 Egypt147 China133 Liberia126 Greece122 Nicaragua107 Bangladesh106 Jamaica103 Lithuania95 Trinidad and Tobago78 Argentina73 Uruguay69 Guatemala62 Venezuela46 Pakistan36 Jordan29 Sudan28 United Kingdom27 Germany24 England23 Korea22 Chile20 Togo20 Latvia19 France19 Vietnam19 Croatia17 Ghana15 Serbia13 Thailand12 Kenya10 Bulgaria10 Albania8 Russia8 Romania7 Ireland6 Austria
Grandparents responsible for own grandchildren in Linden
Grandparents (30 to 59 years) White / Caucasian 35 36.0% Responsible for grandchildren62 64.0% Not responsible for grandchildrenBlack or African American 15 4.8% Responsible for grandchildren296 95.2% Not responsible for grandchildrenOther race 148 100.0% Not responsible for grandchildrenTwo or more races 273 100.0% Not responsible for grandchildrenWhite alone, not Hispanic / Latino 34 37.1% Responsible for grandchildren58 62.9% Not responsible for grandchildrenHispanic or Latino 4 0.9% Responsible for grandchildren436 99.1% Not responsible for grandchildrenGrandparents (60 years and over) White / Caucasian 14 8.6% Responsible for grandchildren145 91.4% Not responsible for grandchildrenBlack or African American 111 24.1% Responsible for grandchildren350 75.9% Not responsible for grandchildrenOther race 75 100.0% Not responsible for grandchildrenTwo or more races 7 3.7% Responsible for grandchildren174 96.3% Not responsible for grandchildrenWhite alone, not Hispanic / Latino 6 4.5% Responsible for grandchildren124 95.5% Not responsible for grandchildrenHispanic or Latino 7 3.4% Responsible for grandchildren198 96.6% Not responsible for grandchildren