Races in Lindenhurst, Illinois (IL) Detailed Stats
Data:
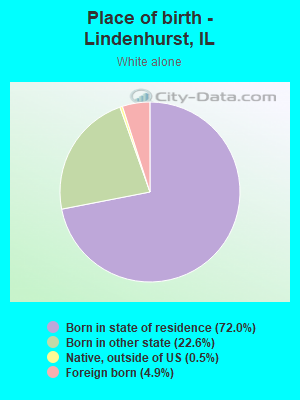
Races - White alone (%)
Races - White alone (% change since 2000)
Races - Black alone (%)
Races - Black alone (% change since 2000)
Races - American Indian alone (%)
Races - American Indian alone (% change since 2000)
Races - Asian alone (%)
Races - Asian alone (% change since 2000)
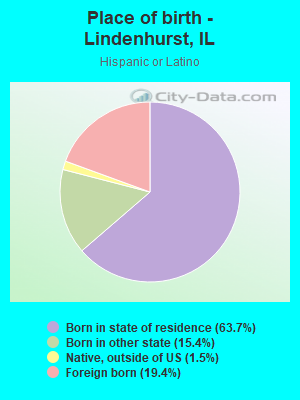
Races - Hispanic (%)
Races - Hispanic (% change since 2000)
Races - Native Hawaiian and Other Pacific Islander alone (%)
Races - Native Hawaiian and Other Pacific Islander alone (% change since 2000)
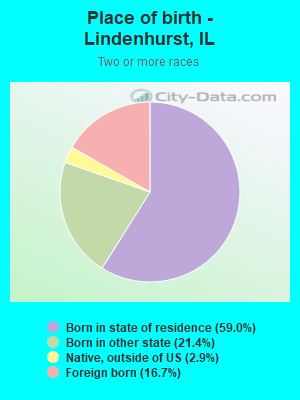
Races - Two or more races(%)
Races - Two or more races(% change since 2000)
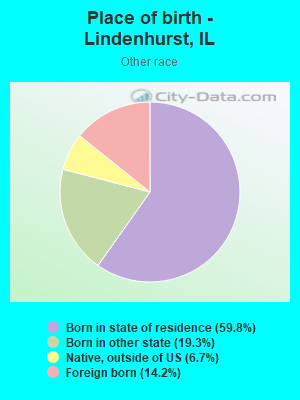
Races - Other race alone (%)
Races - Other race alone (% change since 2000)
Racial diversity
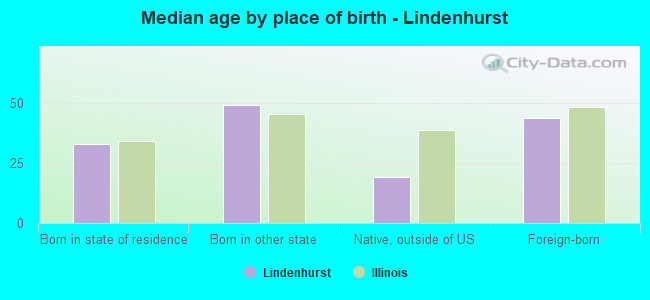
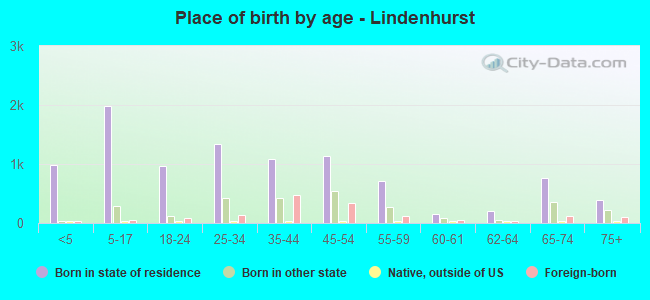
Place of birth - Born in state of residence (%)
Place of birth - Born in state of residence (%) - White
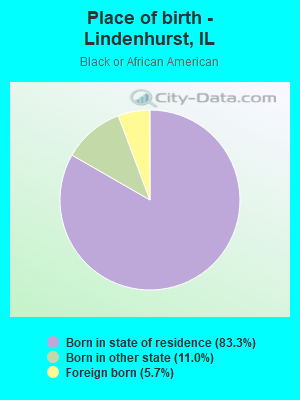
Place of birth - Born in state of residence (%) - Black or African American
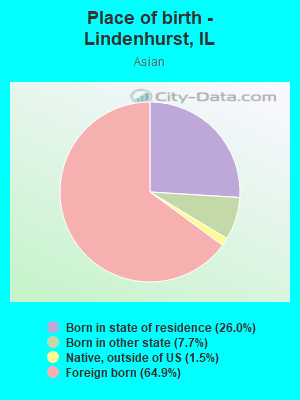
Place of birth - Born in state of residence (%) - Asian
Place of birth - Born in state of residence (%) - Hispanic or Latino
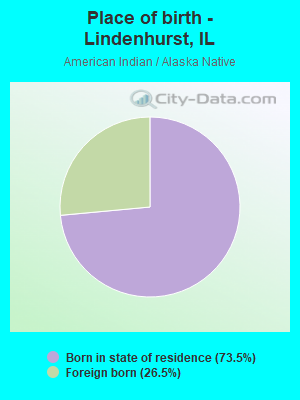
Place of birth - Born in state of residence (%) - American Indian and Alaska Native
Place of birth - Born in state of residence (%) - Multirace
Place of birth - Born in state of residence (%) - Other Race
Place of birth - Born in other state (%)
Place of birth - Born in other state (%) - White
Place of birth - Born in other state (%) - Black or African American
Place of birth - Born in other state (%) - Asian
Place of birth - Born in other state (%) - Hispanic or Latino
Place of birth - Born in other state (%) - American Indian and Alaska Native
Place of birth - Born in other state (%) - Multirace
Place of birth - Born in other state (%) - Other Race
Place of birth - Native, outside of US (%)
Place of birth - Native, outside of US (%) - White
Place of birth - Native, outside of US (%) - Black or African American
Place of birth - Native, outside of US (%) - Asian
Place of birth - Native, outside of US (%) - Hispanic or Latino
Place of birth - Native, outside of US (%) - American Indian and Alaska Native
Place of birth - Native, outside of US (%) - Multirace
Place of birth - Native, outside of US (%) - Other Race
Place of birth - Foreign born (%)
Place of birth - Foreign born (%) - White
Place of birth - Foreign born (%) - Black or African American
Place of birth - Foreign born (%) - Asian
Place of birth - Foreign born (%) - Hispanic or Latino
Place of birth - Foreign born (%) - American Indian and Alaska Native
Place of birth - Foreign born (%) - Multirace
Place of birth - Foreign born (%) - Other Race
Residents speaking English at home (%)
Residents speaking English at home - Born in the United States (%)
Residents speaking English at home - Native, born elsewhere (%)
Residents speaking English at home - Foreign born (%)
Residents speaking Spanish at home (%)
Residents speaking Spanish at home - Born in the United States (%)
Residents speaking Spanish at home - Native, born elsewhere (%)
Residents speaking Spanish at home - Foreign born (%)
Residents speaking other language at home (%)
Residents speaking other language at home - Born in the United States (%)
Residents speaking other language at home - Native, born elsewhere (%)
Residents speaking other language at home - Foreign born (%)
Marital status - Never married (%)
Marital status - Now married (%)
Marital status - Separated (%)
Marital status - Widowed (%)
Marital status - Divorced (%)
Ancestries Reported - Arab (%)
Ancestries Reported - Czech (%)
Ancestries Reported - Danish (%)
Ancestries Reported - Dutch (%)
Ancestries Reported - English (%)
Ancestries Reported - French (%)
Ancestries Reported - French Canadian (%)
Ancestries Reported - German (%)
Ancestries Reported - Greek (%)
Ancestries Reported - Hungarian (%)
Ancestries Reported - Irish (%)
Ancestries Reported - Italian (%)
Ancestries Reported - Lithuanian (%)
Ancestries Reported - Norwegian (%)
Ancestries Reported - Polish (%)
Ancestries Reported - Portuguese (%)
Ancestries Reported - Russian (%)
Ancestries Reported - Scotch-Irish (%)
Ancestries Reported - Scottish (%)
Ancestries Reported - Slovak (%)
Ancestries Reported - Subsaharan African (%)
Ancestries Reported - Swedish (%)
Ancestries Reported - Swiss (%)
Ancestries Reported - Ukrainian (%)
Ancestries Reported - United States (%)
Ancestries Reported - Welsh (%)
Ancestries Reported - West Indian (%)
Ancestries Reported - Other (%)
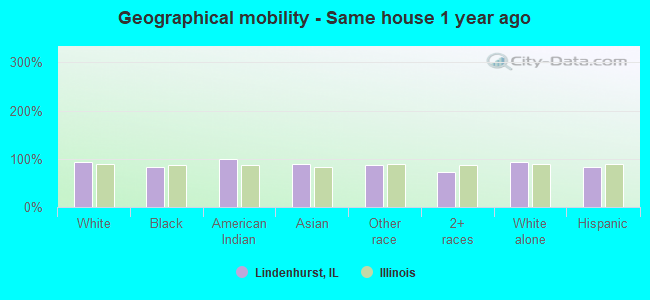
Geographical mobility - Same house 1 year ago (%)
Geographical mobility - Same house 1 year ago (%) - White
Geographical mobility - Same house 1 year ago (%) - Black or African American
Geographical mobility - Same house 1 year ago (%) - Asian
Geographical mobility - Same house 1 year ago (%) - Hispanic or Latino
Geographical mobility - Same house 1 year ago (%) - American Indian and Alaska Native
Geographical mobility - Same house 1 year ago (%) - Multirace
Geographical mobility - Same house 1 year ago (%) - Other Race
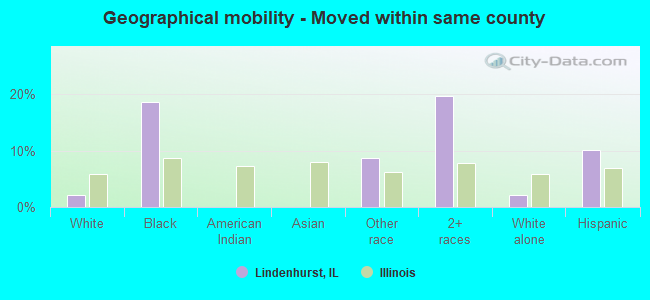
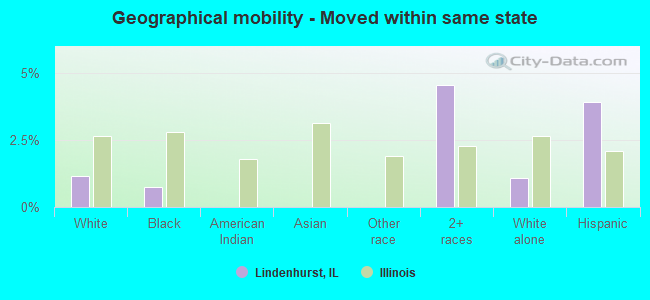
Geographical mobility - Moved within same county (%)
Geographical mobility - Moved within same county (%) - White
Geographical mobility - Moved within same county (%) - Black or African American
Geographical mobility - Moved within same county (%) - Asian
Geographical mobility - Moved within same county (%) - Hispanic or Latino
Geographical mobility - Moved within same county (%) - American Indian and Alaska Native
Geographical mobility - Moved within same county (%) - Multirace
Geographical mobility - Moved within same county (%) - Other Race
Geographical mobility - Moved from different county within same state (%)
Geographical mobility - Moved from different county within same state (%) - White
Geographical mobility - Moved from different county within same state (%) - Black or African American
Geographical mobility - Moved from different county within same state (%) - Asian
Geographical mobility - Moved from different county within same state (%) - Hispanic or Latino
Geographical mobility - Moved from different county within same state (%) - American Indian and Alaska Native
Geographical mobility - Moved from different county within same state (%) - Multirace
Geographical mobility - Moved from different county within same state (%) - Other Race
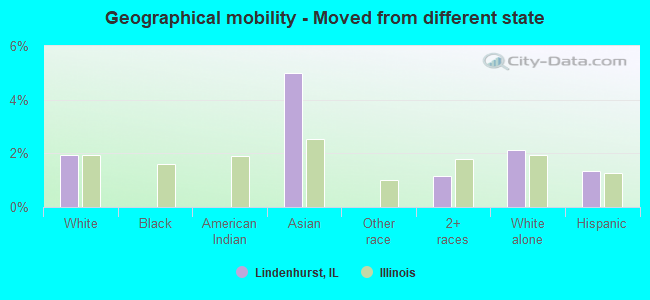
Geographical mobility - Moved from different state (%)
Geographical mobility - Moved from different state (%) - White
Geographical mobility - Moved from different state (%) - Black or African American
Geographical mobility - Moved from different state (%) - Asian
Geographical mobility - Moved from different state (%) - Hispanic or Latino
Geographical mobility - Moved from different state (%) - American Indian and Alaska Native
Geographical mobility - Moved from different state (%) - Multirace
Geographical mobility - Moved from different state (%) - Other Race
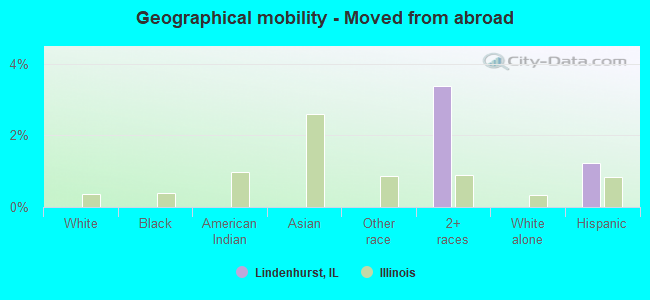
Geographical mobility - Moved from abroad (%)
Geographical mobility - Moved from abroad (%) - White
Geographical mobility - Moved from abroad (%) - Black or African American
Geographical mobility - Moved from abroad (%) - Asian
Geographical mobility - Moved from abroad (%) - Hispanic or Latino
Geographical mobility - Moved from abroad (%) - American Indian and Alaska Native
Geographical mobility - Moved from abroad (%) - Multirace
Geographical mobility - Moved from abroad (%) - Other Race
Place of birth for the foreign-born population - Ireland (%)
Place of birth for the foreign-born population - Denmark (%)
Place of birth for the foreign-born population - Norway (%)
Place of birth for the foreign-born population - Sweden (%)
Place of birth for the foreign-born population - United Kingdom (%)
Place of birth for the foreign-born population - England (%)
Place of birth for the foreign-born population - Scotland (%)
Place of birth for the foreign-born population - Other Northern Europe (%)
Place of birth for the foreign-born population - Austria (%)
Place of birth for the foreign-born population - Belgium (%)
Place of birth for the foreign-born population - France (%)
Place of birth for the foreign-born population - Germany (%)
Place of birth for the foreign-born population - Netherlands (%)
Place of birth for the foreign-born population - Switzerland (%)
Place of birth for the foreign-born population - Other Western Europe (%)
Place of birth for the foreign-born population - Greece (%)
Place of birth for the foreign-born population - Italy (%)
Place of birth for the foreign-born population - Portugal (%)
Place of birth for the foreign-born population - Spain (%)
Place of birth for the foreign-born population - Other Southern Europe (%)
Place of birth for the foreign-born population - Albania (%)
Place of birth for the foreign-born population - Belarus (%)
Place of birth for the foreign-born population - Bosnia and Herzegovina (%)
Place of birth for the foreign-born population - Bulgaria (%)
Place of birth for the foreign-born population - Croatia (%)
Place of birth for the foreign-born population - Czechoslovakia (%)
Place of birth for the foreign-born population - Hungary (%)
Place of birth for the foreign-born population - Latvia (%)
Place of birth for the foreign-born population - Lithuania (%)
Place of birth for the foreign-born population - North Macedonia (Macedonia) (%)
Place of birth for the foreign-born population - Moldova (%)
Place of birth for the foreign-born population - Poland (%)
Place of birth for the foreign-born population - Romania (%)
Place of birth for the foreign-born population - Russia (%)
Place of birth for the foreign-born population - Serbia (%)
Place of birth for the foreign-born population - Ukraine (%)
Place of birth for the foreign-born population - Other Eastern Europe (%)
Place of birth for the foreign-born population - China (%)
Place of birth for the foreign-born population - Hong Kong (%)
Place of birth for the foreign-born population - Taiwan (%)
Place of birth for the foreign-born population - Japan (%)
Place of birth for the foreign-born population - Korea (%)
Place of birth for the foreign-born population - Other Eastern Asia (%)
Place of birth for the foreign-born population - Afghanistan (%)
Place of birth for the foreign-born population - Bangladesh (%)
Place of birth for the foreign-born population - India (%)
Place of birth for the foreign-born population - Iran (%)
Place of birth for the foreign-born population - Kazakhstan (%)
Place of birth for the foreign-born population - Nepal (%)
Place of birth for the foreign-born population - Pakistan (%)
Place of birth for the foreign-born population - Sri Lanka (%)
Place of birth for the foreign-born population - Uzbekistan (%)
Place of birth for the foreign-born population - Other South Central Asia (%)
Place of birth for the foreign-born population - Burma (%)
Place of birth for the foreign-born population - Cambodia (%)
Place of birth for the foreign-born population - Indonesia (%)
Place of birth for the foreign-born population - Laos (%)
Place of birth for the foreign-born population - Malaysia (%)
Place of birth for the foreign-born population - Philippines (%)
Place of birth for the foreign-born population - Singapore (%)
Place of birth for the foreign-born population - Thailand (%)
Place of birth for the foreign-born population - Vietnam (%)
Place of birth for the foreign-born population - Other South Eastern Asia (%)
Place of birth for the foreign-born population - Armenia (%)
Place of birth for the foreign-born population - Iraq (%)
Place of birth for the foreign-born population - Israel (%)
Place of birth for the foreign-born population - Jordan (%)
Place of birth for the foreign-born population - Kuwait (%)
Place of birth for the foreign-born population - Lebanon (%)
Place of birth for the foreign-born population - Saudi Arabia (%)
Place of birth for the foreign-born population - Syria (%)
Place of birth for the foreign-born population - Turkey (%)
Place of birth for the foreign-born population - Yemen (%)
Place of birth for the foreign-born population - Other Western Asia (%)
Place of birth for the foreign-born population - Eritrea (%)
Place of birth for the foreign-born population - Ethiopia (%)
Place of birth for the foreign-born population - Kenya (%)
Place of birth for the foreign-born population - Somalia (%)
Place of birth for the foreign-born population - Uganda (%)
Place of birth for the foreign-born population - Zimbabwe (%)
Place of birth for the foreign-born population - Other Eastern Africa (%)
Place of birth for the foreign-born population - Cameroon (%)
Place of birth for the foreign-born population - Congo (%)
Place of birth for the foreign-born population - Democratic Republic of Congo (Zaire) (%)
Place of birth for the foreign-born population - Other Middle Africa (%)
Place of birth for the foreign-born population - Egypt (%)
Place of birth for the foreign-born population - Morocco (%)
Place of birth for the foreign-born population - Sudan (%)
Place of birth for the foreign-born population - Other Northern Africa (%)
Place of birth for the foreign-born population - South Africa (%)
Place of birth for the foreign-born population - Other Southern Africa (%)
Place of birth for the foreign-born population - Cabo Verde (%)
Place of birth for the foreign-born population - Ghana (%)
Place of birth for the foreign-born population - Liberia (%)
Place of birth for the foreign-born population - Nigeria (%)
Place of birth for the foreign-born population - Senegal (%)
Place of birth for the foreign-born population - Sierra Leone (%)
Place of birth for the foreign-born population - Other Western Africa (%)
Place of birth for the foreign-born population - Australia (%)
Place of birth for the foreign-born population - New Zealand (%)
Place of birth for the foreign-born population - Fiji (%)
Place of birth for the foreign-born population - Micronesia (%)
Place of birth for the foreign-born population - Bahamas (%)
Place of birth for the foreign-born population - Barbados (%)
Place of birth for the foreign-born population - Cuba (%)
Place of birth for the foreign-born population - Dominica (%)
Place of birth for the foreign-born population - Dominican Republic (%)
Place of birth for the foreign-born population - Grenada (%)
Place of birth for the foreign-born population - Haiti (%)
Place of birth for the foreign-born population - Jamaica (%)
Place of birth for the foreign-born population - St. Vincent and the Grenadines (%)
Place of birth for the foreign-born population - Trinidad and Tobago (%)
Place of birth for the foreign-born population - West Indies (%)
Place of birth for the foreign-born population - Other Caribbean (%)
Place of birth for the foreign-born population - Belize (%)
Place of birth for the foreign-born population - Costa Rica (%)
Place of birth for the foreign-born population - El Salvador (%)
Place of birth for the foreign-born population - Guatemala (%)
Place of birth for the foreign-born population - Honduras (%)
Place of birth for the foreign-born population - Mexico (%)
Place of birth for the foreign-born population - Nicaragua (%)
Place of birth for the foreign-born population - Panama (%)
Place of birth for the foreign-born population - Other Central America (%)
Place of birth for the foreign-born population - Argentina (%)
Place of birth for the foreign-born population - Bolivia (%)
Place of birth for the foreign-born population - Brazil (%)
Place of birth for the foreign-born population - Chile (%)
Place of birth for the foreign-born population - Colombia (%)
Place of birth for the foreign-born population - Ecuador (%)
Place of birth for the foreign-born population - Guyana (%)
Place of birth for the foreign-born population - Peru (%)
Place of birth for the foreign-born population - Uruguay (%)
Place of birth for the foreign-born population - Venezuela (%)
Place of birth for the foreign-born population - Other South America (%)
Place of birth for the foreign-born population - Canada (%)
Place of birth for the foreign-born population - Other Northern America (%)
Place of birth for the foreign-born population - Other (%)
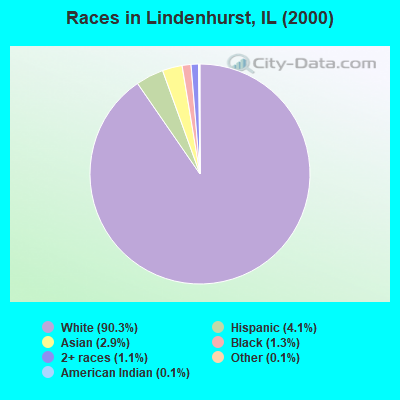
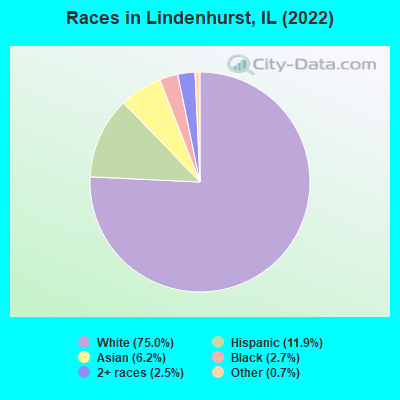
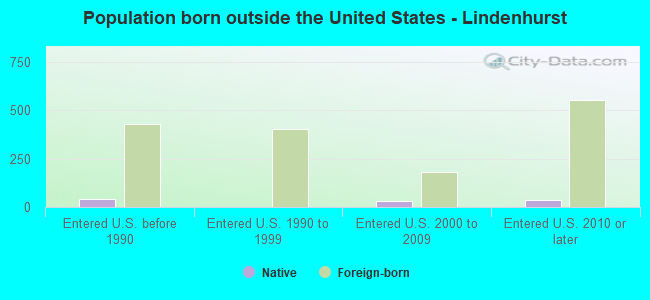
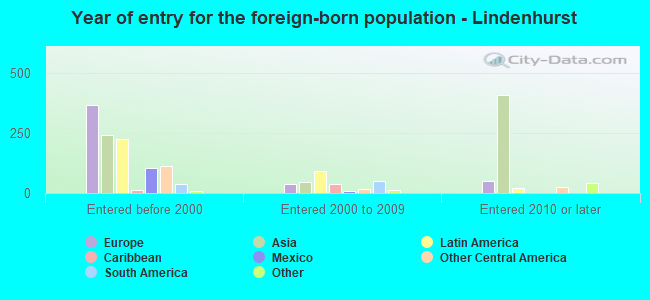
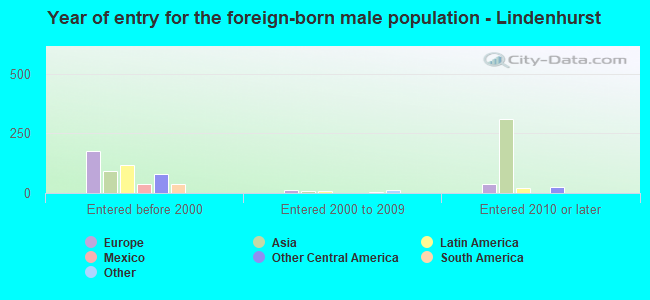
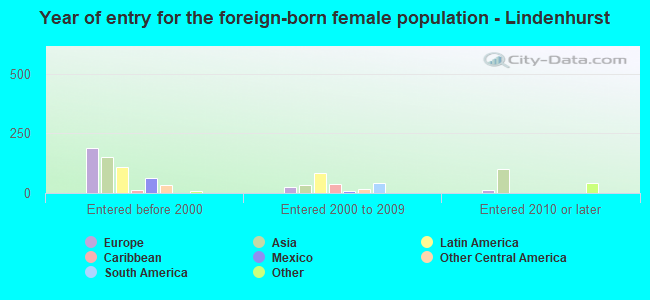
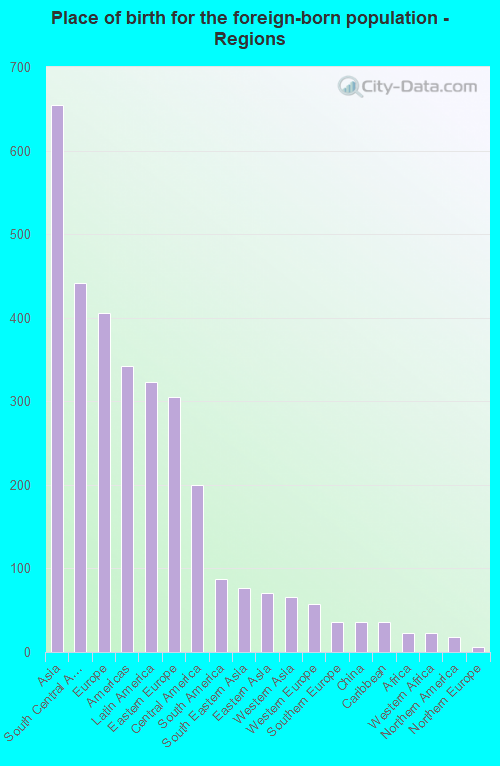
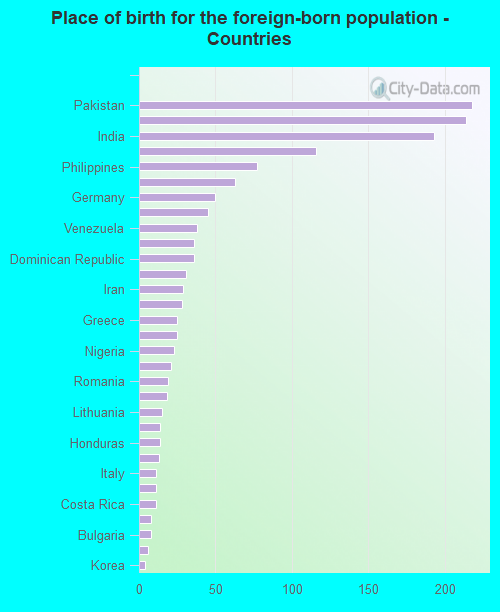
According to 2022 data, the most numerous races in Lindenhurst, IL are White alone (10,742 residents), Hispanic (1,700 residents), and Black alone (388 residents). 83.3% of Lindenhurst residents speak English at home. 10.0% of Lindenhurst, IL residents are foreign-born (4.5% born in Asia, 2.8% born in Europe, 2.2% born in Latin America), which is 40.5% less than the foreign-born rate of 14.0% across the entire state of Illinois.
Race distribution in Lindenhurst
2000 2022
8,424,140 67.8% White alone 1,856,152 14.9% Black alone 1,530,262 12.3% Hispanic 419,916 3.4% Asian alone 153,996 1.2% Two or more races 13,479 0.1% Other race alone 18,232 0.1% American Indian alone 3,116 0.03% Native Hawaiian and Other
7,356,301 58.5% White alone 2,299,726 18.3% Hispanic 1,660,423 13.2% Black alone 747,296 5.9% Asian alone 458,599 3.6% Two or more races 45,386 0.4% Other race alone 10,405 0.08% American Indian alone 3,896 0.03% Native Hawaiian and Other
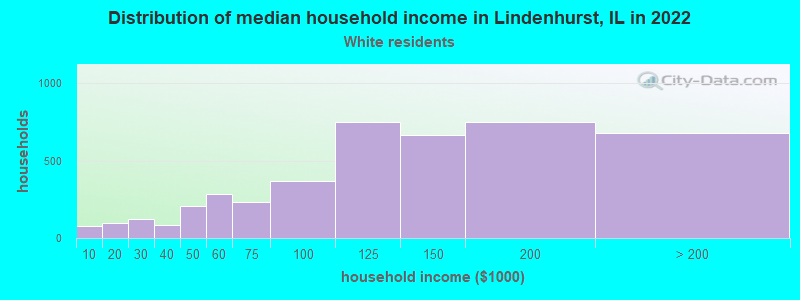
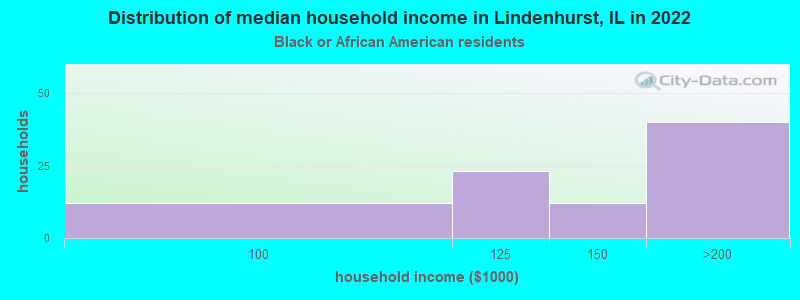
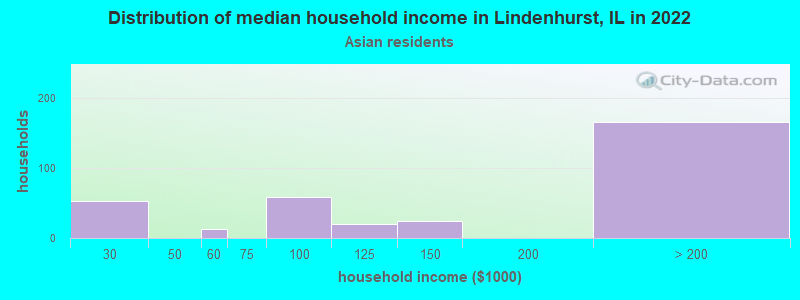
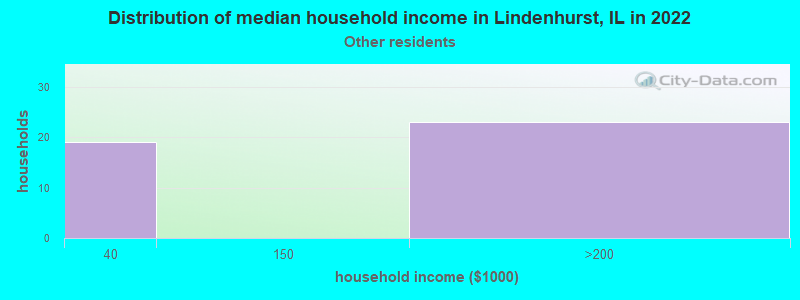
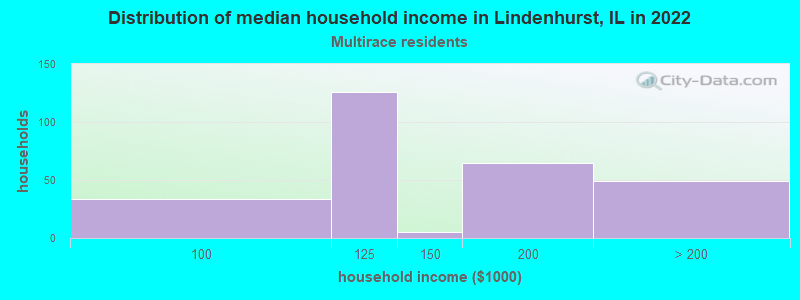
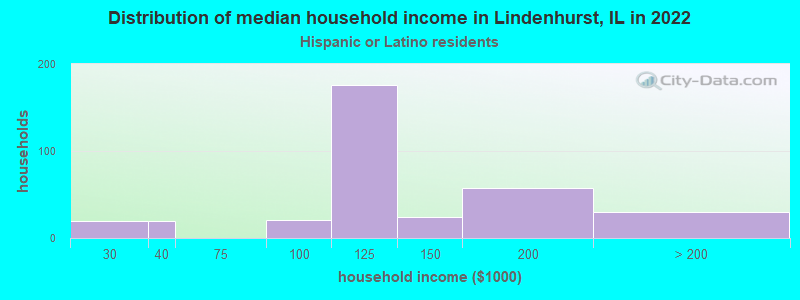
Income and house value in Lindenhurst Median household income in 2022 $122,242 White non-Hispanic householders$132,009 Black householdersover $200,000 Asian householders$151,614 Some other race householders$116,256 Two or more races householders$119,087 Hispanic or Latino race householdersMedian 2022 house value $261,916 White Non-Hispanic householders$228,843 Black or African American householders $353,923 Asian householders$244,047 Some other race householders$313,484 Two or more races householders$238,404 Hispanic or Latino householders
Median age by race in Lindenhurst
42.3 Median age for White residents42.4 42.4 24.3 Median age for Black or African American residents21.1 28.8 14.3 Median age for American Indian / Alaska Native residents-671,532,846.0 -638,251,365.5 37.0 Median age for Asian residents41.2 30.4 -593,236,714.4 Median age for Native Hawaiian / Pacific Islander residents-658,536,584.7 -576,015,108.0 25.6 Median age for Other race residents14.1 28.1 25.8 Median age for Two or more races residents24.8 40.1 42.4 Median age for White alone residents43.1 42.2 24.9 Median age for Hispanic or Latino residents17.6 35.0
Owner/renter occupied households by race in Lindenhurst
House owners and renters - White residents 3,538 83.0% Owner occupied725 17.0% Renter occupiedHouse owners and renters - Black or African American residents 61 70.2% Owner occupied26 29.8% Renter occupiedHouse owners and renters - American Indian / Alaska Native residents 26 100.0% Owner occupiedHouse owners and renters - Asian residents 250 78.2% Owner occupied70 21.8% Renter occupiedHouse owners and renters - Other race residents 30 59.0% Owner occupied21 41.0% Renter occupiedHouse owners and renters - Two or more races residents 232 84.9% Owner occupied41 15.1% Renter occupiedHouse owners and renters - White alone residents 3,535 82.7% Owner occupied738 17.3% Renter occupiedHouse owners and renters - Hispanic or Latino residents 243 74.8% Owner occupied82 25.2% Renter occupied
Language usage in Lindenhurst
English speakers - Total 83.3% of residents of Lindenhurst speak English at home.
5.8% of residents speak Spanish at home 555 71.5% Speak English very well221 28.5% Speak English less than very well10.3% of residents speak other language at home 989 72.2% Speak English very well380 27.8% Speak English less than very well
English speakers - Born in the United States 91.3% of residents of Lindenhurst speak English at home.
7.2% of residents speak Spanish at home 129 63.2% Speak English very well75 36.8% Speak English less than very well1.6% of residents speak other language at home 45 100.0% Speak English very well
English speakers - Native, born elsewhere 28.7% of residents of Lindenhurst speak English at home.
22.8% of residents speak Spanish at home 23 100.0% Speak English very well63.4% of residents speak other language at home 37 57.8% Speak English very well27 42.2% Speak English less than very well
English speakers - Foreign-born 16.4% of residents of Lindenhurst speak English at home.
18.7% of residents speak Spanish at home 164 58.8% Speak English very well115 41.2% Speak English less than very well63.5% of residents speak other language at home 619 65.4% Speak English very well327 34.6% Speak English less than very well
White (Caucasian) - Speak only English Native:
98.6% (9,464)Foreign-born:
34.1% (169)
White (Caucasian) - Speak another language Native:
3.1% (298)Foreign-born:
68.2% (338)
American Indian / Alaska Native - Speak another language Native:
97.7% (72)Foreign-born:
100.0% (29)
Asian - Speak only English Native:
52.7% (126)Foreign-born:
7.1% (41)
Asian - Speak another language Native:
40.4% (96)Foreign-born:
93.1% (534)
Other race - Speak another language Native:
50.9% (161)Foreign-born:
94.8% (54)
Two or more races - Speak only English Native:
71.5% (624)Foreign-born:
8.8% (18)
Two or more races - Speak another language Native:
25.8% (225)Foreign-born:
90.7% (188)
White alone - Speak only English Native:
96.3% (9,245)Foreign-born:
27.8% (148)
White alone - Speak another language Native:
3.7% (357)Foreign-born:
72.1% (382)
Hispanic or Latino - Speak only English Native:
68.4% (756)Foreign-born:
16.7% (55)
Hispanic or Latino - Speak another language Native:
34.0% (375)Foreign-born:
86.3% (282)
Foreign-born residents in Lindenhurst 1,427 residents are foreign born (4.5% Asia , 2.8% Europe , 2.2% Latin America ).
This city:
10.0%Illinois:
14.1%
Marital status for residents in Lindenhurst Marital status - White (Caucasian) population 15 years and over
Males 26.3% Never married63.3% Now married0.8% Separated2.6% Widowed7.0% DivorcedFemales 22.2% Never married58.3% Now married1.2% Separated8.3% Widowed10.0% DivorcedWomen who gave birth in the past 12 months Now married:
100.0% (65)Unmarried:
0.0% (0)
Women who did not give birth in the past 12 months Now married:
56.3% (1,364)Unmarried:
43.7% (1,060)
Marital status - Black or African American population 15 years and over
Males 49.7% Never married50.3% Now married0.0% Separated0.0% Widowed0.0% DivorcedFemales 42.0% Never married51.4% Now married0.0% Separated0.0% Widowed6.5% DivorcedWomen who gave birth in the past 12 months Now married:
100.0% (12)Unmarried:
0.0% (0)
Women who did not give birth in the past 12 months Now married:
50.0% (53)Unmarried:
50.0% (53)
Marital status - American Indian / Alaska Native population 15 years and over
Males 100.0% Never married0.0% Now married0.0% Separated0.0% Widowed0.0% DivorcedFemales 0.0% Never married0.0% Now married100.0% Separated0.0% Widowed0.0% DivorcedWomen who did not give birth in the past 12 months Now married:
100.0% (28)Unmarried:
0.0% (0)
Marital status - Asian population 15 years and over
Males 6.3% Never married91.8% Now married0.0% Separated0.0% Widowed1.9% DivorcedFemales 16.7% Never married61.8% Now married0.0% Separated18.9% Widowed2.6% DivorcedWomen who gave birth in the past 12 months Now married:
100.0% (18)Unmarried:
0.0% (0)
Women who did not give birth in the past 12 months Now married:
65.9% (85)Unmarried:
34.1% (44)
Marital status - Other race population 15 years and over
Males 7.5% Never married92.5% Now married0.0% Separated0.0% Widowed0.0% DivorcedFemales 38.4% Never married61.6% Now married0.0% Separated0.0% Widowed0.0% DivorcedWomen who gave birth in the past 12 months Now married:
0.0% (0)Unmarried:
100.0% (12)
Women who did not give birth in the past 12 months Now married:
63.2% (85)Unmarried:
36.8% (49)
Marital status - Two or more races population 15 years and over
Males 50.0% Never married41.2% Now married0.0% Separated1.3% Widowed7.5% DivorcedFemales 18.7% Never married81.3% Now married0.0% Separated0.0% Widowed0.0% DivorcedWomen who gave birth in the past 12 months Now married:
100.0% (43)Unmarried:
0.0% (0)
Women who did not give birth in the past 12 months Now married:
72.4% (130)Unmarried:
27.6% (50)
Marital status - White alone, not Hispanic / Latino population 15 years and over
Males 25.3% Never married64.0% Now married0.8% Separated2.8% Widowed7.1% DivorcedFemales 22.1% Never married58.8% Now married1.1% Separated8.1% Widowed9.8% DivorcedWomen who gave birth in the past 12 months Now married:
100.0% (69)Unmarried:
0.0% (0)
Women who did not give birth in the past 12 months Now married:
56.3% (1,379)Unmarried:
43.7% (1,072)
Marital status - Hispanic or Latino population 15 years and over
Males 38.1% Never married54.9% Now married0.0% Separated0.0% Widowed7.0% DivorcedFemales 24.5% Never married60.9% Now married4.8% Separated4.8% Widowed5.0% DivorcedWomen who gave birth in the past 12 months Now married:
61.3% (20)Unmarried:
38.7% (12)
Women who did not give birth in the past 12 months Now married:
65.3% (243)Unmarried:
34.7% (129)
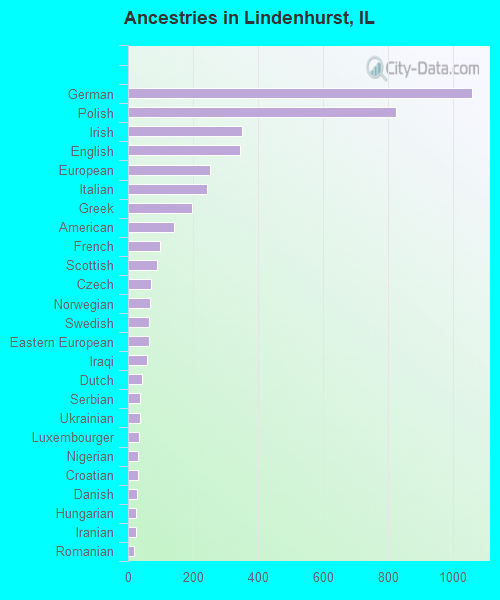
Ancestries in Lindenhurst
1,058 16.7% German825 13.0% Polish352 5.6% Irish346 5.5% English253 4.0% European244 3.8% Italian198 3.1% Greek142 2.2% American98 1.5% French90 1.4% Scottish71 1.1% Czech69 1.1% Norwegian66 1.0% Swedish65 1.0% Eastern European58 0.9% Iraqi43 0.7% Dutch38 0.6% Serbian38 0.6% Ukrainian35 0.6% Luxembourger31 0.5% Nigerian30 0.5% Croatian28 0.4% Danish25 0.4% Hungarian25 0.4% Iranian18 0.3% Romanian18 0.3% Finnish17 0.3% Belizean13 0.2% Czechoslovakian10 0.2% Russian9 0.1% Scandinavian8 0.1% Estonian8 0.1% Bulgarian8 0.1% Swiss7 0.1% Belgian7 0.1% Slovene6 0.09% Scotch-Irish6 0.09% French Canadian5 0.08% Pennsylvania German4 0.06% Lithuanian4 0.06% British2 0.03% Armenian
Children Nativity (place of birth) in Lindenhurst
Children under 6 years - Living with two parents Both parents native 941 100.0% NativeBoth parents foreign-born 102 100.0% NativeOne native, one foreign-born parent 88 100.0% NativeChildren under 6 years - Living with one parent Native parent 78 100.0% NativeForeign-born parent 8 100.0% NativeChildren 6 to 17 years - Living with two parents Both parents native 1,265 100.0% NativeBoth parents foreign-born 239 82.9% Native49 17.1% Foreign-bornOne native, one foreign-born parent 211 100.0% NativeChildren 6 to 17 years - Living with one parent Native parent 288 100.0% NativeForeign-born parent 57 51.8% Native53 48.2% Foreign-born
Grandparents responsible for own grandchildren in Lindenhurst
Grandparents (30 to 59 years) White / Caucasian 52 65.2% Responsible for grandchildren28 34.8% Not responsible for grandchildrenAsian 11 100.0% Not responsible for grandchildrenOther race 30 100.0% Not responsible for grandchildrenWhite alone, not Hispanic / Latino 66 69.5% Responsible for grandchildren29 30.5% Not responsible for grandchildrenHispanic or Latino 14 100.0% Not responsible for grandchildrenGrandparents (60 years and over) White / Caucasian 57 69.7% Responsible for grandchildren25 30.3% Not responsible for grandchildrenAsian 39 100.0% Not responsible for grandchildrenWhite alone, not Hispanic / Latino 69 67.4% Responsible for grandchildren33 32.6% Not responsible for grandchildrenHispanic or Latino 16 100.0% Not responsible for grandchildren