Races in Linganore-Bartonsville, Maryland (MD) Detailed Stats
Ancestries, Foreign-born residents, place of birth

Discuss Linganore-Bartonsville, Maryland races on our local forum with over 2,400,000 registered users
4.2% of Linganore-Bartonsville, MD residents are foreign-born (1.6% born in Europe, 1.2% born in Asia, 0.6% born in Africa, 0.4% born in Latin America), which is 283.3% less than the foreign-born rate of 16.0% across the entire state of Maryland.
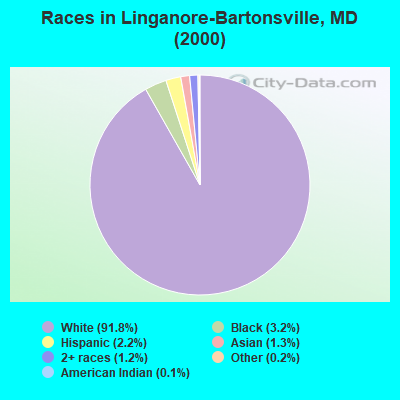
Race distribution in Linganore-Bartonsville

- 11,50391.8%White alone
- 4043.2%Black alone
- 2702.2%Hispanic
- 1611.3%Asian alone
- 1511.2%Two or more races
- 190.2%Other race alone
- 160.1%American Indian alone
- 50.04%Native Hawaiian and Other
Pacific Islander alone
2000
2022
-
- 3,286,54762.1%White alone
- 1,464,73527.7%Black alone
- 227,9164.3%Hispanic
- 209,7384.0%Asian alone
- 82,9461.6%Two or more races
- 13,3120.3%American Indian alone
- 9,3790.2%Other race alone
- 1,9130.04%Native Hawaiian and Other
Pacific Islander alone

-
- 2,906,49247.1%White alone
- 1,800,91429.2%Black alone
- 705,84211.4%Hispanic
- 401,8186.5%Asian alone
- 291,3174.7%Two or more races
- 46,9300.8%Other race alone
- 8,9300.1%American Indian alone
- 2,4170.04%Native Hawaiian and Other
Pacific Islander alone

Income and house value in Linganore-Bartonsville
- Median household income in 2022
- $149,050White non-Hispanic householders
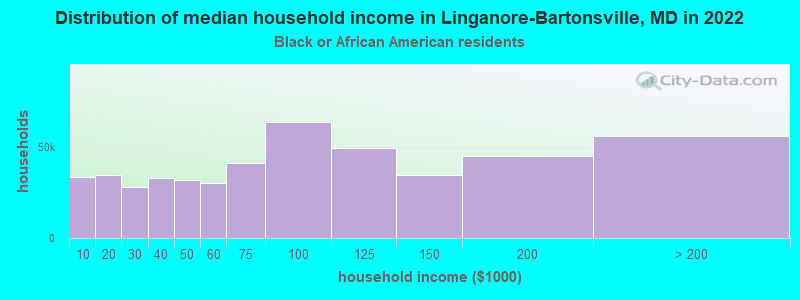
- $182,281Black householders
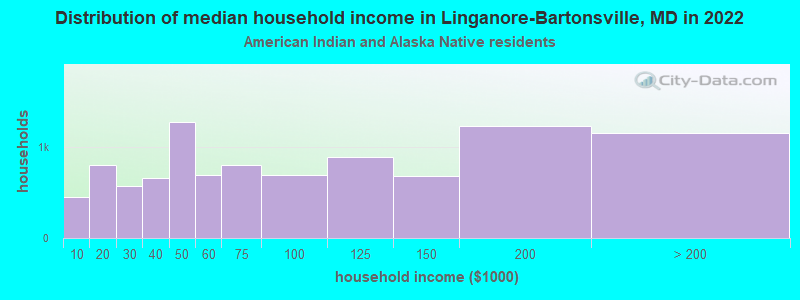
- $116,816American Indian and Alaska Native householders
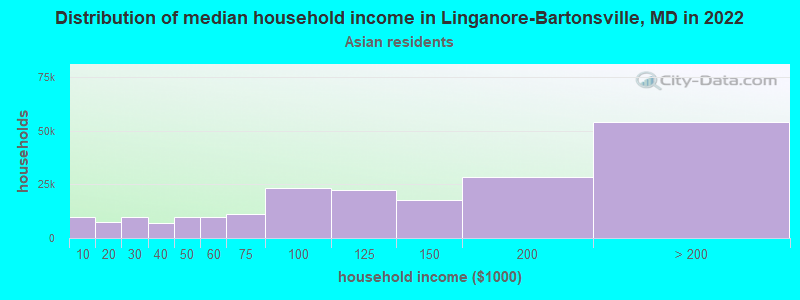
- over $200,000Asian householders
- $104,100Some other race householders
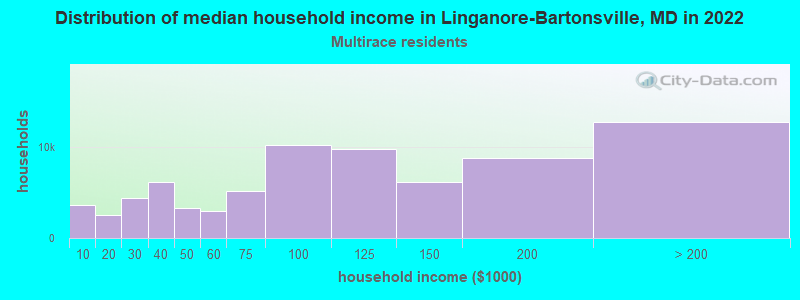
- $109,813Two or more races householders
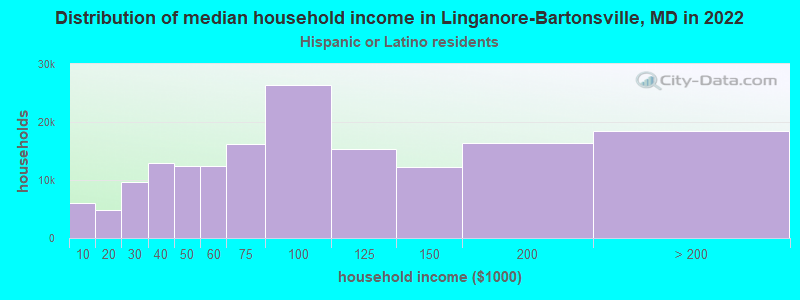
- $194,768Hispanic or Latino race householders
- Median 2022 house value
- $489,728White Non-Hispanic householders
- $379,898Black or African American householders
- $454,244Asian householders
- $445,233Some other race householders
- $538,166Two or more races householders
- $459,032Hispanic or Latino householders
Household income for White non-Hispanic householders

Household income for Black householders
Household income for American Indian and Alaska Native householders
Household income for Asian householders
Household income for Two or more races householders
Household income for Hispanic or Latino race householders
Foreign-born residents in Linganore-Bartonsville
523 residents are foreign born (1.6% Europe, 1.2% Asia, 0.6% Africa, 0.4% Latin America).
| This city: | 4.2% |
| Maryland: | 9.8% |
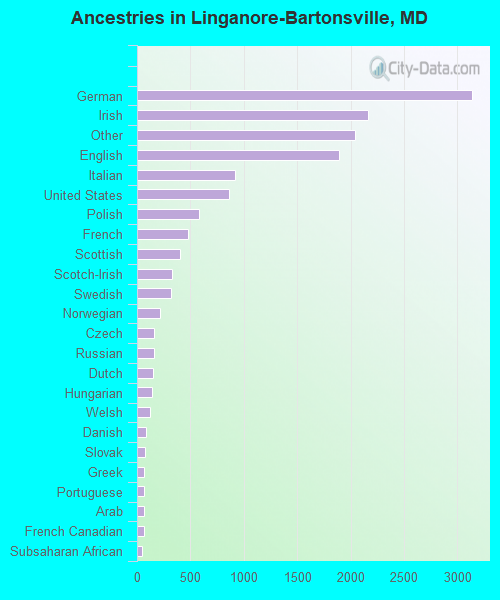
Ancestries in Linganore-Bartonsville

- 3,13921.5%German
- 2,16014.8%Irish
- 2,04114.0%Other
- 1,89013.0%English
- 9146.3%Italian
- 8625.9%United States
- 5854.0%Polish
- 4763.3%French
- 4062.8%Scottish
- 3262.2%Scotch-Irish
- 3192.2%Swedish
- 2181.5%Norwegian
- 1611.1%Czech
- 1581.1%Russian
- 1511.0%Dutch
- 1451.0%Hungarian
- 1260.9%Welsh
- 810.6%Danish
- 790.5%Slovak
- 690.5%Greek
- 660.5%Portuguese
- 650.4%Arab
- 620.4%French Canadian
- 460.3%Subsaharan African
- 220.2%Swiss
- 110.08%Lithuanian
- 80.05%Ukrainian
Zip codes: 21701.