Races in Litchfield, Maine (ME) Detailed Stats
Ancestries, Foreign-born residents, place of birth
1.0% of Litchfield, ME residents are foreign-born , which is 201.0% less than the foreign-born rate of 3.0% across the entire state of Maine.
Race distribution in Litchfield

- 3,04497.9%White alone
- 250.8%Hispanic
- 180.6%Two or more races
- 130.4%Asian alone
- 80.3%American Indian alone
- 10.03%Black alone
- 10.03%Other race alone

2000
2022
-
- 1,230,29796.5%White alone
- 11,7310.9%Two or more races
- 9,3600.7%Hispanic
- 9,0140.7%Asian alone
- 6,4400.5%Black alone
- 6,9110.5%American Indian alone
- 8360.07%Other race alone
- 3340.03%Native Hawaiian and Other
Pacific Islander alone

-
- 1,249,23390.2%White alone
- 58,3574.2%Two or more races
- 28,7172.1%Hispanic
- 21,5831.6%Black alone
- 16,1511.2%Asian alone
- 5,8730.4%Other race alone
- 5,2050.4%American Indian alone
- 2210.02%Native Hawaiian and Other
Pacific Islander alone

Income and house value in Litchfield
- Median household income in 2022
- $71,528White non-Hispanic householders
- $54,808Asian householders
- $53,639Two or more races householders
- $76,723Hispanic or Latino race householders
- Median 2022 house value
- $263,153White Non-Hispanic householders
- $373,797Two or more races householders
- $373,797Hispanic or Latino householders
Household income for White non-Hispanic householders

Household income for American Indian and Alaska Native householders

Household income for Asian householders

Household income for Two or more races householders

Household income for Hispanic or Latino race householders

Foreign-born residents in Litchfield
31 residents are foreign born
| This city: | 1.0% |
| Maine: | 2.9% |
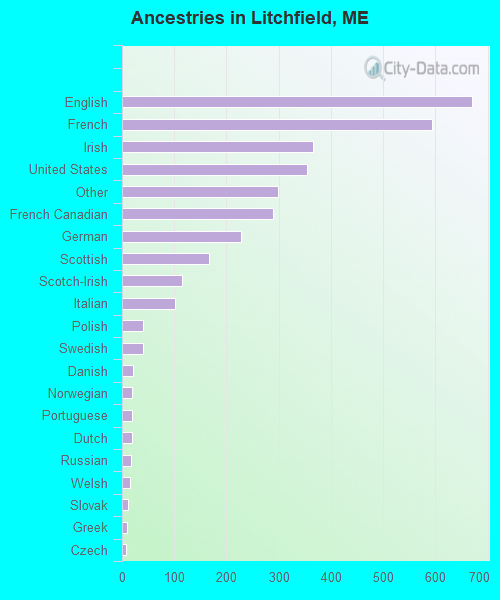
Ancestries in Litchfield

- 66919.5%English
- 59417.4%French
- 36610.7%Irish
- 35410.3%United States
- 2998.7%Other
- 2898.4%French Canadian
- 2286.7%German
- 1674.9%Scottish
- 1143.3%Scotch-Irish
- 1013.0%Italian
- 401.2%Polish
- 401.2%Swedish
- 210.6%Danish
- 200.6%Norwegian
- 200.6%Portuguese
- 190.6%Dutch
- 170.5%Russian
- 160.5%Welsh
- 110.3%Slovak
- 90.3%Greek
- 70.2%Czech
- 60.2%Hungarian
- 60.2%Ukrainian
- 50.1%Lithuanian
- 50.1%Swiss
Zip codes: 04350.