Races in Little Compton, Rhode Island (RI) Detailed Stats
Ancestries, Foreign-born residents, place of birth

Recent posts about races in Little Compton, Rhode Island on our local forum with over 2,400,000 registered users:
 | Top Democrats Flock to One of Whitest and Most Affluent RI Communities (138 replies) |
| ATV riders taunt and threaten Providence police officers (60 replies) |
| Coastal Rhode Island for Retirement (46 replies) |
| Governors race (205 replies) |
| WOW! What's going on with Westerly Real Estate? (81 replies) |
| How Good (or Bad) Is It Living In RI? (257 replies) |
3.7% of Little Compton, RI residents are foreign-born (2.8% born in Europe), which is 281.1% less than the foreign-born rate of 14.0% across the entire state of Rhode Island.
Race distribution in Little Compton

- 3,52298.0%White alone
- 310.9%Hispanic
- 200.6%Two or more races
- 80.2%Asian alone
- 60.2%American Indian alone
- 30.08%Native Hawaiian and Other
Pacific Islander alone - 20.06%Black alone
- 10.03%Other race alone

2000
2022
-
- 858,43381.9%White alone
- 90,8208.7%Hispanic
- 41,9224.0%Black alone
- 23,4162.2%Asian alone
- 20,8162.0%Two or more races
- 8,4110.8%Other race alone
- 4,1810.4%American Indian alone
- 3200.03%Native Hawaiian and Other
Pacific Islander alone

-
- 745,82568.2%White alone
- 191,97917.6%Hispanic
- 56,7385.2%Two or more races
- 51,3264.7%Black alone
- 37,2343.4%Asian alone
- 9,5140.9%Other race alone
- 9780.09%American Indian alone
- 1400.01%Native Hawaiian and Other
Pacific Islander alone

Income and house value in Little Compton
- Median household income in 2022
- $101,946White non-Hispanic householders
- over $200,000Asian householders
- $155,560Hispanic or Latino race householders
- Median 2022 house value
- $863,818White Non-Hispanic householders
- $614,851Asian householders
- over $1,000,000Hispanic or Latino householders
Household income for White non-Hispanic householders

Household income for American Indian and Alaska Native householders

Household income for Asian householders

Household income for Hispanic or Latino race householders

Foreign-born residents in Little Compton
132 residents are foreign born (2.8% Europe).
| This city: | 3.7% |
| Rhode Island: | 11.4% |
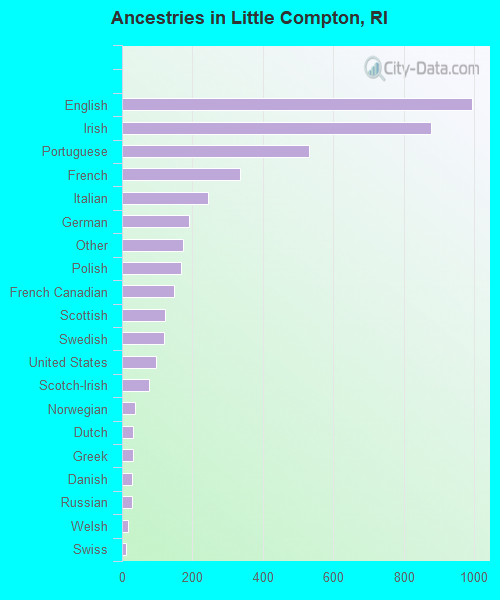
Ancestries in Little Compton

- 99323.1%English
- 87920.5%Irish
- 53212.4%Portuguese
- 3357.8%French
- 2455.7%Italian
- 1904.4%German
- 1744.1%Other
- 1683.9%Polish
- 1473.4%French Canadian
- 1232.9%Scottish
- 1182.7%Swedish
- 962.2%United States
- 771.8%Scotch-Irish
- 370.9%Norwegian
- 300.7%Dutch
- 300.7%Greek
- 290.7%Danish
- 290.7%Russian
- 170.4%Welsh
- 100.2%Swiss
- 90.2%Arab
- 70.2%Hungarian
- 70.2%Subsaharan African
- 60.1%Czech
- 60.1%Ukrainian
Zip codes: 02837.