Races in Little Cottonwood Creek Valley, Utah (UT) Detailed Stats
Ancestries, Foreign-born residents, place of birth

Discuss Little Cottonwood Creek Valley, Utah races on our local forum with over 2,400,000 registered users
4.0% of Little Cottonwood Creek Valley, UT residents are foreign-born (2.0% born in Europe, 1.1% born in Asia, 0.6% born in North America), which is 99.9% less than the foreign-born rate of 8.0% across the entire state of Utah.
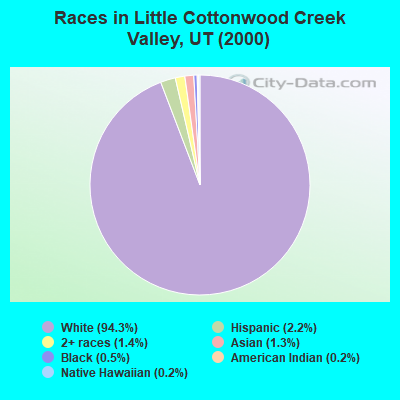
Race distribution in Little Cottonwood Creek Valley

- 6,80994.3%White alone
- 1622.2%Hispanic
- 1001.4%Two or more races
- 911.3%Asian alone
- 360.5%Black alone
- 110.2%Native Hawaiian and Other
Pacific Islander alone - 120.2%American Indian alone
2000
2022
-
- 1,904,26585.3%White alone
- 201,5599.0%Hispanic
- 36,4831.6%Asian alone
- 31,3081.4%Two or more races
- 26,6631.2%American Indian alone
- 14,8060.7%Native Hawaiian and Other
Pacific Islander alone - 16,1370.7%Black alone
- 1,9480.09%Other race alone

-
- 2,557,46675.6%White alone
- 512,08615.1%Hispanic
- 119,3083.5%Two or more races
- 82,3882.4%Asian alone
- 36,9781.1%Native Hawaiian and Other
Pacific Islander alone - 34,8731.0%Black alone
- 22,8030.7%American Indian alone
- 14,8980.4%Other race alone

Income and house value in Little Cottonwood Creek Valley
- Median household income in 2022
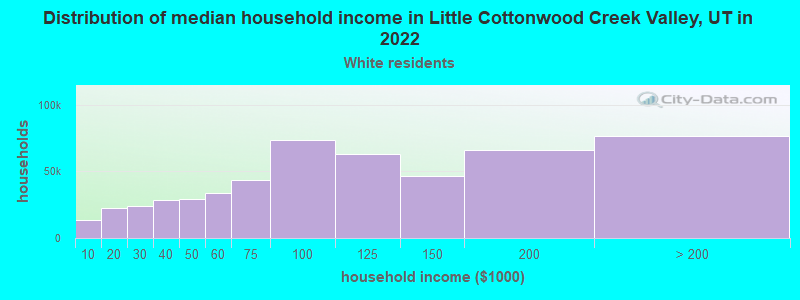
- $154,458White non-Hispanic householders
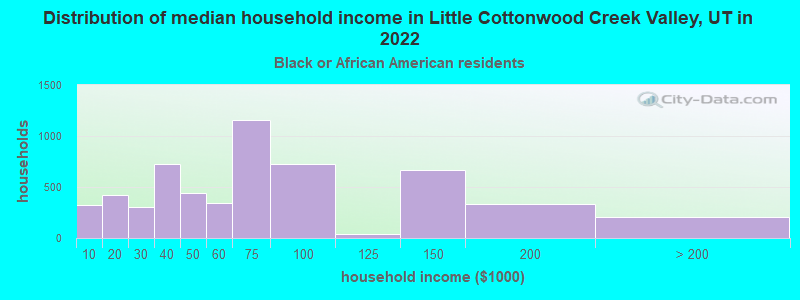
- $35,079Black householders
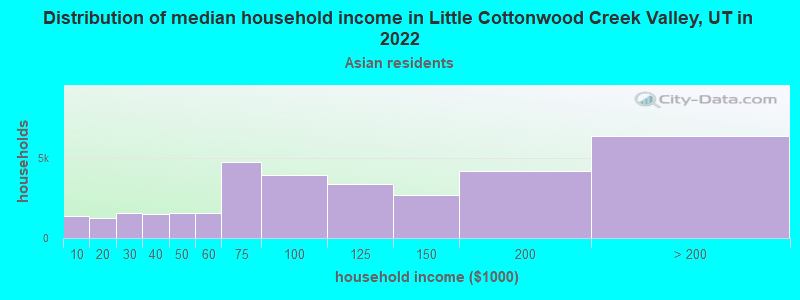
- $185,748Asian householders
- $82,404Some other race householders
- $38,518Two or more races householders
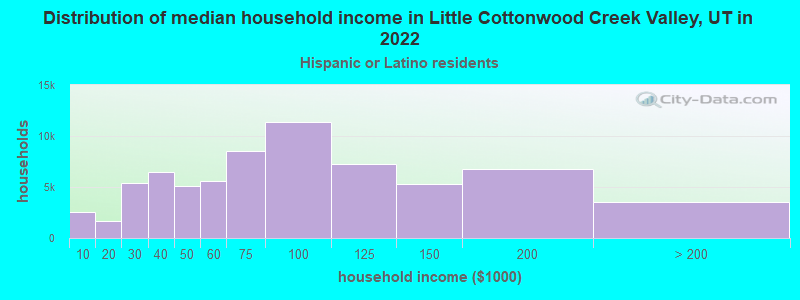
- $80,378Hispanic or Latino race householders
- Median 2022 house value
- over $1,000,000White Non-Hispanic householders
- over $1,000,000Black or African American householders
- $819,582Asian householders
- $392,687Some other race householders
- $485,536Hispanic or Latino householders
Household income for White non-Hispanic householders
Household income for Black householders
Household income for Asian householders
Household income for Two or more races householders
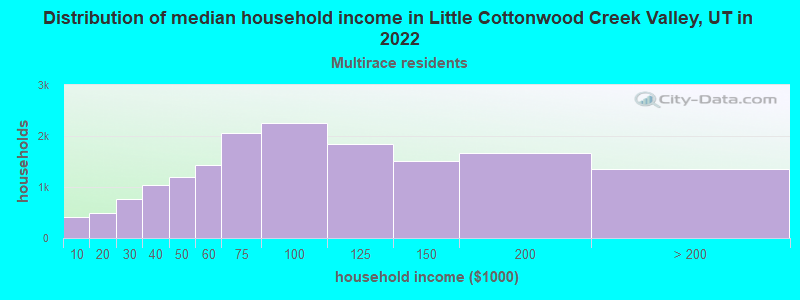
Household income for Hispanic or Latino race householders
Foreign-born residents in Little Cottonwood Creek Valley
289 residents are foreign born (2.0% Europe, 1.1% Asia, 0.6% North America).
| This city: | 4.0% |
| Utah: | 7.1% |
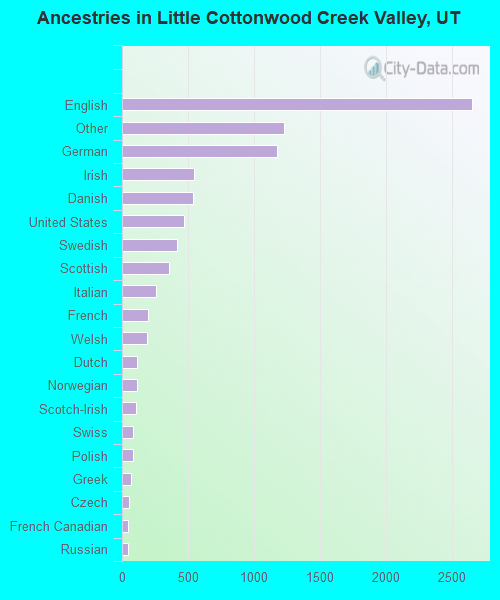
Ancestries in Little Cottonwood Creek Valley

- 2,65130.2%English
- 1,22514.0%Other
- 1,17413.4%German
- 5456.2%Irish
- 5376.1%Danish
- 4695.3%United States
- 4154.7%Swedish
- 3584.1%Scottish
- 2582.9%Italian
- 2002.3%French
- 1892.2%Welsh
- 1151.3%Dutch
- 1111.3%Norwegian
- 1031.2%Scotch-Irish
- 861.0%Swiss
- 800.9%Polish
- 700.8%Greek
- 530.6%Czech
- 430.5%French Canadian
- 420.5%Russian
- 190.2%Ukrainian
- 170.2%Hungarian
- 60.07%Arab
- 30.03%Lithuanian
Zip codes: 84093.