Races in Logan Hill, Washington (WA) Detailed Stats
Ancestries, Foreign-born residents, place of birth
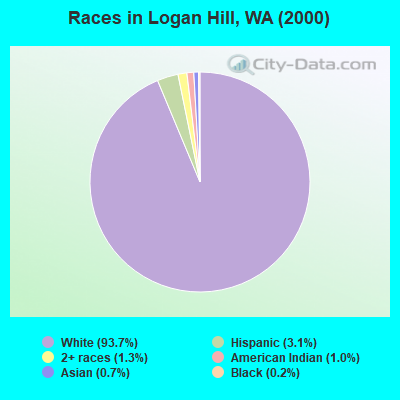
Race distribution in Logan Hill

- 3,15193.7%White alone
- 1033.1%Hispanic
- 431.3%Two or more races
- 321.0%American Indian alone
- 240.7%Asian alone
- 70.2%Black alone
- 20.06%Native Hawaiian and Other
Pacific Islander alone
2000
2022
-
- 4,652,49078.9%White alone
- 441,5097.5%Hispanic
- 319,4015.4%Asian alone
- 184,6313.1%Black alone
- 175,9263.0%Two or more races
- 85,3961.4%American Indian alone
- 22,7790.4%Native Hawaiian and Other
Pacific Islander alone - 11,9890.2%Other race alone

-
- 4,941,45663.5%White alone
- 1,093,31314.0%Hispanic
- 755,8329.7%Asian alone
- 523,4486.7%Two or more races
- 299,5373.8%Black alone
- 69,0240.9%American Indian alone
- 52,2310.7%Native Hawaiian and Other
Pacific Islander alone - 50,9450.7%Other race alone

Income and house value in Logan Hill
- Median household income in 2022
- $85,545White non-Hispanic householders
- $111,686American Indian and Alaska Native householders
- $96,169Some other race householders
- $27,421Two or more races householders
- $67,123Hispanic or Latino race householders
- Median 2022 house value
- $488,444White Non-Hispanic householders
- $215,831Some other race householders
- $676,051Two or more races householders
- $533,602Hispanic or Latino householders
Household income for White non-Hispanic householders

Household income for American Indian and Alaska Native householders

Household income for Asian householders

Household income for Two or more races householders

Household income for Hispanic or Latino race householders

Zip code: 98531