Races in Logan, Utah (UT) Detailed Stats
Data:
Races - White alone (%)
Races - White alone (% change since 2000)
Races - Black alone (%)
Races - Black alone (% change since 2000)
Races - American Indian alone (%)
Races - American Indian alone (% change since 2000)
Races - Asian alone (%)
Races - Asian alone (% change since 2000)
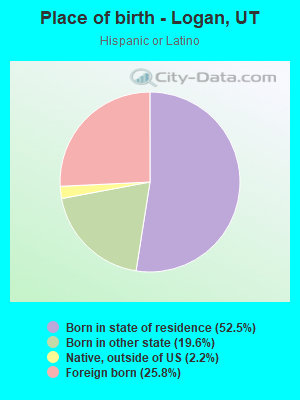
Races - Hispanic (%)
Races - Hispanic (% change since 2000)
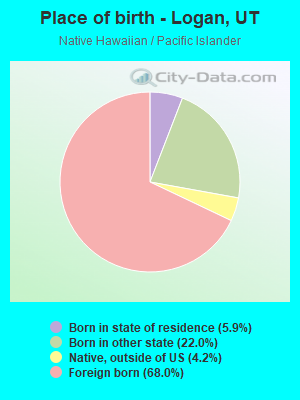
Races - Native Hawaiian and Other Pacific Islander alone (%)
Races - Native Hawaiian and Other Pacific Islander alone (% change since 2000)
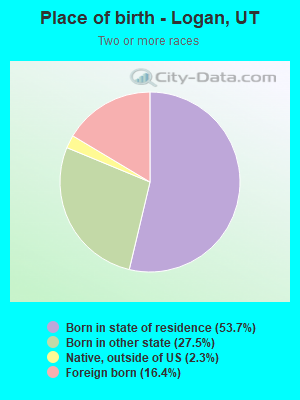
Races - Two or more races(%)
Races - Two or more races(% change since 2000)
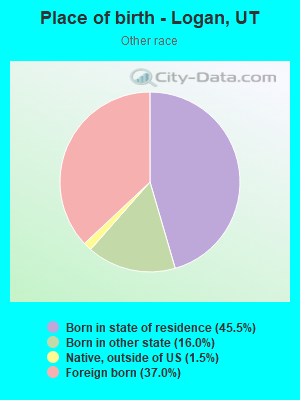
Races - Other race alone (%)
Races - Other race alone (% change since 2000)
Racial diversity
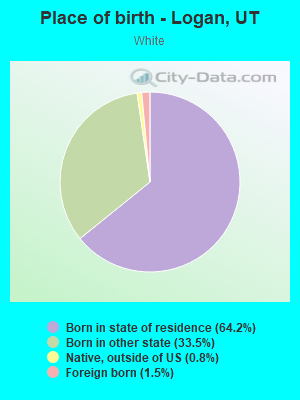
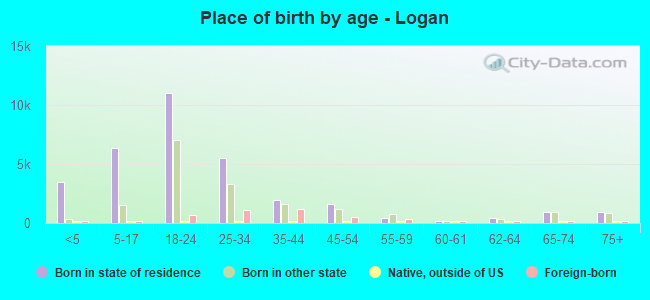
Place of birth - Born in state of residence (%)
Place of birth - Born in state of residence (%) - White
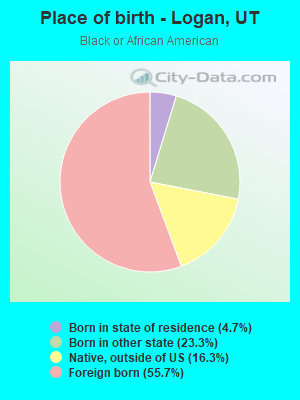
Place of birth - Born in state of residence (%) - Black or African American
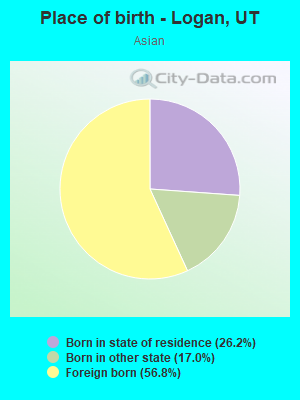
Place of birth - Born in state of residence (%) - Asian
Place of birth - Born in state of residence (%) - Hispanic or Latino
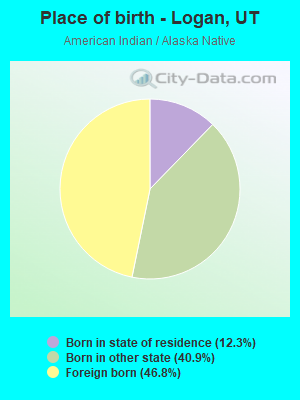
Place of birth - Born in state of residence (%) - American Indian and Alaska Native
Place of birth - Born in state of residence (%) - Multirace
Place of birth - Born in state of residence (%) - Other Race
Place of birth - Born in other state (%)
Place of birth - Born in other state (%) - White
Place of birth - Born in other state (%) - Black or African American
Place of birth - Born in other state (%) - Asian
Place of birth - Born in other state (%) - Hispanic or Latino
Place of birth - Born in other state (%) - American Indian and Alaska Native
Place of birth - Born in other state (%) - Multirace
Place of birth - Born in other state (%) - Other Race
Place of birth - Native, outside of US (%)
Place of birth - Native, outside of US (%) - White
Place of birth - Native, outside of US (%) - Black or African American
Place of birth - Native, outside of US (%) - Asian
Place of birth - Native, outside of US (%) - Hispanic or Latino
Place of birth - Native, outside of US (%) - American Indian and Alaska Native
Place of birth - Native, outside of US (%) - Multirace
Place of birth - Native, outside of US (%) - Other Race
Place of birth - Foreign born (%)
Place of birth - Foreign born (%) - White
Place of birth - Foreign born (%) - Black or African American
Place of birth - Foreign born (%) - Asian
Place of birth - Foreign born (%) - Hispanic or Latino
Place of birth - Foreign born (%) - American Indian and Alaska Native
Place of birth - Foreign born (%) - Multirace
Place of birth - Foreign born (%) - Other Race
Residents speaking English at home (%)
Residents speaking English at home - Born in the United States (%)
Residents speaking English at home - Native, born elsewhere (%)
Residents speaking English at home - Foreign born (%)
Residents speaking Spanish at home (%)
Residents speaking Spanish at home - Born in the United States (%)
Residents speaking Spanish at home - Native, born elsewhere (%)
Residents speaking Spanish at home - Foreign born (%)
Residents speaking other language at home (%)
Residents speaking other language at home - Born in the United States (%)
Residents speaking other language at home - Native, born elsewhere (%)
Residents speaking other language at home - Foreign born (%)
Marital status - Never married (%)
Marital status - Now married (%)
Marital status - Separated (%)
Marital status - Widowed (%)
Marital status - Divorced (%)
Ancestries Reported - Arab (%)
Ancestries Reported - Czech (%)
Ancestries Reported - Danish (%)
Ancestries Reported - Dutch (%)
Ancestries Reported - English (%)
Ancestries Reported - French (%)
Ancestries Reported - French Canadian (%)
Ancestries Reported - German (%)
Ancestries Reported - Greek (%)
Ancestries Reported - Hungarian (%)
Ancestries Reported - Irish (%)
Ancestries Reported - Italian (%)
Ancestries Reported - Lithuanian (%)
Ancestries Reported - Norwegian (%)
Ancestries Reported - Polish (%)
Ancestries Reported - Portuguese (%)
Ancestries Reported - Russian (%)
Ancestries Reported - Scotch-Irish (%)
Ancestries Reported - Scottish (%)
Ancestries Reported - Slovak (%)
Ancestries Reported - Subsaharan African (%)
Ancestries Reported - Swedish (%)
Ancestries Reported - Swiss (%)
Ancestries Reported - Ukrainian (%)
Ancestries Reported - United States (%)
Ancestries Reported - Welsh (%)
Ancestries Reported - West Indian (%)
Ancestries Reported - Other (%)
Geographical mobility - Same house 1 year ago (%)
Geographical mobility - Same house 1 year ago (%) - White
Geographical mobility - Same house 1 year ago (%) - Black or African American
Geographical mobility - Same house 1 year ago (%) - Asian
Geographical mobility - Same house 1 year ago (%) - Hispanic or Latino
Geographical mobility - Same house 1 year ago (%) - American Indian and Alaska Native
Geographical mobility - Same house 1 year ago (%) - Multirace
Geographical mobility - Same house 1 year ago (%) - Other Race
Geographical mobility - Moved within same county (%)
Geographical mobility - Moved within same county (%) - White
Geographical mobility - Moved within same county (%) - Black or African American
Geographical mobility - Moved within same county (%) - Asian
Geographical mobility - Moved within same county (%) - Hispanic or Latino
Geographical mobility - Moved within same county (%) - American Indian and Alaska Native
Geographical mobility - Moved within same county (%) - Multirace
Geographical mobility - Moved within same county (%) - Other Race
Geographical mobility - Moved from different county within same state (%)
Geographical mobility - Moved from different county within same state (%) - White
Geographical mobility - Moved from different county within same state (%) - Black or African American
Geographical mobility - Moved from different county within same state (%) - Asian
Geographical mobility - Moved from different county within same state (%) - Hispanic or Latino
Geographical mobility - Moved from different county within same state (%) - American Indian and Alaska Native
Geographical mobility - Moved from different county within same state (%) - Multirace
Geographical mobility - Moved from different county within same state (%) - Other Race
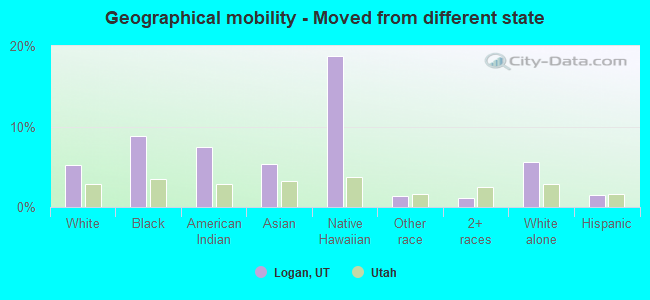
Geographical mobility - Moved from different state (%)
Geographical mobility - Moved from different state (%) - White
Geographical mobility - Moved from different state (%) - Black or African American
Geographical mobility - Moved from different state (%) - Asian
Geographical mobility - Moved from different state (%) - Hispanic or Latino
Geographical mobility - Moved from different state (%) - American Indian and Alaska Native
Geographical mobility - Moved from different state (%) - Multirace
Geographical mobility - Moved from different state (%) - Other Race
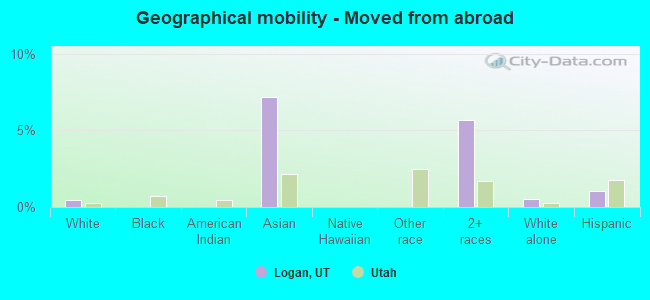
Geographical mobility - Moved from abroad (%)
Geographical mobility - Moved from abroad (%) - White
Geographical mobility - Moved from abroad (%) - Black or African American
Geographical mobility - Moved from abroad (%) - Asian
Geographical mobility - Moved from abroad (%) - Hispanic or Latino
Geographical mobility - Moved from abroad (%) - American Indian and Alaska Native
Geographical mobility - Moved from abroad (%) - Multirace
Geographical mobility - Moved from abroad (%) - Other Race
Place of birth for the foreign-born population - Ireland (%)
Place of birth for the foreign-born population - Denmark (%)
Place of birth for the foreign-born population - Norway (%)
Place of birth for the foreign-born population - Sweden (%)
Place of birth for the foreign-born population - United Kingdom (%)
Place of birth for the foreign-born population - England (%)
Place of birth for the foreign-born population - Scotland (%)
Place of birth for the foreign-born population - Other Northern Europe (%)
Place of birth for the foreign-born population - Austria (%)
Place of birth for the foreign-born population - Belgium (%)
Place of birth for the foreign-born population - France (%)
Place of birth for the foreign-born population - Germany (%)
Place of birth for the foreign-born population - Netherlands (%)
Place of birth for the foreign-born population - Switzerland (%)
Place of birth for the foreign-born population - Other Western Europe (%)
Place of birth for the foreign-born population - Greece (%)
Place of birth for the foreign-born population - Italy (%)
Place of birth for the foreign-born population - Portugal (%)
Place of birth for the foreign-born population - Spain (%)
Place of birth for the foreign-born population - Other Southern Europe (%)
Place of birth for the foreign-born population - Albania (%)
Place of birth for the foreign-born population - Belarus (%)
Place of birth for the foreign-born population - Bosnia and Herzegovina (%)
Place of birth for the foreign-born population - Bulgaria (%)
Place of birth for the foreign-born population - Croatia (%)
Place of birth for the foreign-born population - Czechoslovakia (%)
Place of birth for the foreign-born population - Hungary (%)
Place of birth for the foreign-born population - Latvia (%)
Place of birth for the foreign-born population - Lithuania (%)
Place of birth for the foreign-born population - North Macedonia (Macedonia) (%)
Place of birth for the foreign-born population - Moldova (%)
Place of birth for the foreign-born population - Poland (%)
Place of birth for the foreign-born population - Romania (%)
Place of birth for the foreign-born population - Russia (%)
Place of birth for the foreign-born population - Serbia (%)
Place of birth for the foreign-born population - Ukraine (%)
Place of birth for the foreign-born population - Other Eastern Europe (%)
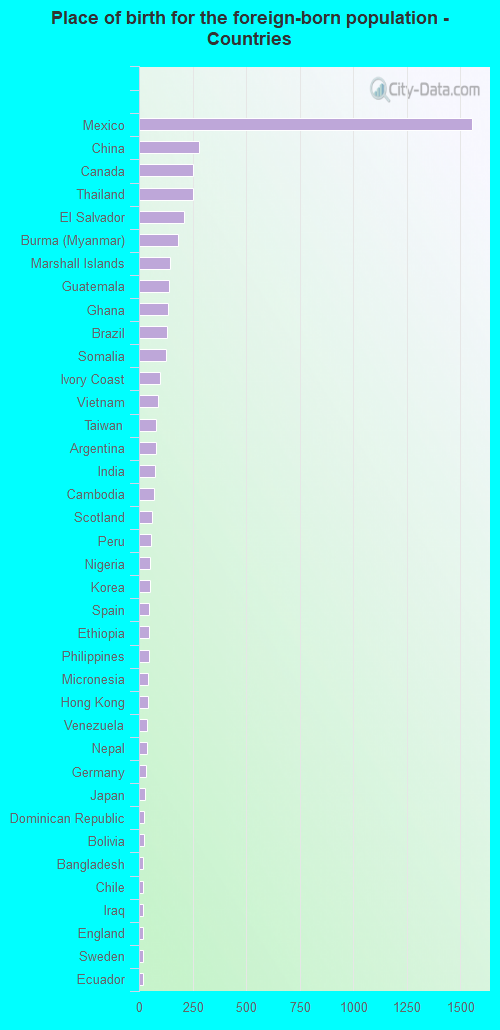
Place of birth for the foreign-born population - China (%)
Place of birth for the foreign-born population - Hong Kong (%)
Place of birth for the foreign-born population - Taiwan (%)
Place of birth for the foreign-born population - Japan (%)
Place of birth for the foreign-born population - Korea (%)
Place of birth for the foreign-born population - Other Eastern Asia (%)
Place of birth for the foreign-born population - Afghanistan (%)
Place of birth for the foreign-born population - Bangladesh (%)
Place of birth for the foreign-born population - India (%)
Place of birth for the foreign-born population - Iran (%)
Place of birth for the foreign-born population - Kazakhstan (%)
Place of birth for the foreign-born population - Nepal (%)
Place of birth for the foreign-born population - Pakistan (%)
Place of birth for the foreign-born population - Sri Lanka (%)
Place of birth for the foreign-born population - Uzbekistan (%)
Place of birth for the foreign-born population - Other South Central Asia (%)
Place of birth for the foreign-born population - Burma (%)
Place of birth for the foreign-born population - Cambodia (%)
Place of birth for the foreign-born population - Indonesia (%)
Place of birth for the foreign-born population - Laos (%)
Place of birth for the foreign-born population - Malaysia (%)
Place of birth for the foreign-born population - Philippines (%)
Place of birth for the foreign-born population - Singapore (%)
Place of birth for the foreign-born population - Thailand (%)
Place of birth for the foreign-born population - Vietnam (%)
Place of birth for the foreign-born population - Other South Eastern Asia (%)
Place of birth for the foreign-born population - Armenia (%)
Place of birth for the foreign-born population - Iraq (%)
Place of birth for the foreign-born population - Israel (%)
Place of birth for the foreign-born population - Jordan (%)
Place of birth for the foreign-born population - Kuwait (%)
Place of birth for the foreign-born population - Lebanon (%)
Place of birth for the foreign-born population - Saudi Arabia (%)
Place of birth for the foreign-born population - Syria (%)
Place of birth for the foreign-born population - Turkey (%)
Place of birth for the foreign-born population - Yemen (%)
Place of birth for the foreign-born population - Other Western Asia (%)
Place of birth for the foreign-born population - Eritrea (%)
Place of birth for the foreign-born population - Ethiopia (%)
Place of birth for the foreign-born population - Kenya (%)
Place of birth for the foreign-born population - Somalia (%)
Place of birth for the foreign-born population - Uganda (%)
Place of birth for the foreign-born population - Zimbabwe (%)
Place of birth for the foreign-born population - Other Eastern Africa (%)
Place of birth for the foreign-born population - Cameroon (%)
Place of birth for the foreign-born population - Congo (%)
Place of birth for the foreign-born population - Democratic Republic of Congo (Zaire) (%)
Place of birth for the foreign-born population - Other Middle Africa (%)
Place of birth for the foreign-born population - Egypt (%)
Place of birth for the foreign-born population - Morocco (%)
Place of birth for the foreign-born population - Sudan (%)
Place of birth for the foreign-born population - Other Northern Africa (%)
Place of birth for the foreign-born population - South Africa (%)
Place of birth for the foreign-born population - Other Southern Africa (%)
Place of birth for the foreign-born population - Cabo Verde (%)
Place of birth for the foreign-born population - Ghana (%)
Place of birth for the foreign-born population - Liberia (%)
Place of birth for the foreign-born population - Nigeria (%)
Place of birth for the foreign-born population - Senegal (%)
Place of birth for the foreign-born population - Sierra Leone (%)
Place of birth for the foreign-born population - Other Western Africa (%)
Place of birth for the foreign-born population - Australia (%)
Place of birth for the foreign-born population - New Zealand (%)
Place of birth for the foreign-born population - Fiji (%)
Place of birth for the foreign-born population - Micronesia (%)
Place of birth for the foreign-born population - Bahamas (%)
Place of birth for the foreign-born population - Barbados (%)
Place of birth for the foreign-born population - Cuba (%)
Place of birth for the foreign-born population - Dominica (%)
Place of birth for the foreign-born population - Dominican Republic (%)
Place of birth for the foreign-born population - Grenada (%)
Place of birth for the foreign-born population - Haiti (%)
Place of birth for the foreign-born population - Jamaica (%)
Place of birth for the foreign-born population - St. Vincent and the Grenadines (%)
Place of birth for the foreign-born population - Trinidad and Tobago (%)
Place of birth for the foreign-born population - West Indies (%)
Place of birth for the foreign-born population - Other Caribbean (%)
Place of birth for the foreign-born population - Belize (%)
Place of birth for the foreign-born population - Costa Rica (%)
Place of birth for the foreign-born population - El Salvador (%)
Place of birth for the foreign-born population - Guatemala (%)
Place of birth for the foreign-born population - Honduras (%)
Place of birth for the foreign-born population - Mexico (%)
Place of birth for the foreign-born population - Nicaragua (%)
Place of birth for the foreign-born population - Panama (%)
Place of birth for the foreign-born population - Other Central America (%)
Place of birth for the foreign-born population - Argentina (%)
Place of birth for the foreign-born population - Bolivia (%)
Place of birth for the foreign-born population - Brazil (%)
Place of birth for the foreign-born population - Chile (%)
Place of birth for the foreign-born population - Colombia (%)
Place of birth for the foreign-born population - Ecuador (%)
Place of birth for the foreign-born population - Guyana (%)
Place of birth for the foreign-born population - Peru (%)
Place of birth for the foreign-born population - Uruguay (%)
Place of birth for the foreign-born population - Venezuela (%)
Place of birth for the foreign-born population - Other South America (%)
Place of birth for the foreign-born population - Canada (%)
Place of birth for the foreign-born population - Other Northern America (%)
Place of birth for the foreign-born population - Other (%)
Latest news about races in Logan, UT collected exclusively by city-data.com from local newspapers, TV, and radio stations
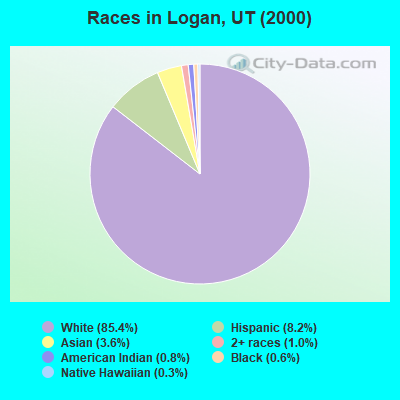
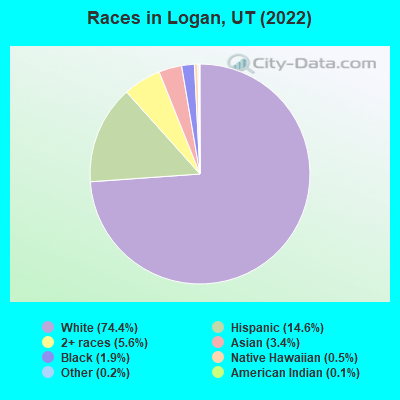
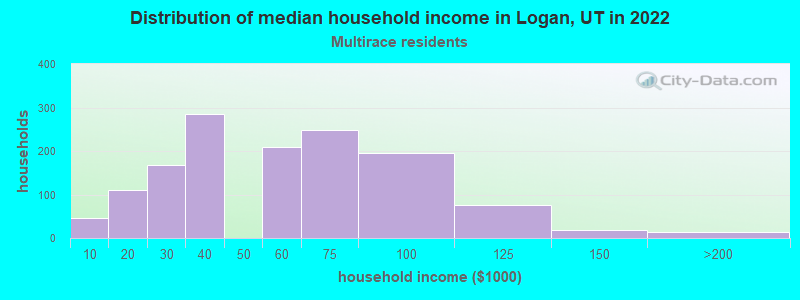
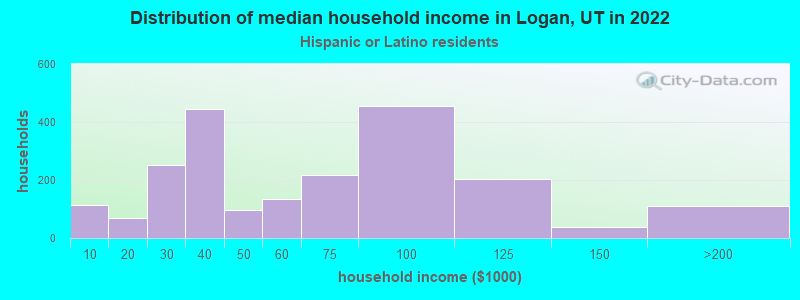
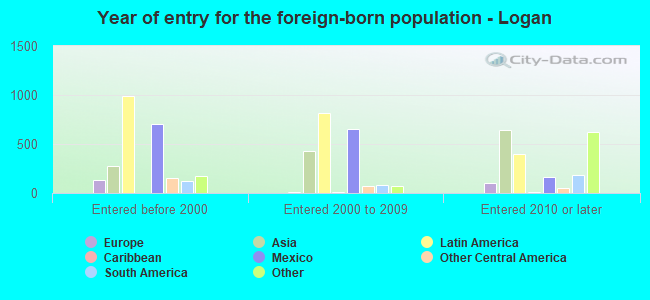
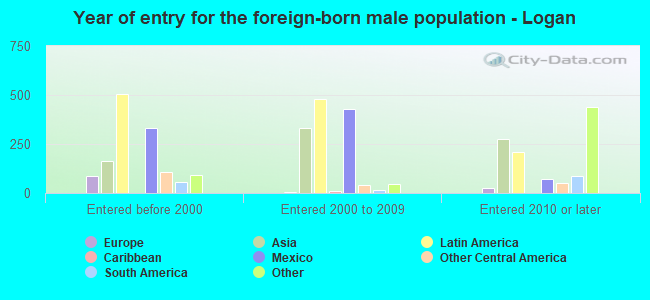
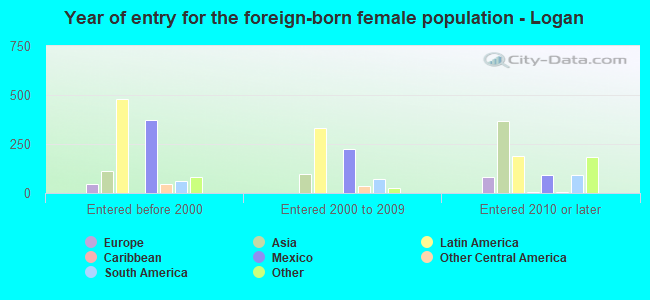
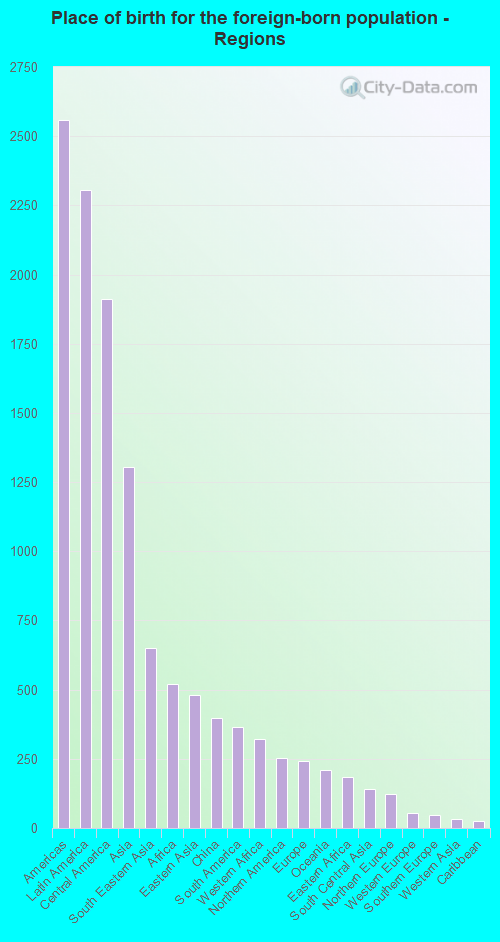
According to 2022 data, the most numerous races in Logan, UT are White alone (41,292 residents), Hispanic (8,080 residents), and Two or more races (3,105 residents). 84.9% of Logan residents speak English at home. 8.7% of Logan, UT residents are foreign-born (4.1% born in Latin America, 2.3% born in Asia, 0.9% born in Africa), which is 8.2% greater than the foreign-born rate of 8.0% across the entire state of Utah.
Race distribution in Logan
2000 2022
1,904,265 85.3% White alone 201,559 9.0% Hispanic 36,483 1.6% Asian alone 31,308 1.4% Two or more races 26,663 1.2% American Indian alone 14,806 0.7% Native Hawaiian and Other 16,137 0.7% Black alone 1,948 0.09% Other race alone
2,557,466 75.6% White alone 512,086 15.1% Hispanic 119,308 3.5% Two or more races 82,388 2.4% Asian alone 36,978 1.1% Native Hawaiian and Other 34,873 1.0% Black alone 22,803 0.7% American Indian alone 14,898 0.4% Other race alone
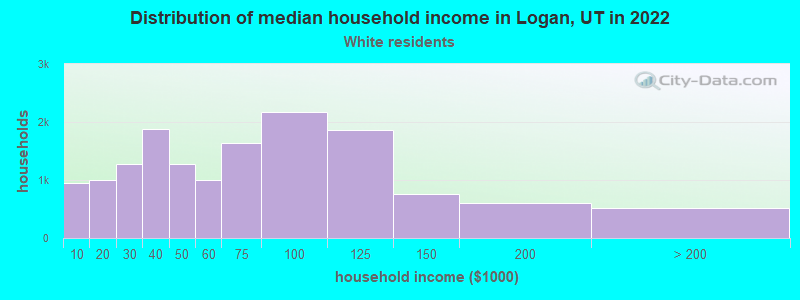
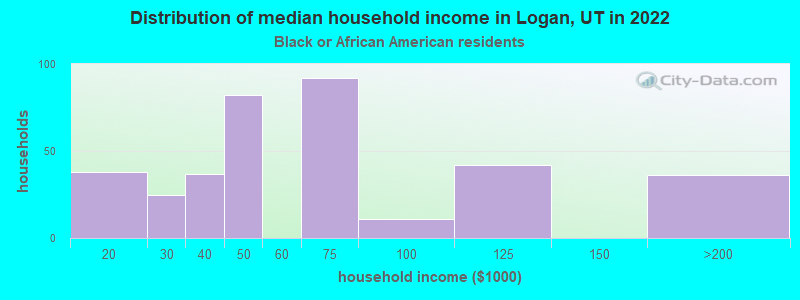
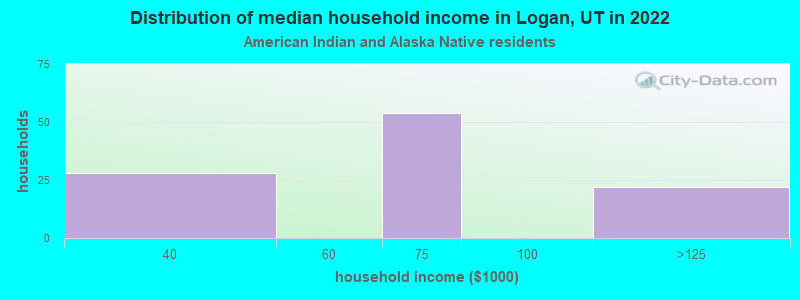
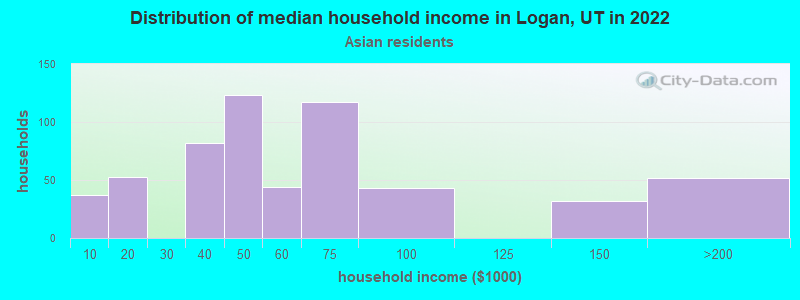
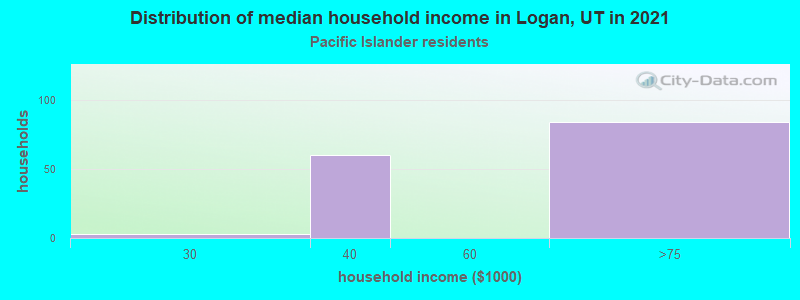
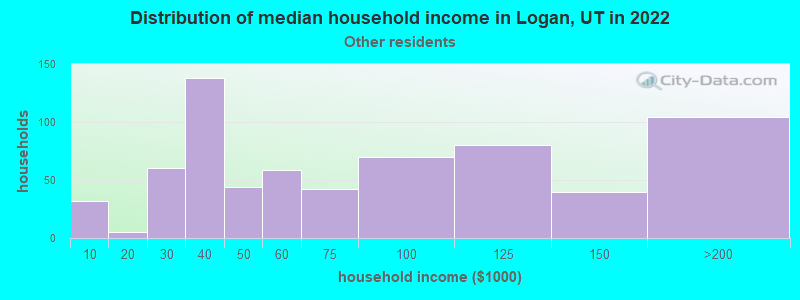
Income and house value in Logan Median household income in 2022 $57,081 White non-Hispanic householders$49,389 Black householders$51,655 American Indian and Alaska Native householders$52,916 Asian householders$61,056 Some other race householders$46,120 Two or more races householders$45,153 Hispanic or Latino race householdersMedian 2022 house value $412,558 White Non-Hispanic householders$541,525 American Indian or Alaska Native householders $415,558 Asian householders$316,584 Native Hawaiian and other Pacific Islander householders$321,915 Some other race householders$363,238 Two or more races householders$358,239 Hispanic or Latino householders
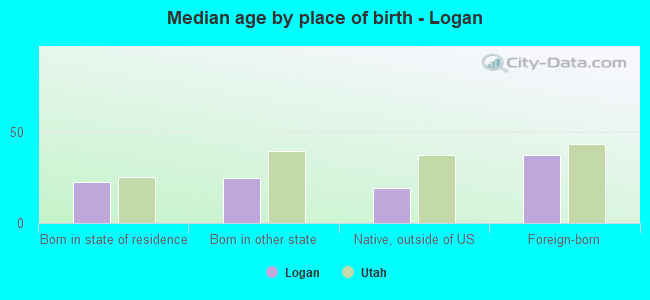
Median age by race in Logan
24.2 Median age for White residents25.1 23.2 24.4 Median age for Black or African American residents32.8 23.7 40.0 Median age for American Indian / Alaska Native residents30.7 40.6 24.2 Median age for Asian residents33.7 19.7 36.7 Median age for Native Hawaiian / Pacific Islander residents27.0 40.5 26.7 Median age for Other race residents20.4 32.6 23.2 Median age for Two or more races residents23.4 23.1 24.4 Median age for White alone residents25.1 23.5 22.3 Median age for Hispanic or Latino residents22.3 22.1
Owner/renter occupied households by race in Logan
House owners and renters - White residents 6,563 43.6% Owner occupied8,474 56.4% Renter occupiedHouse owners and renters - Black or African American residents 10 3.4% Owner occupied285 96.6% Renter occupiedHouse owners and renters - American Indian / Alaska Native residents 105 89.9% Owner occupied12 10.1% Renter occupiedHouse owners and renters - Asian residents 230 34.2% Owner occupied443 65.8% Renter occupiedHouse owners and renters - Native Hawaiian / Pacific Islander residents 74 47.2% Owner occupied83 52.8% Renter occupiedHouse owners and renters - Other race residents 461 64.9% Owner occupied249 35.1% Renter occupiedHouse owners and renters - Two or more races residents 501 28.5% Owner occupied1,259 71.5% Renter occupiedHouse owners and renters - White alone residents 6,161 43.3% Owner occupied8,069 56.7% Renter occupiedHouse owners and renters - Hispanic or Latino residents 992 45.7% Owner occupied1,178 54.3% Renter occupied
Language usage in Logan
English speakers - Total 84.9% of residents of Logan speak English at home.
10.6% of residents speak Spanish at home 4,431 80.7% Speak English very well1,061 19.3% Speak English less than very well4.2% of residents speak other language at home 1,667 77.1% Speak English very well495 22.9% Speak English less than very well
English speakers - Born in the United States 92.7% of residents of Logan speak English at home.
6.1% of residents speak Spanish at home 887 84.5% Speak English very well163 15.5% Speak English less than very well1.5% of residents speak other language at home 258 96.6% Speak English very well9 3.4% Speak English less than very well
English speakers - Native, born elsewhere 72.3% of residents of Logan speak English at home.
35.2% of residents speak Spanish at home 61 34.3% Speak English very well117 65.7% Speak English less than very well11.7% of residents speak other language at home 59 100.0% Speak English very well
English speakers - Foreign-born 20.0% of residents of Logan speak English at home.
43.5% of residents speak Spanish at home 1,074 58.8% Speak English very well754 41.2% Speak English less than very well34.1% of residents speak other language at home 1,006 70.2% Speak English very well427 29.8% Speak English less than very well
White (Caucasian) - Speak only English Native:
94.1% (37,941)Foreign-born:
61.6% (400)
White (Caucasian) - Speak another language Native:
5.8% (2,346)Foreign-born:
66.9% (435)
Black or African American - Speak only English Native:
88.3% (312)Foreign-born:
64.1% (258)
Black or African American - Speak another language Native:
5.5% (19)Foreign-born:
41.6% (168)
American Indian / Alaska Native - Speak another language Native:
16.0% (22)Foreign-born:
96.1% (135)
Asian - Speak only English Native:
75.8% (853)Foreign-born:
7.2% (61)
Asian - Speak another language Native:
24.6% (277)Foreign-born:
92.8% (779)
Native Hawaiian / Pacific Islander - Speak only English Native:
68.9% (75)Foreign-born:
12.4% (27)
Native Hawaiian / Pacific Islander - Speak another language Native:
30.4% (33)Foreign-born:
90.7% (198)
Other race - Speak only English Native:
48.8% (603)Foreign-born:
22.7% (200)
Other race - Speak another language Native:
48.6% (601)Foreign-born:
78.2% (688)
Two or more races - Speak only English Native:
75.2% (3,408)Foreign-born:
3.2% (31)
Two or more races - Speak another language Native:
24.7% (1,119)Foreign-born:
99.2% (959)
White alone - Speak only English Native:
95.7% (36,557)Foreign-born:
75.6% (275)
White alone - Speak another language Native:
4.6% (1,756)Foreign-born:
21.0% (76)
Hispanic or Latino - Speak only English Native:
57.3% (2,932)Foreign-born:
14.7% (307)
Hispanic or Latino - Speak another language Native:
42.4% (2,171)Foreign-born:
84.7% (1,766)
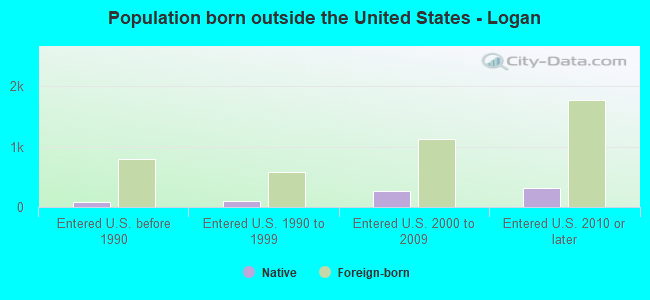
Foreign-born residents in Logan 4,841 residents are foreign born (4.1% Latin America , 2.3% Asia , 0.9% Africa ).
Marital status for residents in Logan Marital status - White (Caucasian) population 15 years and over
Males 46.9% Never married46.6% Now married0.5% Separated0.9% Widowed5.1% DivorcedFemales 42.5% Never married45.9% Now married0.4% Separated4.1% Widowed7.2% DivorcedWomen who gave birth in the past 12 months Now married:
91.4% (856)Unmarried:
8.6% (80)
Women who did not give birth in the past 12 months Now married:
42.2% (5,783)Unmarried:
57.8% (7,929)
Marital status - Black or African American population 15 years and over
Males 40.4% Never married52.1% Now married0.0% Separated0.0% Widowed7.5% DivorcedFemales 44.0% Never married20.5% Now married22.0% Separated0.0% Widowed13.5% DivorcedWomen who gave birth in the past 12 months Now married:
100.0% (8)Unmarried:
0.0% (0)
Women who did not give birth in the past 12 months Now married:
36.8% (74)Unmarried:
63.2% (127)
Marital status - American Indian / Alaska Native population 15 years and over
Males 17.0% Never married68.9% Now married14.2% Separated0.0% Widowed0.0% DivorcedFemales 62.2% Never married37.8% Now married0.0% Separated0.0% Widowed0.0% DivorcedWomen who gave birth in the past 12 months Now married:
0.0% (0)Unmarried:
100.0% (37)
Women who did not give birth in the past 12 months Now married:
40.7% (26)Unmarried:
59.3% (38)
Marital status - Asian population 15 years and over
Males 59.3% Never married33.6% Now married0.0% Separated7.2% Widowed0.0% DivorcedFemales 41.2% Never married38.0% Now married4.8% Separated3.0% Widowed13.0% DivorcedWomen who gave birth in the past 12 months Now married:
100.0% (116)Unmarried:
0.0% (0)
Women who did not give birth in the past 12 months Now married:
21.9% (136)Unmarried:
78.1% (482)
Marital status - Native Hawaiian / Pacific Islander population 15 years and over
Males 51.9% Never married48.1% Now married0.0% Separated0.0% Widowed0.0% DivorcedFemales 29.1% Never married70.9% Now married0.0% Separated0.0% Widowed0.0% DivorcedWomen who did not give birth in the past 12 months Now married:
62.9% (109)Unmarried:
37.1% (64)
Marital status - Other race population 15 years and over
Males 45.0% Never married45.3% Now married7.2% Separated0.6% Widowed1.9% DivorcedFemales 39.6% Never married56.7% Now married0.0% Separated0.8% Widowed2.8% DivorcedWomen who gave birth in the past 12 months Now married:
100.0% (2)Unmarried:
0.0% (0)
Women who did not give birth in the past 12 months Now married:
60.0% (437)Unmarried:
40.0% (292)
Marital status - Two or more races population 15 years and over
Males 46.8% Never married51.6% Now married0.0% Separated0.0% Widowed1.6% DivorcedFemales 56.0% Never married28.9% Now married1.9% Separated0.0% Widowed13.2% DivorcedWomen who gave birth in the past 12 months Now married:
65.3% (102)Unmarried:
34.7% (54)
Women who did not give birth in the past 12 months Now married:
23.9% (425)Unmarried:
76.1% (1,354)
Marital status - White alone, not Hispanic / Latino population 15 years and over
Males 46.6% Never married47.0% Now married0.3% Separated0.9% Widowed5.1% DivorcedFemales 42.1% Never married46.6% Now married0.3% Separated4.1% Widowed6.9% DivorcedWomen who gave birth in the past 12 months Now married:
90.1% (746)Unmarried:
9.9% (82)
Women who did not give birth in the past 12 months Now married:
43.4% (5,669)Unmarried:
56.6% (7,391)
Marital status - Hispanic or Latino population 15 years and over
Males 49.6% Never married42.8% Now married4.3% Separated0.2% Widowed3.1% DivorcedFemales 46.9% Never married43.0% Now married1.4% Separated1.6% Widowed7.2% DivorcedWomen who gave birth in the past 12 months Now married:
75.6% (216)Unmarried:
24.4% (70)
Women who did not give birth in the past 12 months Now married:
37.0% (772)Unmarried:
63.0% (1,312)
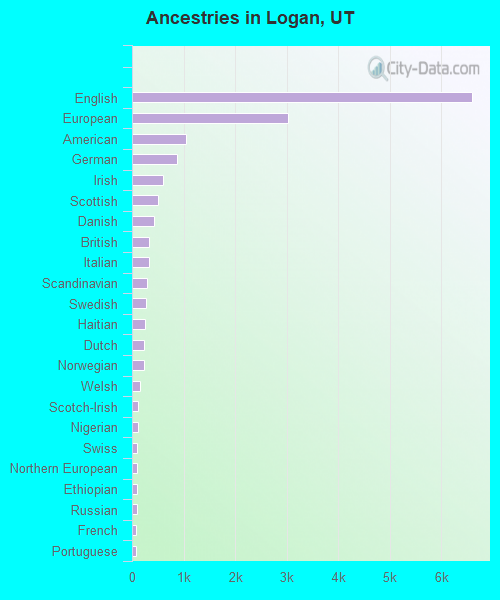
Ancestries in Logan
6,594 26.0% English3,031 11.9% European1,055 4.2% American867 3.4% German603 2.4% Irish511 2.0% Scottish432 1.7% Danish333 1.3% British325 1.3% Italian298 1.2% Scandinavian266 1.0% Swedish248 1.0% Haitian240 0.9% Dutch237 0.9% Norwegian155 0.6% Welsh114 0.4% Scotch-Irish110 0.4% Nigerian103 0.4% Swiss94 0.4% Northern European94 0.4% Ethiopian88 0.3% Russian87 0.3% French74 0.3% Portuguese46 0.2% Canadian45 0.2% Hungarian36 0.1% Polish30 0.1% Brazilian28 0.1% Serbian26 0.1% Greek23 0.09% Iranian18 0.07% Czech14 0.06% Eastern European13 0.05% African12 0.05% Basque12 0.05% Ukrainian8 0.03% Jamaican8 0.03% Icelander7 0.03% Lithuanian5 0.02% Romanian5 0.02% Slovene4 0.02% Turkish4 0.02% Armenian2 0.01% French Canadian
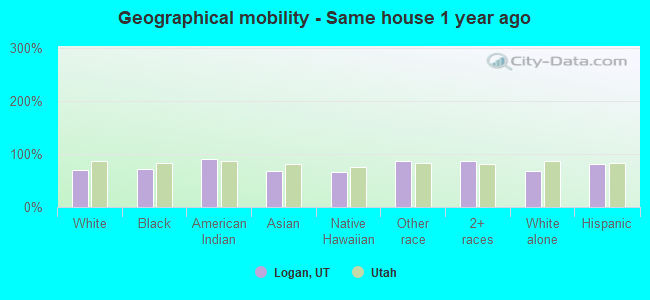
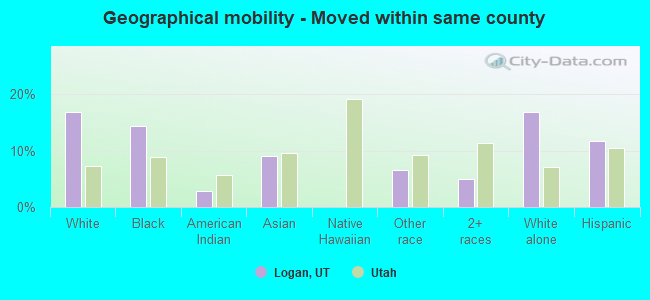
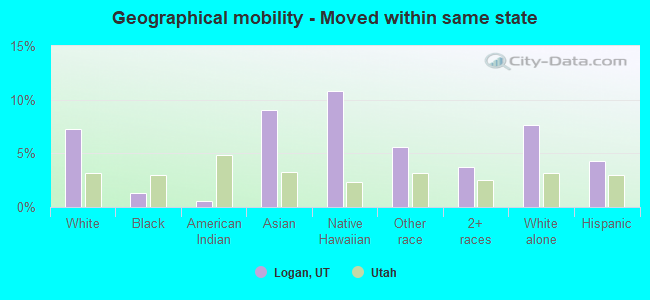
Geographical mobility in Logan Same house 1 year ago 30,296 69.5% White (Caucasian)588 71.5% Black or African American232 90.4% American Indian / Alaska Native1,420 67.8% Asian219 65.6% Native Hawaiian / Pacific Islander1,982 86.3% Other race5,103 86.4% Two or more races27,796 68.3% White alone, not Hispanic / Latino6,412 81.4% Hispanic or LatinoMoved within same county 7,339 16.8% White / Caucasian118 14.4% Black or African American7 2.8% American Indian / Alaska Native190 9.1% Asian152 6.6% Other race290 4.9% Two or more races6,841 16.8% White alone, not Hispanic / Latino924 11.7% Hispanic or LatinoMoved within same state 3,162 7.3% White / Caucasian11 1.3% Black or African American1 0.5% American Indian / Alaska Native190 9.1% Asian36 10.8% Native Hawaiian / Pacific Islander128 5.6% Other race222 3.8% Two or more races3,114 7.7% White alone, not Hispanic / Latino339 4.3% Hispanic or LatinoMoved from different state 2,277 5.2% White / Caucasian73 8.8% Black or African American19 7.5% American Indian / Alaska Native111 5.3% Asian63 18.8% Native Hawaiian / Pacific Islander31 1.4% Other race63 1.1% Two or more races2,281 5.6% White alone, not Hispanic / Latino116 1.5% Hispanic or LatinoMoved from abroad 211 0.5% White151 7.2% Asian336 5.7% Two or more races200 0.5% White alone, not Hispanic / Latino82 1.0% Hispanic or Latino
Children Nativity (place of birth) in Logan
Children under 6 years - Living with two parents Both parents native 2,760 100.0% NativeBoth parents foreign-born 150 89.1% Native18 10.9% Foreign-bornOne native, one foreign-born parent 260 96.4% Native10 3.6% Foreign-bornChildren under 6 years - Living with one parent Native parent 964 100.0% NativeForeign-born parent 222 100.0% NativeChildren 6 to 17 years - Living with two parents Both parents native 3,025 99.9% Native4 0.1% Foreign-bornBoth parents foreign-born 1,086 89.7% Native125 10.3% Foreign-bornOne native, one foreign-born parent 808 100.0% NativeChildren 6 to 17 years - Living with one parent Native parent 1,518 100.0% NativeForeign-born parent 395 62.4% Native238 37.6% Foreign-born
Grandparents responsible for own grandchildren in Logan
Grandparents (30 to 59 years) White / Caucasian 13 26.9% Responsible for grandchildren35 73.1% Not responsible for grandchildrenAsian 22 100.0% Responsible for grandchildrenOther race 3 100.0% Not responsible for grandchildrenTwo or more races 24 100.0% Not responsible for grandchildrenWhite alone, not Hispanic / Latino 14 27.9% Responsible for grandchildren37 72.1% Not responsible for grandchildrenHispanic or Latino 4 100.0% Not responsible for grandchildrenGrandparents (60 years and over) White / Caucasian 156 79.7% Responsible for grandchildren40 20.3% Not responsible for grandchildrenAsian 50 100.0% Not responsible for grandchildrenOther race 8 100.0% Not responsible for grandchildrenWhite alone, not Hispanic / Latino 149 86.1% Responsible for grandchildren24 13.9% Not responsible for grandchildrenHispanic or Latino 9 25.8% Responsible for grandchildren27 74.2% Not responsible for grandchildren