Races in Logansport, Indiana (IN) Detailed Stats
Data:
Races - White alone (%)
Races - White alone (% change since 2000)
Races - Black alone (%)
Races - Black alone (% change since 2000)
Races - American Indian alone (%)
Races - American Indian alone (% change since 2000)
Races - Asian alone (%)
Races - Asian alone (% change since 2000)
Races - Hispanic (%)
Races - Hispanic (% change since 2000)
Races - Native Hawaiian and Other Pacific Islander alone (%)
Races - Native Hawaiian and Other Pacific Islander alone (% change since 2000)
Races - Two or more races(%)
Races - Two or more races(% change since 2000)
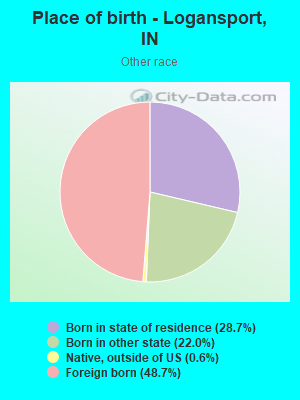
Races - Other race alone (%)
Races - Other race alone (% change since 2000)
Racial diversity
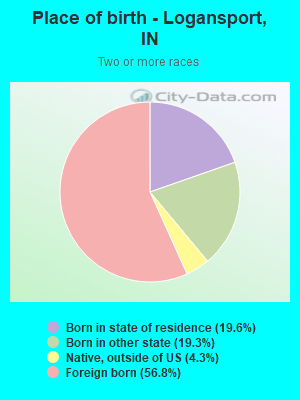
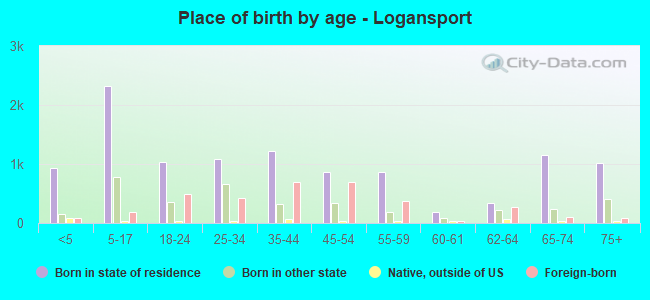
Place of birth - Born in state of residence (%)
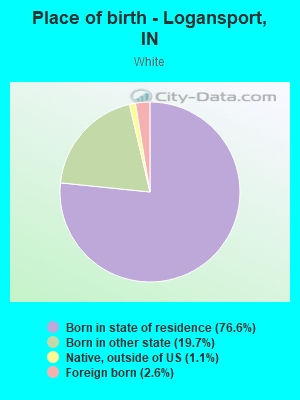
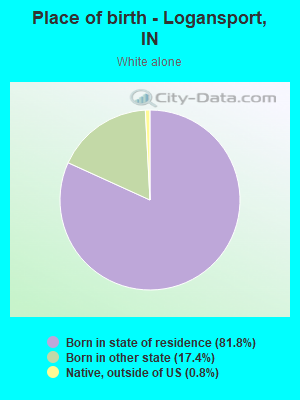
Place of birth - Born in state of residence (%) - White
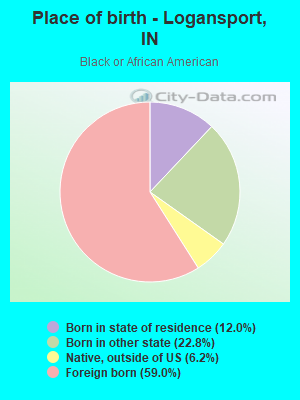
Place of birth - Born in state of residence (%) - Black or African American
Place of birth - Born in state of residence (%) - Asian
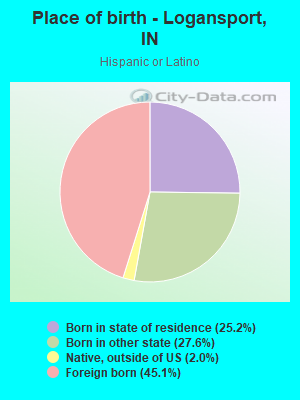
Place of birth - Born in state of residence (%) - Hispanic or Latino
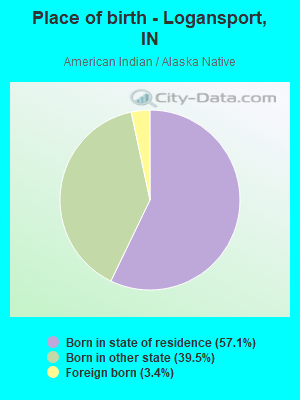
Place of birth - Born in state of residence (%) - American Indian and Alaska Native
Place of birth - Born in state of residence (%) - Multirace
Place of birth - Born in state of residence (%) - Other Race
Place of birth - Born in other state (%)
Place of birth - Born in other state (%) - White
Place of birth - Born in other state (%) - Black or African American
Place of birth - Born in other state (%) - Asian
Place of birth - Born in other state (%) - Hispanic or Latino
Place of birth - Born in other state (%) - American Indian and Alaska Native
Place of birth - Born in other state (%) - Multirace
Place of birth - Born in other state (%) - Other Race
Place of birth - Native, outside of US (%)
Place of birth - Native, outside of US (%) - White
Place of birth - Native, outside of US (%) - Black or African American
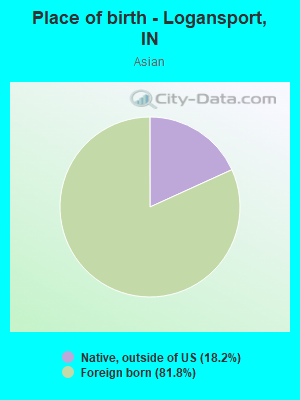
Place of birth - Native, outside of US (%) - Asian
Place of birth - Native, outside of US (%) - Hispanic or Latino
Place of birth - Native, outside of US (%) - American Indian and Alaska Native
Place of birth - Native, outside of US (%) - Multirace
Place of birth - Native, outside of US (%) - Other Race
Place of birth - Foreign born (%)
Place of birth - Foreign born (%) - White
Place of birth - Foreign born (%) - Black or African American
Place of birth - Foreign born (%) - Asian
Place of birth - Foreign born (%) - Hispanic or Latino
Place of birth - Foreign born (%) - American Indian and Alaska Native
Place of birth - Foreign born (%) - Multirace
Place of birth - Foreign born (%) - Other Race
Residents speaking English at home (%)
Residents speaking English at home - Born in the United States (%)
Residents speaking English at home - Native, born elsewhere (%)
Residents speaking English at home - Foreign born (%)
Residents speaking Spanish at home (%)
Residents speaking Spanish at home - Born in the United States (%)
Residents speaking Spanish at home - Native, born elsewhere (%)
Residents speaking Spanish at home - Foreign born (%)
Residents speaking other language at home (%)
Residents speaking other language at home - Born in the United States (%)
Residents speaking other language at home - Native, born elsewhere (%)
Residents speaking other language at home - Foreign born (%)
Marital status - Never married (%)
Marital status - Now married (%)
Marital status - Separated (%)
Marital status - Widowed (%)
Marital status - Divorced (%)
Ancestries Reported - Arab (%)
Ancestries Reported - Czech (%)
Ancestries Reported - Danish (%)
Ancestries Reported - Dutch (%)
Ancestries Reported - English (%)
Ancestries Reported - French (%)
Ancestries Reported - French Canadian (%)
Ancestries Reported - German (%)
Ancestries Reported - Greek (%)
Ancestries Reported - Hungarian (%)
Ancestries Reported - Irish (%)
Ancestries Reported - Italian (%)
Ancestries Reported - Lithuanian (%)
Ancestries Reported - Norwegian (%)
Ancestries Reported - Polish (%)
Ancestries Reported - Portuguese (%)
Ancestries Reported - Russian (%)
Ancestries Reported - Scotch-Irish (%)
Ancestries Reported - Scottish (%)
Ancestries Reported - Slovak (%)
Ancestries Reported - Subsaharan African (%)
Ancestries Reported - Swedish (%)
Ancestries Reported - Swiss (%)
Ancestries Reported - Ukrainian (%)
Ancestries Reported - United States (%)
Ancestries Reported - Welsh (%)
Ancestries Reported - West Indian (%)
Ancestries Reported - Other (%)
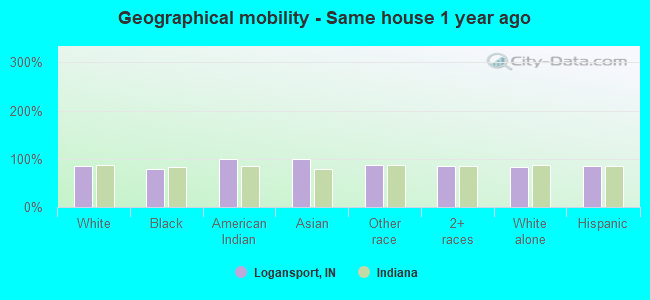
Geographical mobility - Same house 1 year ago (%)
Geographical mobility - Same house 1 year ago (%) - White
Geographical mobility - Same house 1 year ago (%) - Black or African American
Geographical mobility - Same house 1 year ago (%) - Asian
Geographical mobility - Same house 1 year ago (%) - Hispanic or Latino
Geographical mobility - Same house 1 year ago (%) - American Indian and Alaska Native
Geographical mobility - Same house 1 year ago (%) - Multirace
Geographical mobility - Same house 1 year ago (%) - Other Race
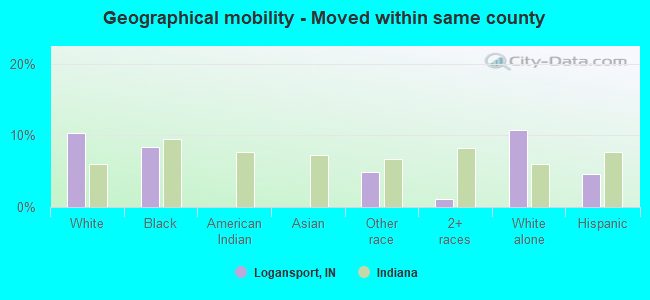
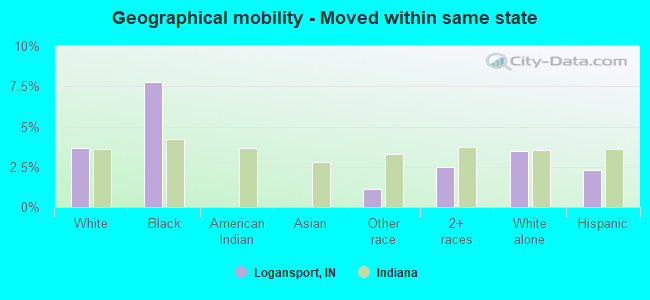
Geographical mobility - Moved within same county (%)
Geographical mobility - Moved within same county (%) - White
Geographical mobility - Moved within same county (%) - Black or African American
Geographical mobility - Moved within same county (%) - Asian
Geographical mobility - Moved within same county (%) - Hispanic or Latino
Geographical mobility - Moved within same county (%) - American Indian and Alaska Native
Geographical mobility - Moved within same county (%) - Multirace
Geographical mobility - Moved within same county (%) - Other Race
Geographical mobility - Moved from different county within same state (%)
Geographical mobility - Moved from different county within same state (%) - White
Geographical mobility - Moved from different county within same state (%) - Black or African American
Geographical mobility - Moved from different county within same state (%) - Asian
Geographical mobility - Moved from different county within same state (%) - Hispanic or Latino
Geographical mobility - Moved from different county within same state (%) - American Indian and Alaska Native
Geographical mobility - Moved from different county within same state (%) - Multirace
Geographical mobility - Moved from different county within same state (%) - Other Race
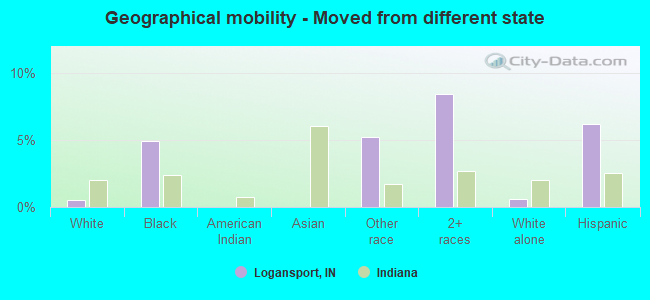
Geographical mobility - Moved from different state (%)
Geographical mobility - Moved from different state (%) - White
Geographical mobility - Moved from different state (%) - Black or African American
Geographical mobility - Moved from different state (%) - Asian
Geographical mobility - Moved from different state (%) - Hispanic or Latino
Geographical mobility - Moved from different state (%) - American Indian and Alaska Native
Geographical mobility - Moved from different state (%) - Multirace
Geographical mobility - Moved from different state (%) - Other Race
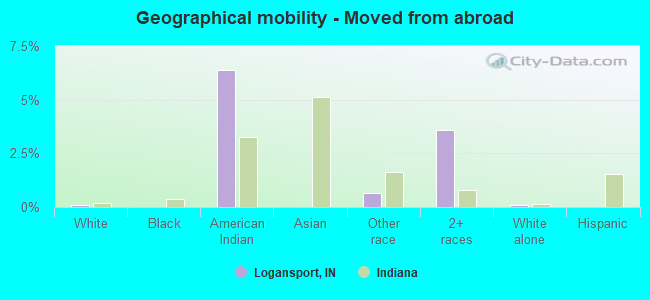
Geographical mobility - Moved from abroad (%)
Geographical mobility - Moved from abroad (%) - White
Geographical mobility - Moved from abroad (%) - Black or African American
Geographical mobility - Moved from abroad (%) - Asian
Geographical mobility - Moved from abroad (%) - Hispanic or Latino
Geographical mobility - Moved from abroad (%) - American Indian and Alaska Native
Geographical mobility - Moved from abroad (%) - Multirace
Geographical mobility - Moved from abroad (%) - Other Race
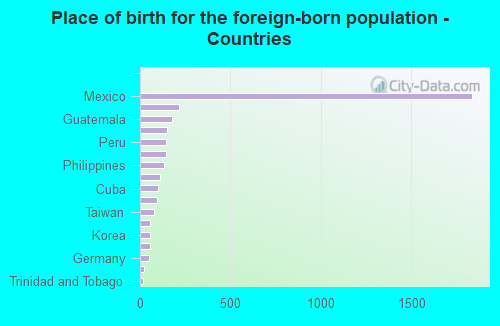
Place of birth for the foreign-born population - Ireland (%)
Place of birth for the foreign-born population - Denmark (%)
Place of birth for the foreign-born population - Norway (%)
Place of birth for the foreign-born population - Sweden (%)
Place of birth for the foreign-born population - United Kingdom (%)
Place of birth for the foreign-born population - England (%)
Place of birth for the foreign-born population - Scotland (%)
Place of birth for the foreign-born population - Other Northern Europe (%)
Place of birth for the foreign-born population - Austria (%)
Place of birth for the foreign-born population - Belgium (%)
Place of birth for the foreign-born population - France (%)
Place of birth for the foreign-born population - Germany (%)
Place of birth for the foreign-born population - Netherlands (%)
Place of birth for the foreign-born population - Switzerland (%)
Place of birth for the foreign-born population - Other Western Europe (%)
Place of birth for the foreign-born population - Greece (%)
Place of birth for the foreign-born population - Italy (%)
Place of birth for the foreign-born population - Portugal (%)
Place of birth for the foreign-born population - Spain (%)
Place of birth for the foreign-born population - Other Southern Europe (%)
Place of birth for the foreign-born population - Albania (%)
Place of birth for the foreign-born population - Belarus (%)
Place of birth for the foreign-born population - Bosnia and Herzegovina (%)
Place of birth for the foreign-born population - Bulgaria (%)
Place of birth for the foreign-born population - Croatia (%)
Place of birth for the foreign-born population - Czechoslovakia (%)
Place of birth for the foreign-born population - Hungary (%)
Place of birth for the foreign-born population - Latvia (%)
Place of birth for the foreign-born population - Lithuania (%)
Place of birth for the foreign-born population - North Macedonia (Macedonia) (%)
Place of birth for the foreign-born population - Moldova (%)
Place of birth for the foreign-born population - Poland (%)
Place of birth for the foreign-born population - Romania (%)
Place of birth for the foreign-born population - Russia (%)
Place of birth for the foreign-born population - Serbia (%)
Place of birth for the foreign-born population - Ukraine (%)
Place of birth for the foreign-born population - Other Eastern Europe (%)
Place of birth for the foreign-born population - China (%)
Place of birth for the foreign-born population - Hong Kong (%)
Place of birth for the foreign-born population - Taiwan (%)
Place of birth for the foreign-born population - Japan (%)
Place of birth for the foreign-born population - Korea (%)
Place of birth for the foreign-born population - Other Eastern Asia (%)
Place of birth for the foreign-born population - Afghanistan (%)
Place of birth for the foreign-born population - Bangladesh (%)
Place of birth for the foreign-born population - India (%)
Place of birth for the foreign-born population - Iran (%)
Place of birth for the foreign-born population - Kazakhstan (%)
Place of birth for the foreign-born population - Nepal (%)
Place of birth for the foreign-born population - Pakistan (%)
Place of birth for the foreign-born population - Sri Lanka (%)
Place of birth for the foreign-born population - Uzbekistan (%)
Place of birth for the foreign-born population - Other South Central Asia (%)
Place of birth for the foreign-born population - Burma (%)
Place of birth for the foreign-born population - Cambodia (%)
Place of birth for the foreign-born population - Indonesia (%)
Place of birth for the foreign-born population - Laos (%)
Place of birth for the foreign-born population - Malaysia (%)
Place of birth for the foreign-born population - Philippines (%)
Place of birth for the foreign-born population - Singapore (%)
Place of birth for the foreign-born population - Thailand (%)
Place of birth for the foreign-born population - Vietnam (%)
Place of birth for the foreign-born population - Other South Eastern Asia (%)
Place of birth for the foreign-born population - Armenia (%)
Place of birth for the foreign-born population - Iraq (%)
Place of birth for the foreign-born population - Israel (%)
Place of birth for the foreign-born population - Jordan (%)
Place of birth for the foreign-born population - Kuwait (%)
Place of birth for the foreign-born population - Lebanon (%)
Place of birth for the foreign-born population - Saudi Arabia (%)
Place of birth for the foreign-born population - Syria (%)
Place of birth for the foreign-born population - Turkey (%)
Place of birth for the foreign-born population - Yemen (%)
Place of birth for the foreign-born population - Other Western Asia (%)
Place of birth for the foreign-born population - Eritrea (%)
Place of birth for the foreign-born population - Ethiopia (%)
Place of birth for the foreign-born population - Kenya (%)
Place of birth for the foreign-born population - Somalia (%)
Place of birth for the foreign-born population - Uganda (%)
Place of birth for the foreign-born population - Zimbabwe (%)
Place of birth for the foreign-born population - Other Eastern Africa (%)
Place of birth for the foreign-born population - Cameroon (%)
Place of birth for the foreign-born population - Congo (%)
Place of birth for the foreign-born population - Democratic Republic of Congo (Zaire) (%)
Place of birth for the foreign-born population - Other Middle Africa (%)
Place of birth for the foreign-born population - Egypt (%)
Place of birth for the foreign-born population - Morocco (%)
Place of birth for the foreign-born population - Sudan (%)
Place of birth for the foreign-born population - Other Northern Africa (%)
Place of birth for the foreign-born population - South Africa (%)
Place of birth for the foreign-born population - Other Southern Africa (%)
Place of birth for the foreign-born population - Cabo Verde (%)
Place of birth for the foreign-born population - Ghana (%)
Place of birth for the foreign-born population - Liberia (%)
Place of birth for the foreign-born population - Nigeria (%)
Place of birth for the foreign-born population - Senegal (%)
Place of birth for the foreign-born population - Sierra Leone (%)
Place of birth for the foreign-born population - Other Western Africa (%)
Place of birth for the foreign-born population - Australia (%)
Place of birth for the foreign-born population - New Zealand (%)
Place of birth for the foreign-born population - Fiji (%)
Place of birth for the foreign-born population - Micronesia (%)
Place of birth for the foreign-born population - Bahamas (%)
Place of birth for the foreign-born population - Barbados (%)
Place of birth for the foreign-born population - Cuba (%)
Place of birth for the foreign-born population - Dominica (%)
Place of birth for the foreign-born population - Dominican Republic (%)
Place of birth for the foreign-born population - Grenada (%)
Place of birth for the foreign-born population - Haiti (%)
Place of birth for the foreign-born population - Jamaica (%)
Place of birth for the foreign-born population - St. Vincent and the Grenadines (%)
Place of birth for the foreign-born population - Trinidad and Tobago (%)
Place of birth for the foreign-born population - West Indies (%)
Place of birth for the foreign-born population - Other Caribbean (%)
Place of birth for the foreign-born population - Belize (%)
Place of birth for the foreign-born population - Costa Rica (%)
Place of birth for the foreign-born population - El Salvador (%)
Place of birth for the foreign-born population - Guatemala (%)
Place of birth for the foreign-born population - Honduras (%)
Place of birth for the foreign-born population - Mexico (%)
Place of birth for the foreign-born population - Nicaragua (%)
Place of birth for the foreign-born population - Panama (%)
Place of birth for the foreign-born population - Other Central America (%)
Place of birth for the foreign-born population - Argentina (%)
Place of birth for the foreign-born population - Bolivia (%)
Place of birth for the foreign-born population - Brazil (%)
Place of birth for the foreign-born population - Chile (%)
Place of birth for the foreign-born population - Colombia (%)
Place of birth for the foreign-born population - Ecuador (%)
Place of birth for the foreign-born population - Guyana (%)
Place of birth for the foreign-born population - Peru (%)
Place of birth for the foreign-born population - Uruguay (%)
Place of birth for the foreign-born population - Venezuela (%)
Place of birth for the foreign-born population - Other South America (%)
Place of birth for the foreign-born population - Canada (%)
Place of birth for the foreign-born population - Other Northern America (%)
Place of birth for the foreign-born population - Other (%)
Latest news about races in Logansport, IN collected exclusively by city-data.com from local newspapers, TV, and radio stations
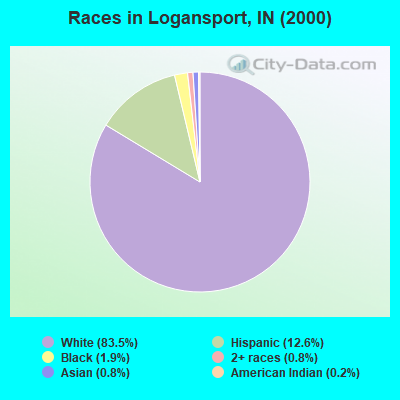
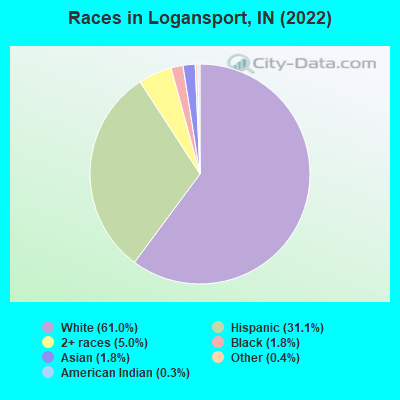
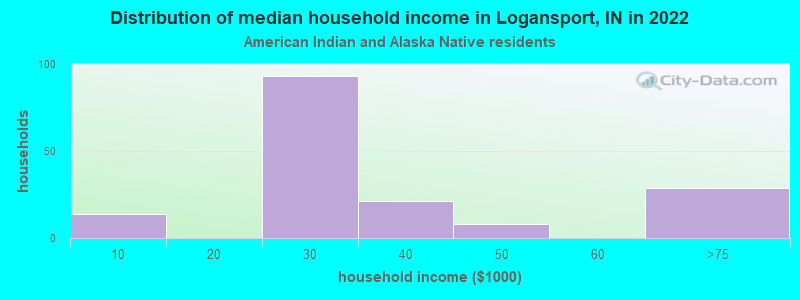
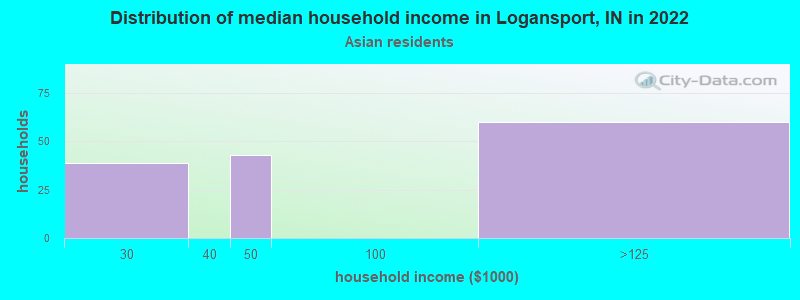
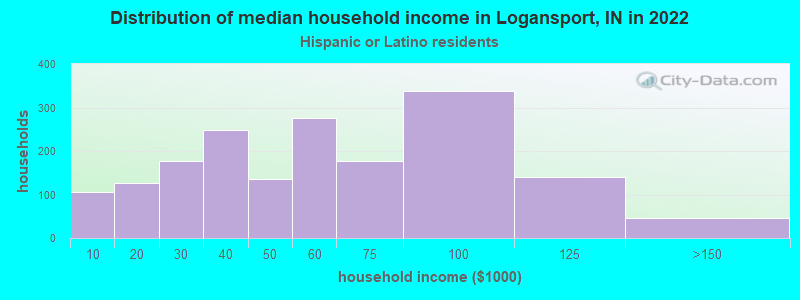
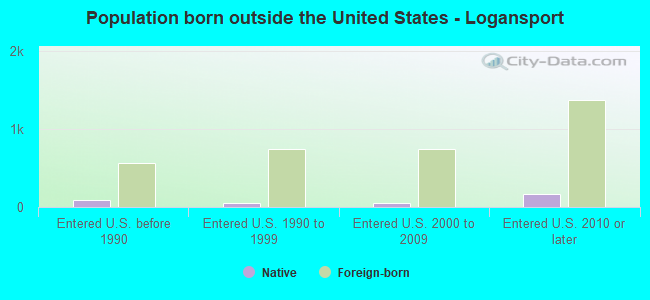
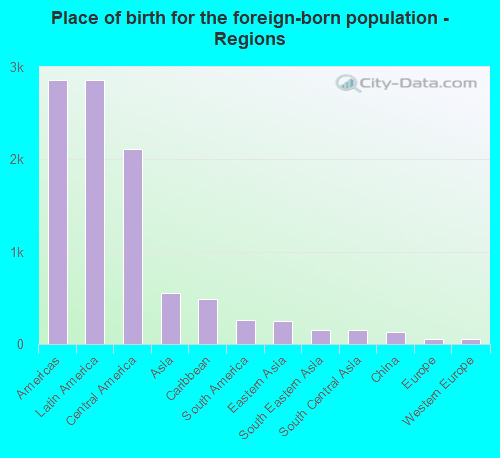
According to 2022 data, the most numerous races in Logansport, IN are White alone (11,164 residents), Black alone (332 residents), and Hispanic (5,684 residents). 71.3% of Logansport residents speak English at home. 18.9% of Logansport, IN residents are foreign-born (14.3% born in Latin America, 2.8% born in Asia), which is 68.3% greater than the foreign-born rate of 6.0% across the entire state of Indiana.
Race distribution in Logansport
2000 2022
5,219,373 85.8% White alone 505,462 8.3% Black alone 214,536 3.5% Hispanic 61,115 1.0% Two or more races 58,424 1.0% Asian alone 13,654 0.2% American Indian alone 6,348 0.1% Other race alone 1,573 0.03% Native Hawaiian and Other
5,192,455 76.0% White alone 628,054 9.2% Black alone 534,528 7.8% Hispanic 263,242 3.9% Two or more races 172,880 2.5% Asian alone 33,467 0.5% Other race alone 5,866 0.09% American Indian alone 2,545 0.04% Native Hawaiian and Other
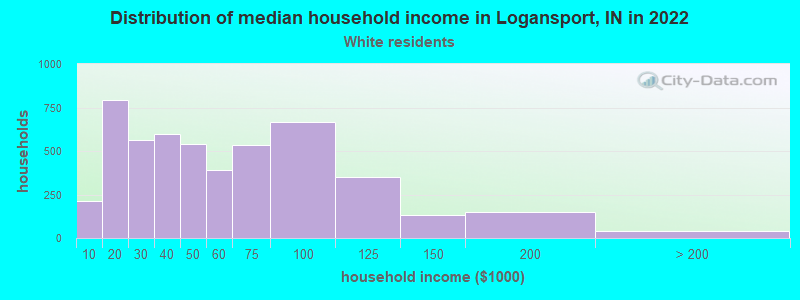
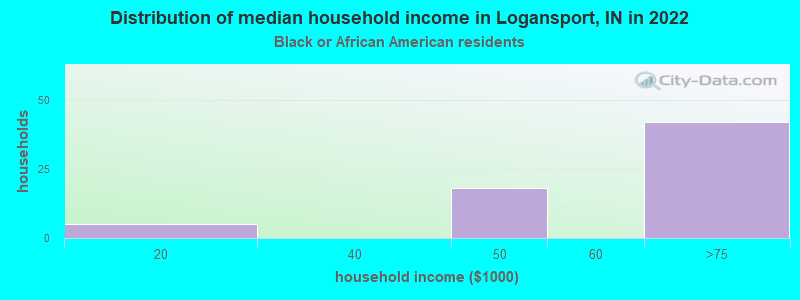
Income and house value in Logansport Median household income in 2022 $43,890 White non-Hispanic householders$64,371 Black householders$26,163 American Indian and Alaska Native householders$51,802 Some other race householders$43,085 Two or more races householders$52,880 Hispanic or Latino race householdersMedian 2022 house value $90,930 White Non-Hispanic householders$125,490 Black or African American householders $113,970 Asian householders$99,839 Some other race householders$91,084 Hispanic or Latino householders
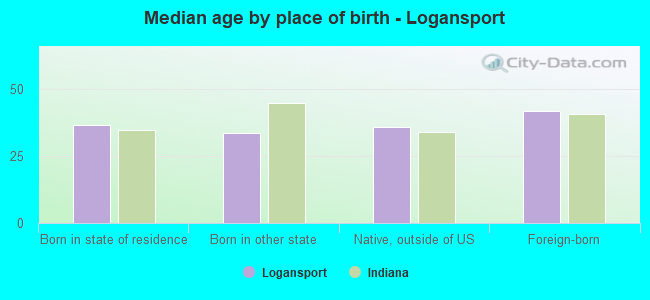
Median age by race in Logansport
41.0 Median age for White residents37.0 44.5 29.1 Median age for Black or African American residents18.1 29.3 22.9 Median age for American Indian / Alaska Native residents36.7 20.1 60.9 Median age for Asian residents-693,422,518.8 58.0 -664,335,663.7 Median age for Native Hawaiian / Pacific Islander residents-644,025,156.6 -664,437,011.6 29.4 Median age for Other race residents28.9 30.1 35.1 Median age for Two or more races residents29.3 38.0 43.7 Median age for White alone residents41.8 45.8 26.9 Median age for Hispanic or Latino residents25.8 28.3
Owner/renter occupied households by race in Logansport
House owners and renters - White residents 3,254 65.9% Owner occupied1,684 34.1% Renter occupiedHouse owners and renters - Black or African American residents 39 54.5% Owner occupied32 45.5% Renter occupiedHouse owners and renters - American Indian / Alaska Native residents 18 11.2% Owner occupied147 88.8% Renter occupiedHouse owners and renters - Asian residents 58 33.7% Owner occupied113 66.3% Renter occupiedHouse owners and renters - Other race residents 700 66.1% Owner occupied360 33.9% Renter occupiedHouse owners and renters - Two or more races residents 501 51.6% Owner occupied469 48.4% Renter occupiedHouse owners and renters - White alone residents 2,941 63.7% Owner occupied1,674 36.3% Renter occupiedHouse owners and renters - Hispanic or Latino residents 1,144 64.7% Owner occupied625 35.3% Renter occupied
Language usage in Logansport
English speakers - Total 71.3% of residents of Logansport speak English at home.
26.6% of residents speak Spanish at home 2,433 53.8% Speak English very well2,090 46.2% Speak English less than very well3.6% of residents speak other language at home 241 39.6% Speak English very well367 60.4% Speak English less than very well
English speakers - Born in the United States 60.9% of residents of Logansport speak English at home.
40.5% of residents speak Spanish at home 1,330 92.0% Speak English very well115 8.0% Speak English less than very well1.6% of residents speak other language at home 57 100.0% Speak English very well
English speakers - Native, born elsewhere 90.0% of residents of Logansport speak English at home.
9.2% of residents speak Spanish at home 11 47.8% Speak English very well12 52.2% Speak English less than very well
English speakers - Foreign-born 14.3% of residents of Logansport speak English at home.
70.2% of residents speak Spanish at home 474 20.1% Speak English very well1,879 79.9% Speak English less than very well16.3% of residents speak other language at home 178 32.7% Speak English very well367 67.3% Speak English less than very well
White (Caucasian) - Speak only English Native:
94.8% (10,667)Foreign-born:
23.2% (74)
White (Caucasian) - Speak another language Native:
5.0% (568)Foreign-born:
74.4% (238)
Black or African American - Speak another language Native:
30.6% (54)Foreign-born:
100.0% (257)
American Indian / Alaska Native - Speak another language Native:
54.8% (125)Foreign-born:
100.0% (9)
Asian - Speak only English Native:
94.8% (57)Foreign-born:
62.1% (166)
Other race - Speak only English Native:
9.2% (132)Foreign-born:
11.7% (191)
Other race - Speak another language Native:
84.2% (1,217)Foreign-born:
88.3% (1,450)
Two or more races - Speak only English Native:
61.5% (647)Foreign-born:
10.5% (136)
Two or more races - Speak another language Native:
42.3% (445)Foreign-born:
89.3% (1,157)
Hispanic or Latino - Speak only English Native:
20.3% (520)Foreign-born:
12.2% (318)
Hispanic or Latino - Speak another language Native:
81.8% (2,098)Foreign-born:
87.8% (2,281)
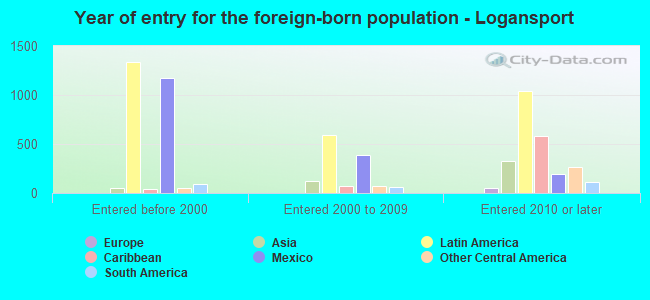
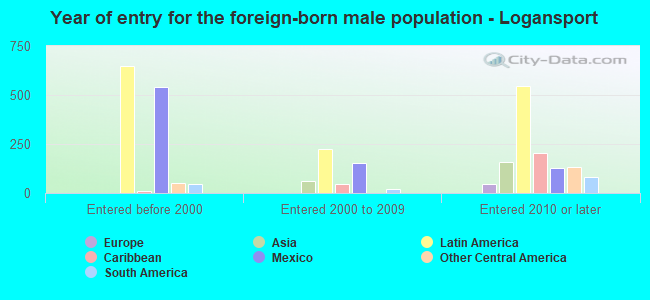
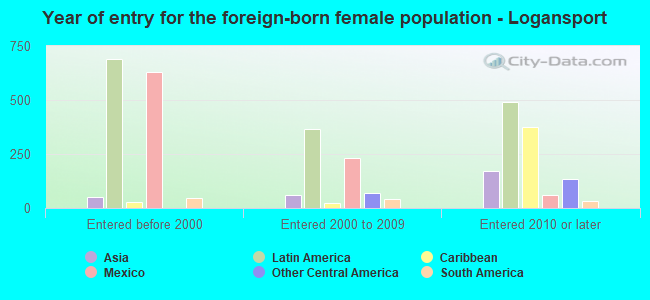
Foreign-born residents in Logansport 3,460 residents are foreign born (14.3% Latin America , 2.8% Asia ).
This city:
18.9%Indiana:
5.6%
Marital status for residents in Logansport Marital status - White (Caucasian) population 15 years and over
Males 36.4% Never married38.0% Now married0.5% Separated7.4% Widowed17.8% DivorcedFemales 19.9% Never married38.6% Now married3.9% Separated16.8% Widowed20.8% DivorcedWomen who gave birth in the past 12 months Now married:
56.1% (44)Unmarried:
43.9% (35)
Women who did not give birth in the past 12 months Now married:
42.2% (1,027)Unmarried:
57.8% (1,405)
Marital status - Black or African American population 15 years and over
Males 55.9% Never married31.4% Now married0.0% Separated0.0% Widowed12.7% DivorcedFemales 32.6% Never married56.0% Now married0.0% Separated1.4% Widowed9.9% DivorcedWomen who did not give birth in the past 12 months Now married:
59.0% (79)Unmarried:
41.0% (55)
Marital status - American Indian / Alaska Native population 15 years and over
Males 35.0% Never married55.0% Now married0.0% Separated0.0% Widowed10.0% DivorcedFemales 0.0% Never married0.0% Now married0.0% Separated9.8% Widowed90.2% DivorcedWomen who did not give birth in the past 12 months Now married:
0.0% (0)Unmarried:
100.0% (130)
Marital status - Asian population 15 years and over
Males 0.0% Never married100.0% Now married0.0% Separated0.0% Widowed0.0% DivorcedFemales 0.0% Never married73.5% Now married0.0% Separated26.5% Widowed0.0% DivorcedWomen who did not give birth in the past 12 months Now married:
100.0% (33)Unmarried:
0.0% (0)
Marital status - Other race population 15 years and over
Males 49.3% Never married43.7% Now married0.0% Separated0.1% Widowed6.9% DivorcedFemales 33.9% Never married50.2% Now married7.5% Separated0.0% Widowed8.4% DivorcedWomen who gave birth in the past 12 months Now married:
84.2% (58)Unmarried:
15.8% (11)
Women who did not give birth in the past 12 months Now married:
56.3% (577)Unmarried:
43.7% (448)
Marital status - Two or more races population 15 years and over
Males 51.8% Never married41.9% Now married0.5% Separated0.2% Widowed5.6% DivorcedFemales 40.0% Never married46.5% Now married0.0% Separated1.1% Widowed12.3% DivorcedWomen who gave birth in the past 12 months Now married:
95.1% (107)Unmarried:
4.9% (5)
Women who did not give birth in the past 12 months Now married:
21.9% (93)Unmarried:
78.1% (331)
Marital status - White alone, not Hispanic / Latino population 15 years and over
Males 36.9% Never married35.9% Now married0.5% Separated8.2% Widowed18.5% DivorcedFemales 20.4% Never married36.8% Now married3.4% Separated17.9% Widowed21.5% DivorcedWomen who gave birth in the past 12 months Now married:
45.5% (29)Unmarried:
54.5% (35)
Women who did not give birth in the past 12 months Now married:
38.3% (855)Unmarried:
61.7% (1,377)
Marital status - Hispanic or Latino population 15 years and over
Males 41.2% Never married50.4% Now married0.0% Separated0.2% Widowed8.2% DivorcedFemales 30.7% Never married51.8% Now married6.5% Separated0.3% Widowed10.6% DivorcedWomen who gave birth in the past 12 months Now married:
91.2% (100)Unmarried:
8.8% (10)
Women who did not give birth in the past 12 months Now married:
53.5% (787)Unmarried:
46.5% (684)
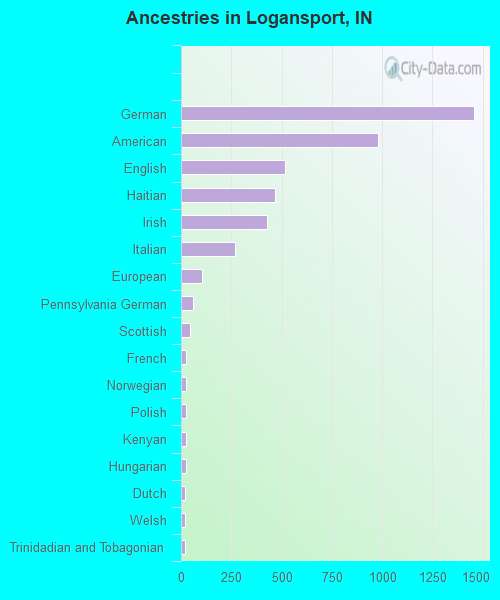
Ancestries in Logansport
1,458 15.5% German981 10.4% American518 5.5% English465 5.0% Haitian425 4.5% Irish268 2.9% Italian103 1.1% European59 0.6% Pennsylvania German46 0.5% Scottish27 0.3% French26 0.3% Norwegian25 0.3% Polish25 0.3% Kenyan23 0.2% Hungarian22 0.2% Dutch20 0.2% Welsh18 0.2% Trinidadian and Tobagonian9 0.10% British8 0.09% French Canadian8 0.09% Slovak7 0.07% Scotch-Irish
Geographical mobility in Logansport Same house 1 year ago 10,435 84.7% White (Caucasian)279 79.1% Black or African American318 98.7% American Indian / Alaska Native329 99.5% Asian2,883 86.8% Other race1,941 85.4% Two or more races9,322 84.2% White alone, not Hispanic / Latino4,862 86.5% Hispanic or LatinoMoved within same county 1,274 10.3% White / Caucasian30 8.4% Black or African American164 5.0% Other race26 1.1% Two or more races1,197 10.8% White alone, not Hispanic / Latino259 4.6% Hispanic or LatinoMoved within same state 451 3.7% White / Caucasian27 7.8% Black or African American38 1.1% Other race56 2.5% Two or more races386 3.5% White alone, not Hispanic / Latino129 2.3% Hispanic or LatinoMoved from different state 64 0.5% White / Caucasian17 4.9% Black or African American173 5.2% Other race192 8.4% Two or more races65 0.6% White alone, not Hispanic / Latino347 6.2% Hispanic or LatinoMoved from abroad 11 0.1% White21 6.4% American Indian / Alaska Native22 0.7% Other race81 3.6% Two or more races11 0.1% White alone, not Hispanic / Latino
Children Nativity (place of birth) in Logansport
Children under 6 years - Living with two parents Both parents native 398 100.0% NativeBoth parents foreign-born 233 69.4% Native103 30.6% Foreign-bornOne native, one foreign-born parent 170 100.0% NativeChildren under 6 years - Living with one parent Native parent 533 100.0% NativeForeign-born parent 89 100.0% NativeChildren 6 to 17 years - Living with two parents Both parents native 628 100.0% NativeBoth parents foreign-born 268 73.8% Native95 26.2% Foreign-bornOne native, one foreign-born parent 288 100.0% NativeChildren 6 to 17 years - Living with one parent Native parent 909 100.0% NativeForeign-born parent 422 56.9% Native320 43.1% Foreign-born
Grandparents responsible for own grandchildren in Logansport
Grandparents (30 to 59 years) White / Caucasian 18 20.9% Responsible for grandchildren67 79.1% Not responsible for grandchildrenOther race 13 100.0% Not responsible for grandchildrenWhite alone, not Hispanic / Latino 18 28.4% Responsible for grandchildren46 71.6% Not responsible for grandchildrenHispanic or Latino 36 100.0% Not responsible for grandchildrenGrandparents (60 years and over) White / Caucasian 86 64.6% Responsible for grandchildren47 35.4% Not responsible for grandchildrenOther race 38 100.0% Not responsible for grandchildrenWhite alone, not Hispanic / Latino 60 55.8% Responsible for grandchildren48 44.2% Not responsible for grandchildrenHispanic or Latino 11 23.0% Responsible for grandchildren37 77.0% Not responsible for grandchildren