Races in Lombard, Illinois (IL) Detailed Stats
Data:
Races - White alone (%)
Races - White alone (% change since 2000)
Races - Black alone (%)
Races - Black alone (% change since 2000)
Races - American Indian alone (%)
Races - American Indian alone (% change since 2000)
Races - Asian alone (%)
Races - Asian alone (% change since 2000)
Races - Hispanic (%)
Races - Hispanic (% change since 2000)
Races - Native Hawaiian and Other Pacific Islander alone (%)
Races - Native Hawaiian and Other Pacific Islander alone (% change since 2000)
Races - Two or more races(%)
Races - Two or more races(% change since 2000)
Races - Other race alone (%)
Races - Other race alone (% change since 2000)
Racial diversity
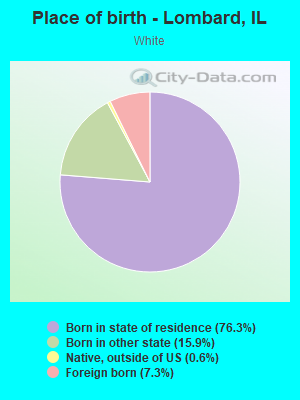
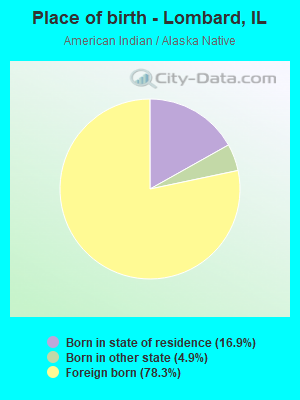
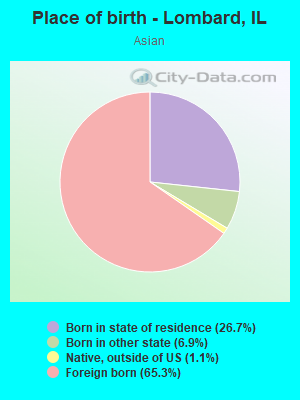
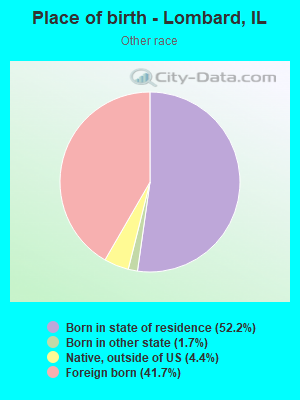
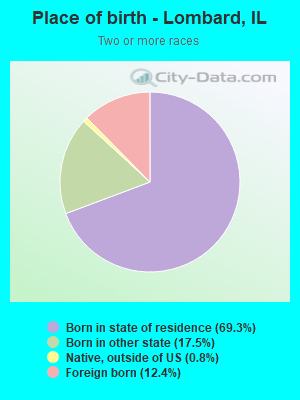
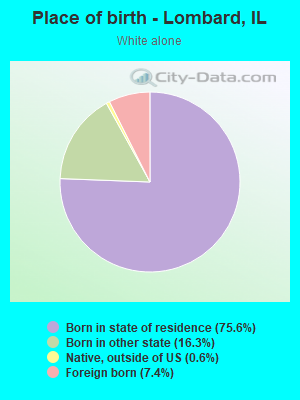
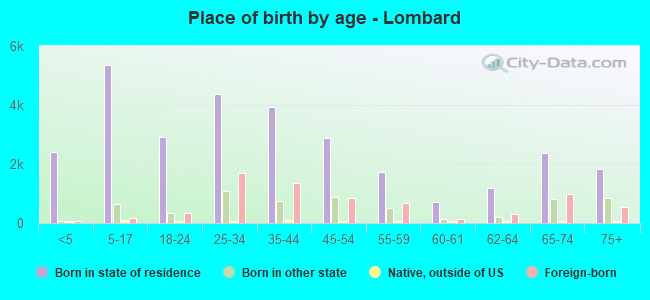
Place of birth - Born in state of residence (%)
Place of birth - Born in state of residence (%) - White
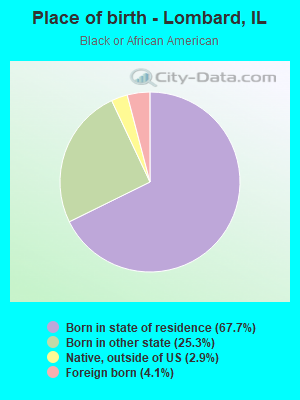
Place of birth - Born in state of residence (%) - Black or African American
Place of birth - Born in state of residence (%) - Asian
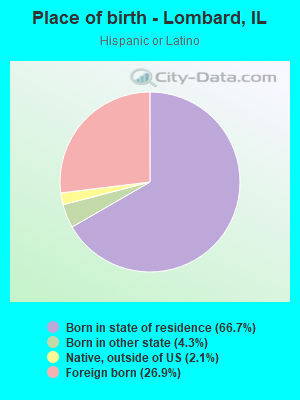
Place of birth - Born in state of residence (%) - Hispanic or Latino
Place of birth - Born in state of residence (%) - American Indian and Alaska Native
Place of birth - Born in state of residence (%) - Multirace
Place of birth - Born in state of residence (%) - Other Race
Place of birth - Born in other state (%)
Place of birth - Born in other state (%) - White
Place of birth - Born in other state (%) - Black or African American
Place of birth - Born in other state (%) - Asian
Place of birth - Born in other state (%) - Hispanic or Latino
Place of birth - Born in other state (%) - American Indian and Alaska Native
Place of birth - Born in other state (%) - Multirace
Place of birth - Born in other state (%) - Other Race
Place of birth - Native, outside of US (%)
Place of birth - Native, outside of US (%) - White
Place of birth - Native, outside of US (%) - Black or African American
Place of birth - Native, outside of US (%) - Asian
Place of birth - Native, outside of US (%) - Hispanic or Latino
Place of birth - Native, outside of US (%) - American Indian and Alaska Native
Place of birth - Native, outside of US (%) - Multirace
Place of birth - Native, outside of US (%) - Other Race
Place of birth - Foreign born (%)
Place of birth - Foreign born (%) - White
Place of birth - Foreign born (%) - Black or African American
Place of birth - Foreign born (%) - Asian
Place of birth - Foreign born (%) - Hispanic or Latino
Place of birth - Foreign born (%) - American Indian and Alaska Native
Place of birth - Foreign born (%) - Multirace
Place of birth - Foreign born (%) - Other Race
Residents speaking English at home (%)
Residents speaking English at home - Born in the United States (%)
Residents speaking English at home - Native, born elsewhere (%)
Residents speaking English at home - Foreign born (%)
Residents speaking Spanish at home (%)
Residents speaking Spanish at home - Born in the United States (%)
Residents speaking Spanish at home - Native, born elsewhere (%)
Residents speaking Spanish at home - Foreign born (%)
Residents speaking other language at home (%)
Residents speaking other language at home - Born in the United States (%)
Residents speaking other language at home - Native, born elsewhere (%)
Residents speaking other language at home - Foreign born (%)
Marital status - Never married (%)
Marital status - Now married (%)
Marital status - Separated (%)
Marital status - Widowed (%)
Marital status - Divorced (%)
Ancestries Reported - Arab (%)
Ancestries Reported - Czech (%)
Ancestries Reported - Danish (%)
Ancestries Reported - Dutch (%)
Ancestries Reported - English (%)
Ancestries Reported - French (%)
Ancestries Reported - French Canadian (%)
Ancestries Reported - German (%)
Ancestries Reported - Greek (%)
Ancestries Reported - Hungarian (%)
Ancestries Reported - Irish (%)
Ancestries Reported - Italian (%)
Ancestries Reported - Lithuanian (%)
Ancestries Reported - Norwegian (%)
Ancestries Reported - Polish (%)
Ancestries Reported - Portuguese (%)
Ancestries Reported - Russian (%)
Ancestries Reported - Scotch-Irish (%)
Ancestries Reported - Scottish (%)
Ancestries Reported - Slovak (%)
Ancestries Reported - Subsaharan African (%)
Ancestries Reported - Swedish (%)
Ancestries Reported - Swiss (%)
Ancestries Reported - Ukrainian (%)
Ancestries Reported - United States (%)
Ancestries Reported - Welsh (%)
Ancestries Reported - West Indian (%)
Ancestries Reported - Other (%)
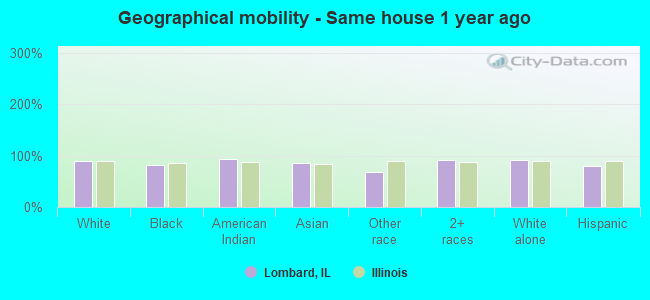
Geographical mobility - Same house 1 year ago (%)
Geographical mobility - Same house 1 year ago (%) - White
Geographical mobility - Same house 1 year ago (%) - Black or African American
Geographical mobility - Same house 1 year ago (%) - Asian
Geographical mobility - Same house 1 year ago (%) - Hispanic or Latino
Geographical mobility - Same house 1 year ago (%) - American Indian and Alaska Native
Geographical mobility - Same house 1 year ago (%) - Multirace
Geographical mobility - Same house 1 year ago (%) - Other Race
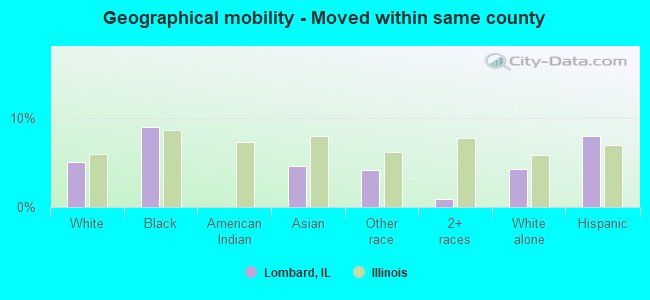
Geographical mobility - Moved within same county (%)
Geographical mobility - Moved within same county (%) - White
Geographical mobility - Moved within same county (%) - Black or African American
Geographical mobility - Moved within same county (%) - Asian
Geographical mobility - Moved within same county (%) - Hispanic or Latino
Geographical mobility - Moved within same county (%) - American Indian and Alaska Native
Geographical mobility - Moved within same county (%) - Multirace
Geographical mobility - Moved within same county (%) - Other Race
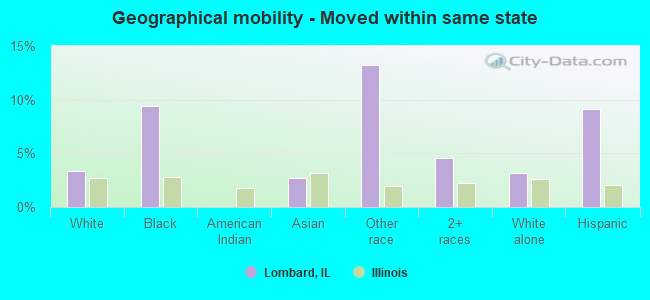
Geographical mobility - Moved from different county within same state (%)
Geographical mobility - Moved from different county within same state (%) - White
Geographical mobility - Moved from different county within same state (%) - Black or African American
Geographical mobility - Moved from different county within same state (%) - Asian
Geographical mobility - Moved from different county within same state (%) - Hispanic or Latino
Geographical mobility - Moved from different county within same state (%) - American Indian and Alaska Native
Geographical mobility - Moved from different county within same state (%) - Multirace
Geographical mobility - Moved from different county within same state (%) - Other Race
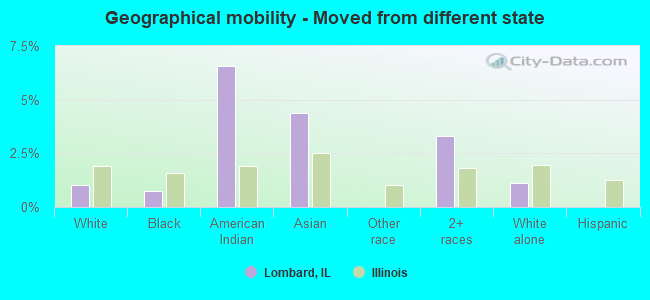
Geographical mobility - Moved from different state (%)
Geographical mobility - Moved from different state (%) - White
Geographical mobility - Moved from different state (%) - Black or African American
Geographical mobility - Moved from different state (%) - Asian
Geographical mobility - Moved from different state (%) - Hispanic or Latino
Geographical mobility - Moved from different state (%) - American Indian and Alaska Native
Geographical mobility - Moved from different state (%) - Multirace
Geographical mobility - Moved from different state (%) - Other Race
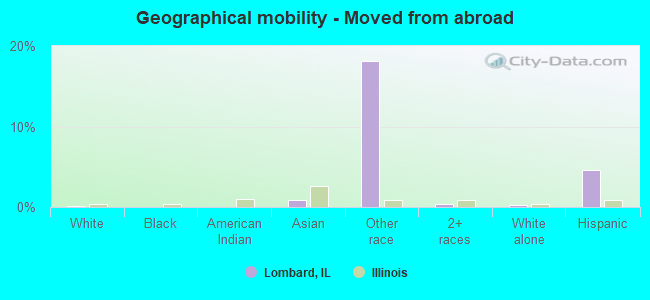
Geographical mobility - Moved from abroad (%)
Geographical mobility - Moved from abroad (%) - White
Geographical mobility - Moved from abroad (%) - Black or African American
Geographical mobility - Moved from abroad (%) - Asian
Geographical mobility - Moved from abroad (%) - Hispanic or Latino
Geographical mobility - Moved from abroad (%) - American Indian and Alaska Native
Geographical mobility - Moved from abroad (%) - Multirace
Geographical mobility - Moved from abroad (%) - Other Race
Place of birth for the foreign-born population - Ireland (%)
Place of birth for the foreign-born population - Denmark (%)
Place of birth for the foreign-born population - Norway (%)
Place of birth for the foreign-born population - Sweden (%)
Place of birth for the foreign-born population - United Kingdom (%)
Place of birth for the foreign-born population - England (%)
Place of birth for the foreign-born population - Scotland (%)
Place of birth for the foreign-born population - Other Northern Europe (%)
Place of birth for the foreign-born population - Austria (%)
Place of birth for the foreign-born population - Belgium (%)
Place of birth for the foreign-born population - France (%)
Place of birth for the foreign-born population - Germany (%)
Place of birth for the foreign-born population - Netherlands (%)
Place of birth for the foreign-born population - Switzerland (%)
Place of birth for the foreign-born population - Other Western Europe (%)
Place of birth for the foreign-born population - Greece (%)
Place of birth for the foreign-born population - Italy (%)
Place of birth for the foreign-born population - Portugal (%)
Place of birth for the foreign-born population - Spain (%)
Place of birth for the foreign-born population - Other Southern Europe (%)
Place of birth for the foreign-born population - Albania (%)
Place of birth for the foreign-born population - Belarus (%)
Place of birth for the foreign-born population - Bosnia and Herzegovina (%)
Place of birth for the foreign-born population - Bulgaria (%)
Place of birth for the foreign-born population - Croatia (%)
Place of birth for the foreign-born population - Czechoslovakia (%)
Place of birth for the foreign-born population - Hungary (%)
Place of birth for the foreign-born population - Latvia (%)
Place of birth for the foreign-born population - Lithuania (%)
Place of birth for the foreign-born population - North Macedonia (Macedonia) (%)
Place of birth for the foreign-born population - Moldova (%)
Place of birth for the foreign-born population - Poland (%)
Place of birth for the foreign-born population - Romania (%)
Place of birth for the foreign-born population - Russia (%)
Place of birth for the foreign-born population - Serbia (%)
Place of birth for the foreign-born population - Ukraine (%)
Place of birth for the foreign-born population - Other Eastern Europe (%)
Place of birth for the foreign-born population - China (%)
Place of birth for the foreign-born population - Hong Kong (%)
Place of birth for the foreign-born population - Taiwan (%)
Place of birth for the foreign-born population - Japan (%)
Place of birth for the foreign-born population - Korea (%)
Place of birth for the foreign-born population - Other Eastern Asia (%)
Place of birth for the foreign-born population - Afghanistan (%)
Place of birth for the foreign-born population - Bangladesh (%)
Place of birth for the foreign-born population - India (%)
Place of birth for the foreign-born population - Iran (%)
Place of birth for the foreign-born population - Kazakhstan (%)
Place of birth for the foreign-born population - Nepal (%)
Place of birth for the foreign-born population - Pakistan (%)
Place of birth for the foreign-born population - Sri Lanka (%)
Place of birth for the foreign-born population - Uzbekistan (%)
Place of birth for the foreign-born population - Other South Central Asia (%)
Place of birth for the foreign-born population - Burma (%)
Place of birth for the foreign-born population - Cambodia (%)
Place of birth for the foreign-born population - Indonesia (%)
Place of birth for the foreign-born population - Laos (%)
Place of birth for the foreign-born population - Malaysia (%)
Place of birth for the foreign-born population - Philippines (%)
Place of birth for the foreign-born population - Singapore (%)
Place of birth for the foreign-born population - Thailand (%)
Place of birth for the foreign-born population - Vietnam (%)
Place of birth for the foreign-born population - Other South Eastern Asia (%)
Place of birth for the foreign-born population - Armenia (%)
Place of birth for the foreign-born population - Iraq (%)
Place of birth for the foreign-born population - Israel (%)
Place of birth for the foreign-born population - Jordan (%)
Place of birth for the foreign-born population - Kuwait (%)
Place of birth for the foreign-born population - Lebanon (%)
Place of birth for the foreign-born population - Saudi Arabia (%)
Place of birth for the foreign-born population - Syria (%)
Place of birth for the foreign-born population - Turkey (%)
Place of birth for the foreign-born population - Yemen (%)
Place of birth for the foreign-born population - Other Western Asia (%)
Place of birth for the foreign-born population - Eritrea (%)
Place of birth for the foreign-born population - Ethiopia (%)
Place of birth for the foreign-born population - Kenya (%)
Place of birth for the foreign-born population - Somalia (%)
Place of birth for the foreign-born population - Uganda (%)
Place of birth for the foreign-born population - Zimbabwe (%)
Place of birth for the foreign-born population - Other Eastern Africa (%)
Place of birth for the foreign-born population - Cameroon (%)
Place of birth for the foreign-born population - Congo (%)
Place of birth for the foreign-born population - Democratic Republic of Congo (Zaire) (%)
Place of birth for the foreign-born population - Other Middle Africa (%)
Place of birth for the foreign-born population - Egypt (%)
Place of birth for the foreign-born population - Morocco (%)
Place of birth for the foreign-born population - Sudan (%)
Place of birth for the foreign-born population - Other Northern Africa (%)
Place of birth for the foreign-born population - South Africa (%)
Place of birth for the foreign-born population - Other Southern Africa (%)
Place of birth for the foreign-born population - Cabo Verde (%)
Place of birth for the foreign-born population - Ghana (%)
Place of birth for the foreign-born population - Liberia (%)
Place of birth for the foreign-born population - Nigeria (%)
Place of birth for the foreign-born population - Senegal (%)
Place of birth for the foreign-born population - Sierra Leone (%)
Place of birth for the foreign-born population - Other Western Africa (%)
Place of birth for the foreign-born population - Australia (%)
Place of birth for the foreign-born population - New Zealand (%)
Place of birth for the foreign-born population - Fiji (%)
Place of birth for the foreign-born population - Micronesia (%)
Place of birth for the foreign-born population - Bahamas (%)
Place of birth for the foreign-born population - Barbados (%)
Place of birth for the foreign-born population - Cuba (%)
Place of birth for the foreign-born population - Dominica (%)
Place of birth for the foreign-born population - Dominican Republic (%)
Place of birth for the foreign-born population - Grenada (%)
Place of birth for the foreign-born population - Haiti (%)
Place of birth for the foreign-born population - Jamaica (%)
Place of birth for the foreign-born population - St. Vincent and the Grenadines (%)
Place of birth for the foreign-born population - Trinidad and Tobago (%)
Place of birth for the foreign-born population - West Indies (%)
Place of birth for the foreign-born population - Other Caribbean (%)
Place of birth for the foreign-born population - Belize (%)
Place of birth for the foreign-born population - Costa Rica (%)
Place of birth for the foreign-born population - El Salvador (%)
Place of birth for the foreign-born population - Guatemala (%)
Place of birth for the foreign-born population - Honduras (%)
Place of birth for the foreign-born population - Mexico (%)
Place of birth for the foreign-born population - Nicaragua (%)
Place of birth for the foreign-born population - Panama (%)
Place of birth for the foreign-born population - Other Central America (%)
Place of birth for the foreign-born population - Argentina (%)
Place of birth for the foreign-born population - Bolivia (%)
Place of birth for the foreign-born population - Brazil (%)
Place of birth for the foreign-born population - Chile (%)
Place of birth for the foreign-born population - Colombia (%)
Place of birth for the foreign-born population - Ecuador (%)
Place of birth for the foreign-born population - Guyana (%)
Place of birth for the foreign-born population - Peru (%)
Place of birth for the foreign-born population - Uruguay (%)
Place of birth for the foreign-born population - Venezuela (%)
Place of birth for the foreign-born population - Other South America (%)
Place of birth for the foreign-born population - Canada (%)
Place of birth for the foreign-born population - Other Northern America (%)
Place of birth for the foreign-born population - Other (%)
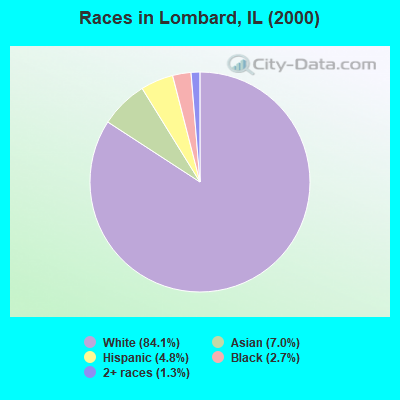
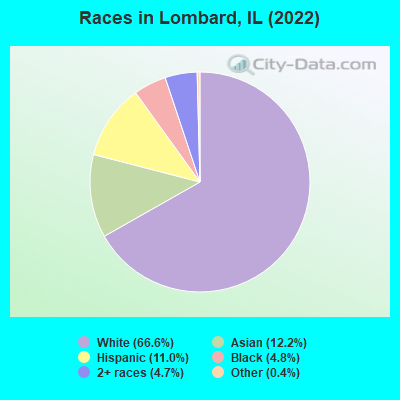
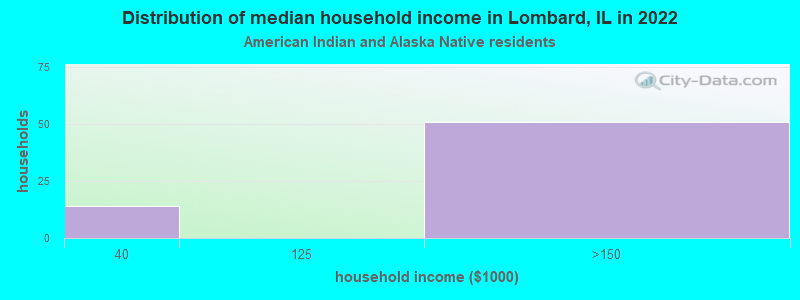
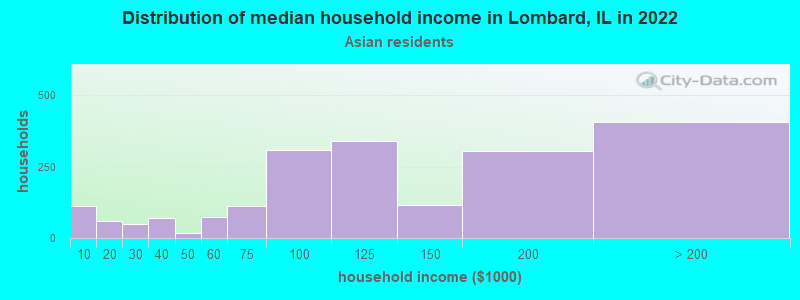
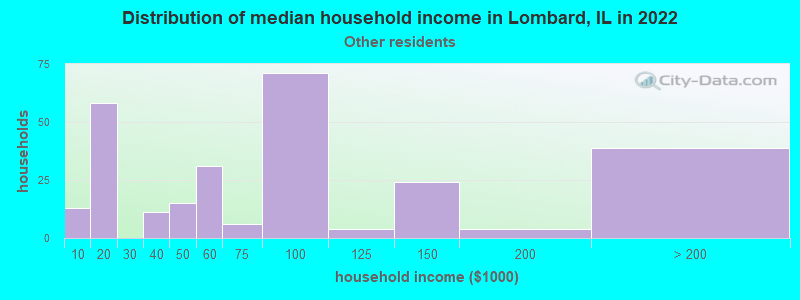
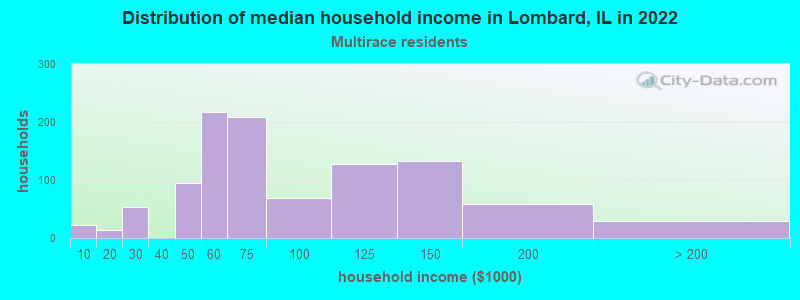
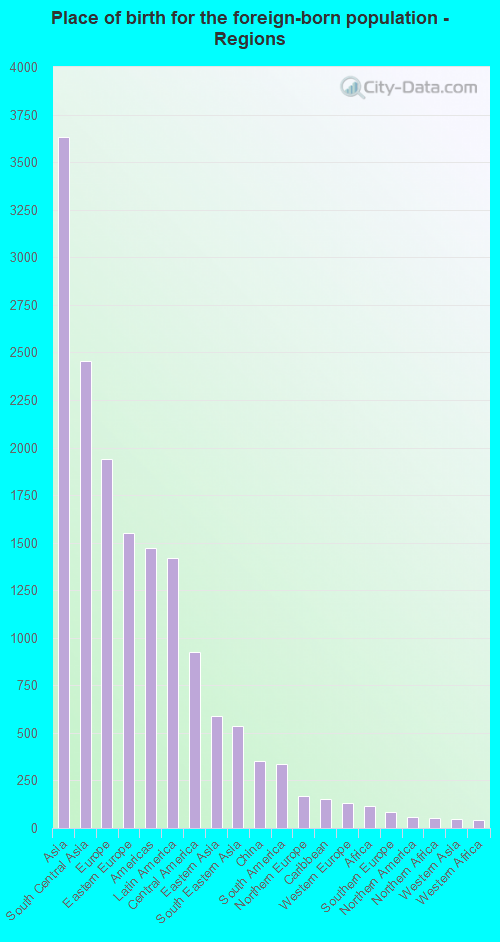
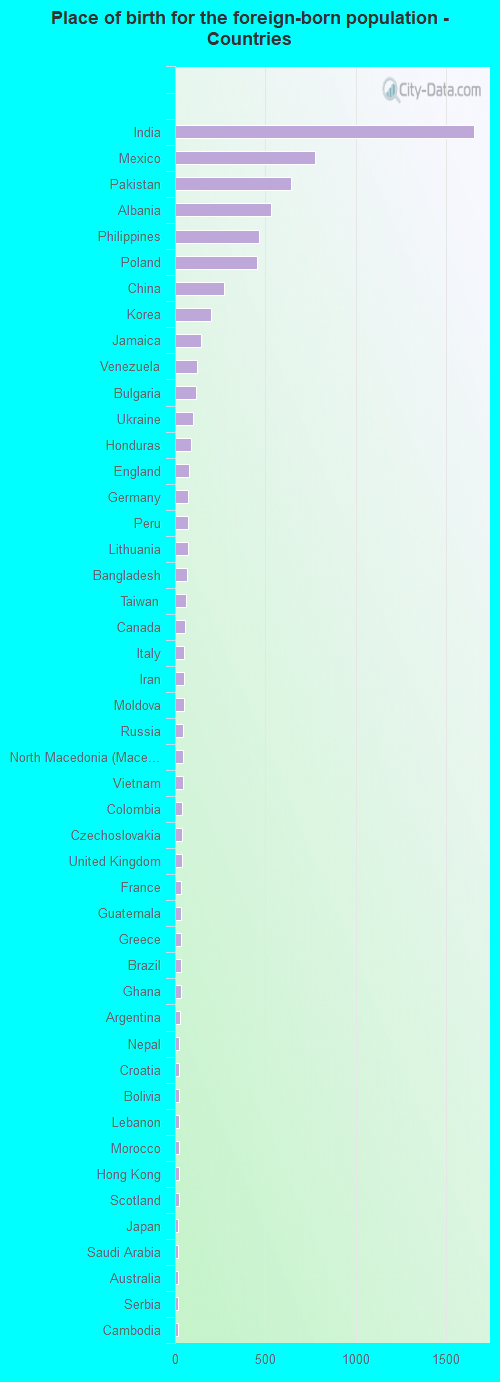
According to 2022 data, the most numerous races in Lombard, IL are White alone (29,057 residents), Hispanic (4,817 residents), and Black alone (2,080 residents). 76.6% of Lombard residents speak English at home. 16.5% of Lombard, IL residents are foreign-born (8.2% born in Asia, 4.4% born in Europe, 3.2% born in Latin America), which is 15.0% greater than the foreign-born rate of 14.0% across the entire state of Illinois.
Race distribution in Lombard
2000 2022
8,424,140 67.8% White alone 1,856,152 14.9% Black alone 1,530,262 12.3% Hispanic 419,916 3.4% Asian alone 153,996 1.2% Two or more races 13,479 0.1% Other race alone 18,232 0.1% American Indian alone 3,116 0.03% Native Hawaiian and Other
7,356,301 58.5% White alone 2,299,726 18.3% Hispanic 1,660,423 13.2% Black alone 747,296 5.9% Asian alone 458,599 3.6% Two or more races 45,386 0.4% Other race alone 10,405 0.08% American Indian alone 3,896 0.03% Native Hawaiian and Other
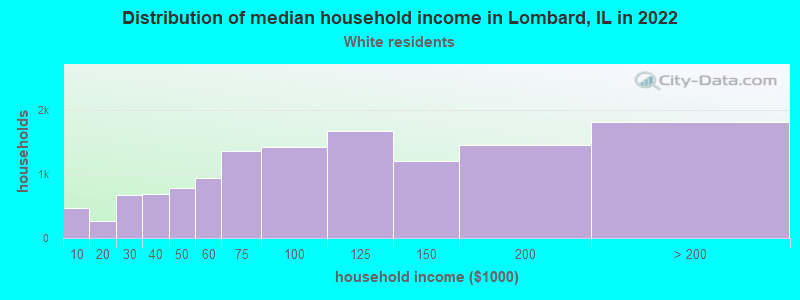
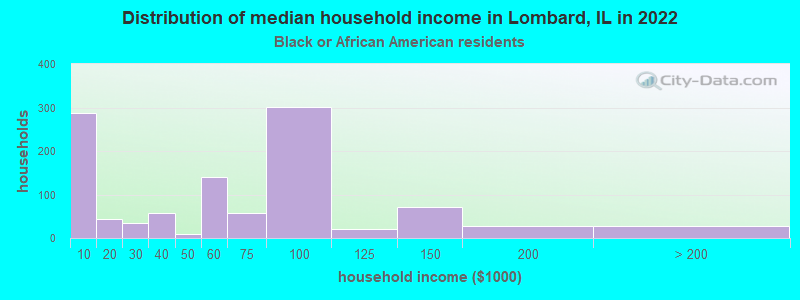
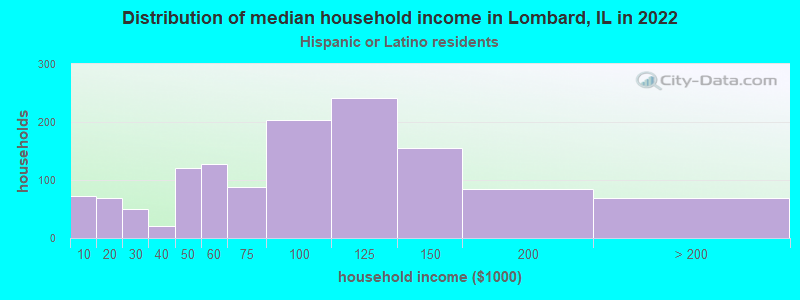
Income and house value in Lombard Median household income in 2022 $93,241 White non-Hispanic householders$63,124 Black householders$114,745 Asian householders$55,987 Some other race householders$77,537 Two or more races householders$82,964 Hispanic or Latino race householdersMedian 2022 house value $321,765 White Non-Hispanic householders$331,133 Black or African American householders$256,380 American Indian or Alaska Native householders $345,281 Asian householders$294,043 Some other race householders$346,046 Two or more races householders$297,485 Hispanic or Latino householders
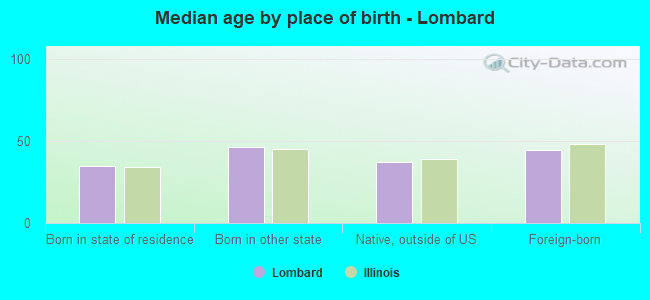
Median age by race in Lombard
41.4 Median age for White residents40.1 43.7 37.9 Median age for Black or African American residents39.5 34.7 68.4 Median age for American Indian / Alaska Native residents-721,943,047.9 53.7 36.3 Median age for Asian residents37.7 34.7 -593,236,714.4 Median age for Native Hawaiian / Pacific Islander residents-658,536,584.7 -576,015,108.0 28.1 Median age for Other race residents25.2 30.0 26.4 Median age for Two or more races residents26.8 25.8 42.1 Median age for White alone residents40.5 45.2 29.2 Median age for Hispanic or Latino residents31.7 27.9
Owner/renter occupied households by race in Lombard
House owners and renters - White residents 9,748 77.4% Owner occupied2,845 22.6% Renter occupiedHouse owners and renters - Black or African American residents 341 33.8% Owner occupied668 66.2% Renter occupiedHouse owners and renters - American Indian / Alaska Native residents 34 100.0% Owner occupiedHouse owners and renters - Asian residents 1,289 66.2% Owner occupied659 33.8% Renter occupiedHouse owners and renters - Other race residents 100 32.9% Owner occupied204 67.1% Renter occupiedHouse owners and renters - Two or more races residents 729 69.5% Owner occupied320 30.5% Renter occupiedHouse owners and renters - White alone residents 9,617 77.1% Owner occupied2,858 22.9% Renter occupiedHouse owners and renters - Hispanic or Latino residents 855 64.0% Owner occupied481 36.0% Renter occupied
Language usage in Lombard
English speakers - Total 76.6% of residents of Lombard speak English at home.
7.0% of residents speak Spanish at home 2,062 71.3% Speak English very well832 28.7% Speak English less than very well16.0% of residents speak other language at home 4,789 73.1% Speak English very well1,763 26.9% Speak English less than very well
English speakers - Born in the United States 89.4% of residents of Lombard speak English at home.
1.3% of residents speak Spanish at home 76 93.8% Speak English very well5 6.2% Speak English less than very well10.9% of residents speak other language at home 579 85.5% Speak English very well98 14.5% Speak English less than very well
English speakers - Native, born elsewhere 67.7% of residents of Lombard speak English at home.
28.4% of residents speak Spanish at home 46 39.7% Speak English very well70 60.3% Speak English less than very well4.6% of residents speak other language at home 14 73.7% Speak English very well5 26.3% Speak English less than very well
English speakers - Foreign-born 12.7% of residents of Lombard speak English at home.
16.0% of residents speak Spanish at home 571 50.2% Speak English very well566 49.8% Speak English less than very well70.1% of residents speak other language at home 3,338 67.0% Speak English very well1,647 33.0% Speak English less than very well
White (Caucasian) - Speak only English Native:
96.2% (25,158)Foreign-born:
17.1% (371)
White (Caucasian) - Speak another language Native:
4.3% (1,130)Foreign-born:
82.7% (1,789)
Black or African American - Speak only English Native:
95.3% (1,857)Foreign-born:
100.0% (85)
Black or African American - Speak another language Native:
4.4% (86)Foreign-born:
14.2% (12)
Asian - Speak only English Native:
54.2% (785)Foreign-born:
6.8% (239)
Asian - Speak another language Native:
44.6% (646)Foreign-born:
93.6% (3,265)
Other race - Speak only English Native:
41.5% (317)Foreign-born:
15.7% (91)
Other race - Speak another language Native:
60.5% (462)Foreign-born:
82.1% (474)
Two or more races - Speak only English Native:
69.6% (2,324)Foreign-born:
8.1% (43)
Two or more races - Speak another language Native:
29.6% (989)Foreign-born:
92.5% (488)
White alone - Speak only English Native:
96.9% (24,723)Foreign-born:
16.8% (360)
White alone - Speak another language Native:
3.2% (811)Foreign-born:
83.1% (1,780)
Hispanic or Latino - Speak only English Native:
47.3% (1,485)Foreign-born:
10.3% (133)
Hispanic or Latino - Speak another language Native:
52.4% (1,646)Foreign-born:
89.3% (1,151)
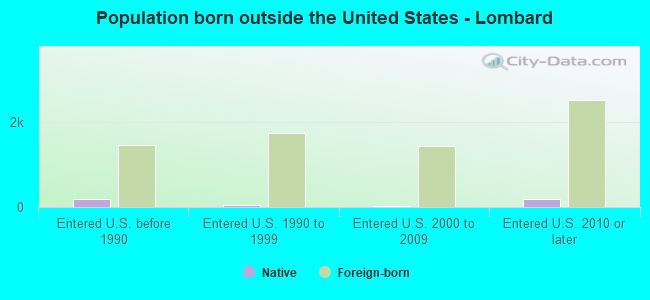
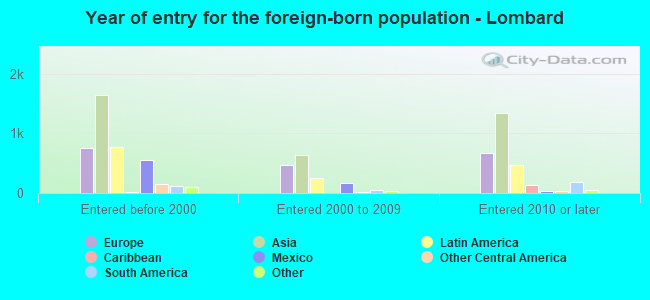
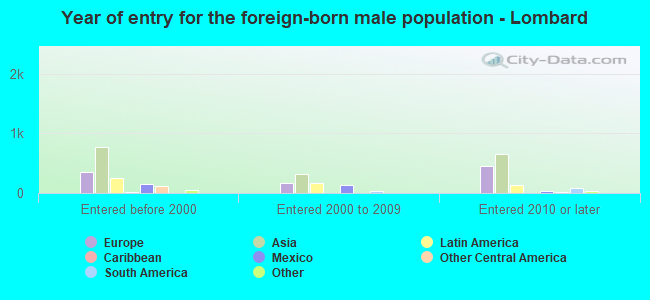
Foreign-born residents in Lombard 7,179 residents are foreign born (8.2% Asia , 4.4% Europe , 3.2% Latin America ).
This city:
16.5%Illinois:
14.1%
Marital status for residents in Lombard Marital status - White (Caucasian) population 15 years and over
Males 34.2% Never married55.5% Now married0.1% Separated3.0% Widowed7.2% DivorcedFemales 27.4% Never married51.5% Now married0.7% Separated10.5% Widowed9.9% DivorcedWomen who gave birth in the past 12 months Now married:
80.5% (306)Unmarried:
19.5% (74)
Women who did not give birth in the past 12 months Now married:
47.9% (2,954)Unmarried:
52.1% (3,212)
Marital status - Black or African American population 15 years and over
Males 38.5% Never married51.3% Now married0.0% Separated6.1% Widowed4.1% DivorcedFemales 33.5% Never married43.6% Now married2.8% Separated9.7% Widowed10.4% DivorcedWomen who gave birth in the past 12 months Now married:
0.0% (0)Unmarried:
100.0% (16)
Women who did not give birth in the past 12 months Now married:
52.9% (333)Unmarried:
47.1% (296)
Marital status - American Indian / Alaska Native population 15 years and over
Males 0.0% Never married100.0% Now married0.0% Separated0.0% Widowed0.0% DivorcedFemales 0.0% Never married100.0% Now married0.0% Separated0.0% Widowed0.0% DivorcedMarital status - Asian population 15 years and over
Males 17.5% Never married76.6% Now married0.0% Separated4.1% Widowed1.7% DivorcedFemales 25.7% Never married63.3% Now married0.0% Separated2.5% Widowed8.5% DivorcedWomen who gave birth in the past 12 months Now married:
100.0% (100)Unmarried:
0.0% (0)
Women who did not give birth in the past 12 months Now married:
55.8% (796)Unmarried:
44.2% (632)
Marital status - Other race population 15 years and over
Males 76.0% Never married21.7% Now married0.0% Separated0.0% Widowed2.4% DivorcedFemales 34.4% Never married57.1% Now married0.0% Separated3.2% Widowed5.2% DivorcedWomen who did not give birth in the past 12 months Now married:
57.3% (181)Unmarried:
42.7% (135)
Marital status - Two or more races population 15 years and over
Males 49.0% Never married40.6% Now married0.0% Separated0.0% Widowed10.4% DivorcedFemales 60.7% Never married27.3% Now married2.4% Separated1.4% Widowed8.3% DivorcedWomen who gave birth in the past 12 months Now married:
0.0% (0)Unmarried:
100.0% (30)
Women who did not give birth in the past 12 months Now married:
23.2% (283)Unmarried:
76.8% (940)
Marital status - White alone, not Hispanic / Latino population 15 years and over
Males 33.8% Never married55.6% Now married0.1% Separated3.2% Widowed7.4% DivorcedFemales 25.2% Never married53.0% Now married0.5% Separated11.2% Widowed10.2% DivorcedWomen who gave birth in the past 12 months Now married:
85.2% (327)Unmarried:
14.8% (57)
Women who did not give birth in the past 12 months Now married:
49.6% (2,905)Unmarried:
50.4% (2,949)
Marital status - Hispanic or Latino population 15 years and over
Males 51.8% Never married42.2% Now married0.0% Separated0.0% Widowed6.0% DivorcedFemales 50.1% Never married37.6% Now married3.0% Separated1.5% Widowed7.7% DivorcedWomen who gave birth in the past 12 months Now married:
0.0% (0)Unmarried:
100.0% (47)
Women who did not give birth in the past 12 months Now married:
38.8% (540)Unmarried:
61.2% (852)
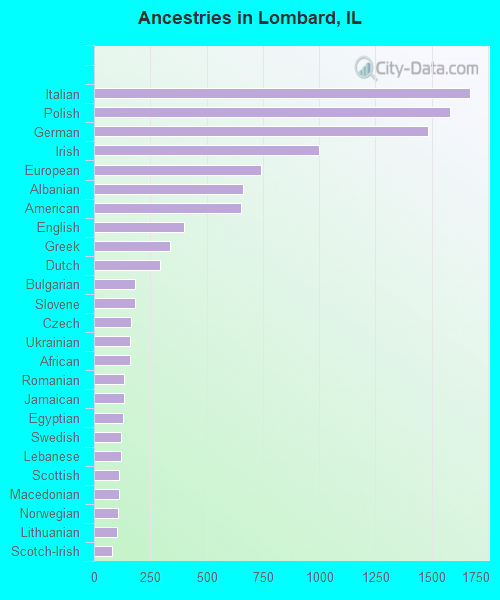
Ancestries in Lombard
1,671 8.5% Italian1,581 8.0% Polish1,484 7.6% German1,001 5.1% Irish740 3.8% European660 3.4% Albanian654 3.3% American399 2.0% English336 1.7% Greek292 1.5% Dutch183 0.9% Bulgarian183 0.9% Slovene163 0.8% Czech161 0.8% Ukrainian160 0.8% African135 0.7% Romanian133 0.7% Jamaican130 0.7% Egyptian119 0.6% Swedish118 0.6% Lebanese113 0.6% Scottish112 0.6% Macedonian106 0.5% Norwegian100 0.5% Lithuanian79 0.4% Scotch-Irish71 0.4% Iranian68 0.3% Russian60 0.3% Serbian49 0.2% Yugoslavian48 0.2% Eastern European48 0.2% Somali46 0.2% Croatian40 0.2% Swiss39 0.2% Slovak39 0.2% Assyrian38 0.2% Danish38 0.2% Haitian37 0.2% Czechoslovakian33 0.2% French33 0.2% Northern European33 0.2% Trinidadian and Tobagonian31 0.2% Australian30 0.2% Austrian28 0.1% British20 0.1% Hungarian20 0.1% Welsh19 0.10% Moroccan19 0.10% Brazilian17 0.09% Belgian15 0.08% Scandinavian12 0.06% Finnish12 0.06% Ethiopian11 0.06% Canadian11 0.06% Nigerian8 0.04% French Canadian6 0.03% Turkish6 0.03% Armenian6 0.03% Jordanian2 0.01% Celtic1 0.01% Palestinian
Geographical mobility in Lombard Same house 1 year ago 26,523 90.1% White (Caucasian)1,699 81.5% Black or African American109 93.1% American Indian / Alaska Native4,588 85.5% Asian958 68.6% Other race3,777 91.7% Two or more races26,189 91.1% White alone, not Hispanic / Latino3,769 79.2% Hispanic or LatinoMoved within same county 1,473 5.0% White / Caucasian186 8.9% Black or African American248 4.6% Asian57 4.1% Other race37 0.9% Two or more races1,219 4.2% White alone, not Hispanic / Latino380 8.0% Hispanic or LatinoMoved within same state 988 3.4% White / Caucasian195 9.4% Black or African American145 2.7% Asian185 13.2% Other race188 4.6% Two or more races901 3.1% White alone, not Hispanic / Latino435 9.1% Hispanic or LatinoMoved from different state 307 1.0% White / Caucasian15 0.7% Black or African American8 6.6% American Indian / Alaska Native235 4.4% Asian135 3.3% Two or more races319 1.1% White alone, not Hispanic / LatinoMoved from abroad 53 0.2% White48 0.9% Asian252 18.1% Other race17 0.4% Two or more races56 0.2% White alone, not Hispanic / Latino221 4.6% Hispanic or Latino
Children Nativity (place of birth) in Lombard
Children under 6 years - Living with two parents Both parents native 1,851 99.9% Native1 0.1% Foreign-bornBoth parents foreign-born 534 95.9% Native23 4.1% Foreign-bornOne native, one foreign-born parent 202 100.0% NativeChildren under 6 years - Living with one parent Native parent 409 100.0% NativeForeign-born parent 26 100.0% NativeChildren 6 to 17 years - Living with two parents Both parents native 2,984 99.5% Native15 0.5% Foreign-bornBoth parents foreign-born 453 79.6% Native116 20.4% Foreign-bornOne native, one foreign-born parent 532 100.0% NativeChildren 6 to 17 years - Living with one parent Native parent 1,025 100.0% NativeForeign-born parent 337 48.7% Native355 51.3% Foreign-born
Grandparents responsible for own grandchildren in Lombard
Grandparents (30 to 59 years) White / Caucasian 139 55.0% Responsible for grandchildren113 45.0% Not responsible for grandchildrenAsian 4 18.5% Responsible for grandchildren18 81.5% Not responsible for grandchildrenOther race 46 100.0% Not responsible for grandchildrenWhite alone, not Hispanic / Latino 9 10.3% Responsible for grandchildren78 89.7% Not responsible for grandchildrenHispanic or Latino 69 33.2% Responsible for grandchildren138 66.8% Not responsible for grandchildrenGrandparents (60 years and over) White / Caucasian 8 4.4% Responsible for grandchildren167 95.6% Not responsible for grandchildrenAsian 94 100.0% Not responsible for grandchildrenOther race 14 100.0% Not responsible for grandchildrenWhite alone, not Hispanic / Latino 8 4.8% Responsible for grandchildren167 95.2% Not responsible for grandchildrenHispanic or Latino 24 42.9% Responsible for grandchildren32 57.1% Not responsible for grandchildren