Races in Long Branch, New Jersey (NJ) Detailed Stats
Data:
Races - White alone (%)
Races - White alone (% change since 2000)
Races - Black alone (%)
Races - Black alone (% change since 2000)
Races - American Indian alone (%)
Races - American Indian alone (% change since 2000)
Races - Asian alone (%)
Races - Asian alone (% change since 2000)
Races - Hispanic (%)
Races - Hispanic (% change since 2000)
Races - Native Hawaiian and Other Pacific Islander alone (%)
Races - Native Hawaiian and Other Pacific Islander alone (% change since 2000)
Races - Two or more races(%)
Races - Two or more races(% change since 2000)
Races - Other race alone (%)
Races - Other race alone (% change since 2000)
Racial diversity
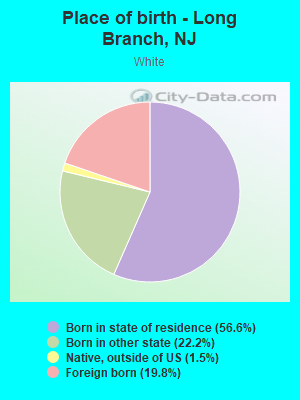
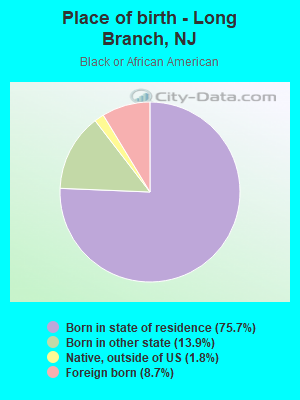
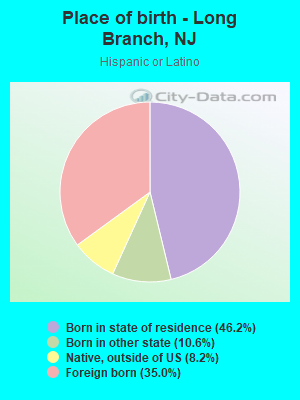
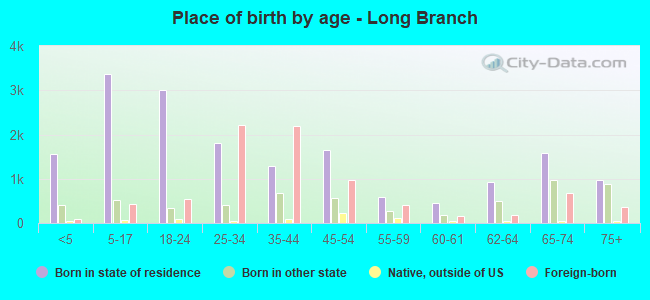
Place of birth - Born in state of residence (%)
Place of birth - Born in state of residence (%) - White
Place of birth - Born in state of residence (%) - Black or African American
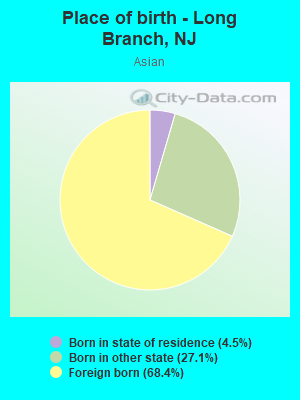
Place of birth - Born in state of residence (%) - Asian
Place of birth - Born in state of residence (%) - Hispanic or Latino
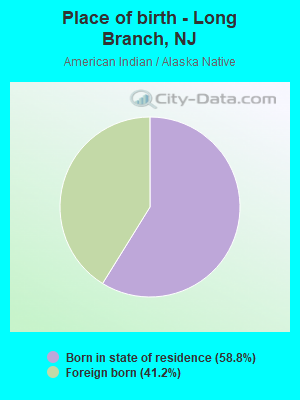
Place of birth - Born in state of residence (%) - American Indian and Alaska Native
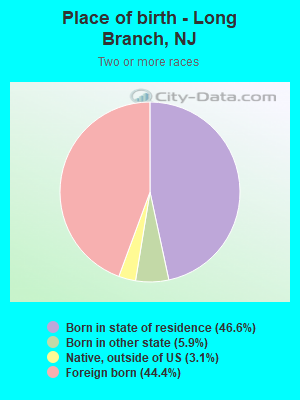
Place of birth - Born in state of residence (%) - Multirace
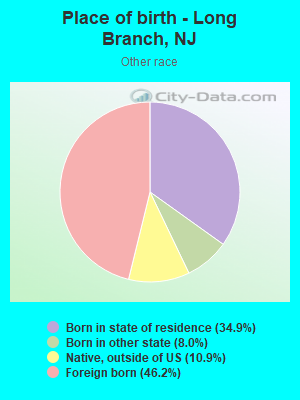
Place of birth - Born in state of residence (%) - Other Race
Place of birth - Born in other state (%)
Place of birth - Born in other state (%) - White
Place of birth - Born in other state (%) - Black or African American
Place of birth - Born in other state (%) - Asian
Place of birth - Born in other state (%) - Hispanic or Latino
Place of birth - Born in other state (%) - American Indian and Alaska Native
Place of birth - Born in other state (%) - Multirace
Place of birth - Born in other state (%) - Other Race
Place of birth - Native, outside of US (%)
Place of birth - Native, outside of US (%) - White
Place of birth - Native, outside of US (%) - Black or African American
Place of birth - Native, outside of US (%) - Asian
Place of birth - Native, outside of US (%) - Hispanic or Latino
Place of birth - Native, outside of US (%) - American Indian and Alaska Native
Place of birth - Native, outside of US (%) - Multirace
Place of birth - Native, outside of US (%) - Other Race
Place of birth - Foreign born (%)
Place of birth - Foreign born (%) - White
Place of birth - Foreign born (%) - Black or African American
Place of birth - Foreign born (%) - Asian
Place of birth - Foreign born (%) - Hispanic or Latino
Place of birth - Foreign born (%) - American Indian and Alaska Native
Place of birth - Foreign born (%) - Multirace
Place of birth - Foreign born (%) - Other Race
Residents speaking English at home (%)
Residents speaking English at home - Born in the United States (%)
Residents speaking English at home - Native, born elsewhere (%)
Residents speaking English at home - Foreign born (%)
Residents speaking Spanish at home (%)
Residents speaking Spanish at home - Born in the United States (%)
Residents speaking Spanish at home - Native, born elsewhere (%)
Residents speaking Spanish at home - Foreign born (%)
Residents speaking other language at home (%)
Residents speaking other language at home - Born in the United States (%)
Residents speaking other language at home - Native, born elsewhere (%)
Residents speaking other language at home - Foreign born (%)
Marital status - Never married (%)
Marital status - Now married (%)
Marital status - Separated (%)
Marital status - Widowed (%)
Marital status - Divorced (%)
Ancestries Reported - Arab (%)
Ancestries Reported - Czech (%)
Ancestries Reported - Danish (%)
Ancestries Reported - Dutch (%)
Ancestries Reported - English (%)
Ancestries Reported - French (%)
Ancestries Reported - French Canadian (%)
Ancestries Reported - German (%)
Ancestries Reported - Greek (%)
Ancestries Reported - Hungarian (%)
Ancestries Reported - Irish (%)
Ancestries Reported - Italian (%)
Ancestries Reported - Lithuanian (%)
Ancestries Reported - Norwegian (%)
Ancestries Reported - Polish (%)
Ancestries Reported - Portuguese (%)
Ancestries Reported - Russian (%)
Ancestries Reported - Scotch-Irish (%)
Ancestries Reported - Scottish (%)
Ancestries Reported - Slovak (%)
Ancestries Reported - Subsaharan African (%)
Ancestries Reported - Swedish (%)
Ancestries Reported - Swiss (%)
Ancestries Reported - Ukrainian (%)
Ancestries Reported - United States (%)
Ancestries Reported - Welsh (%)
Ancestries Reported - West Indian (%)
Ancestries Reported - Other (%)
Geographical mobility - Same house 1 year ago (%)
Geographical mobility - Same house 1 year ago (%) - White
Geographical mobility - Same house 1 year ago (%) - Black or African American
Geographical mobility - Same house 1 year ago (%) - Asian
Geographical mobility - Same house 1 year ago (%) - Hispanic or Latino
Geographical mobility - Same house 1 year ago (%) - American Indian and Alaska Native
Geographical mobility - Same house 1 year ago (%) - Multirace
Geographical mobility - Same house 1 year ago (%) - Other Race
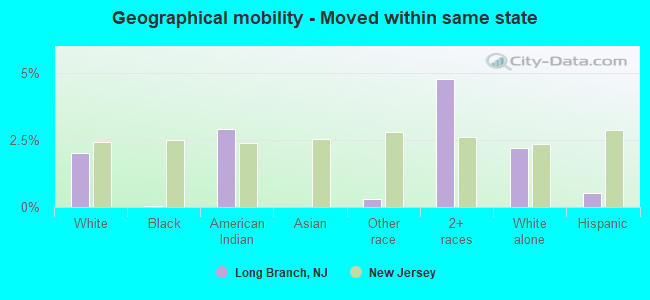
Geographical mobility - Moved within same county (%)
Geographical mobility - Moved within same county (%) - White
Geographical mobility - Moved within same county (%) - Black or African American
Geographical mobility - Moved within same county (%) - Asian
Geographical mobility - Moved within same county (%) - Hispanic or Latino
Geographical mobility - Moved within same county (%) - American Indian and Alaska Native
Geographical mobility - Moved within same county (%) - Multirace
Geographical mobility - Moved within same county (%) - Other Race
Geographical mobility - Moved from different county within same state (%)
Geographical mobility - Moved from different county within same state (%) - White
Geographical mobility - Moved from different county within same state (%) - Black or African American
Geographical mobility - Moved from different county within same state (%) - Asian
Geographical mobility - Moved from different county within same state (%) - Hispanic or Latino
Geographical mobility - Moved from different county within same state (%) - American Indian and Alaska Native
Geographical mobility - Moved from different county within same state (%) - Multirace
Geographical mobility - Moved from different county within same state (%) - Other Race
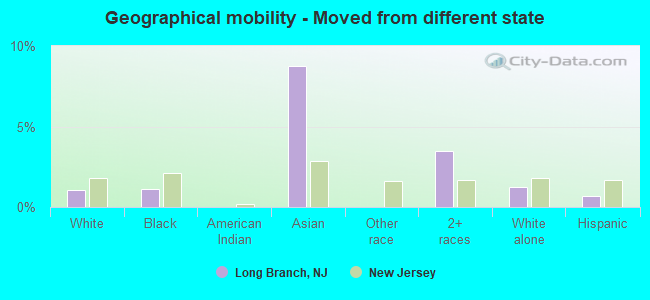
Geographical mobility - Moved from different state (%)
Geographical mobility - Moved from different state (%) - White
Geographical mobility - Moved from different state (%) - Black or African American
Geographical mobility - Moved from different state (%) - Asian
Geographical mobility - Moved from different state (%) - Hispanic or Latino
Geographical mobility - Moved from different state (%) - American Indian and Alaska Native
Geographical mobility - Moved from different state (%) - Multirace
Geographical mobility - Moved from different state (%) - Other Race
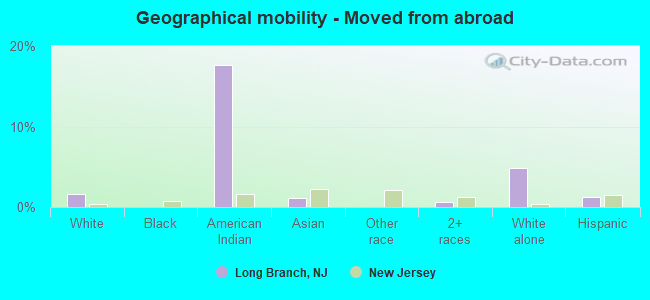
Geographical mobility - Moved from abroad (%)
Geographical mobility - Moved from abroad (%) - White
Geographical mobility - Moved from abroad (%) - Black or African American
Geographical mobility - Moved from abroad (%) - Asian
Geographical mobility - Moved from abroad (%) - Hispanic or Latino
Geographical mobility - Moved from abroad (%) - American Indian and Alaska Native
Geographical mobility - Moved from abroad (%) - Multirace
Geographical mobility - Moved from abroad (%) - Other Race
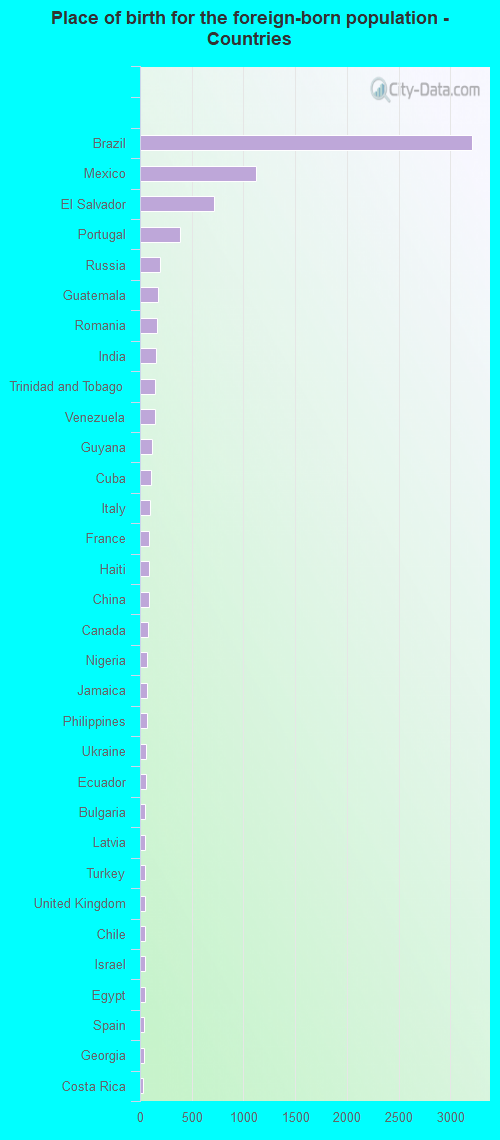
Place of birth for the foreign-born population - Ireland (%)
Place of birth for the foreign-born population - Denmark (%)
Place of birth for the foreign-born population - Norway (%)
Place of birth for the foreign-born population - Sweden (%)
Place of birth for the foreign-born population - United Kingdom (%)
Place of birth for the foreign-born population - England (%)
Place of birth for the foreign-born population - Scotland (%)
Place of birth for the foreign-born population - Other Northern Europe (%)
Place of birth for the foreign-born population - Austria (%)
Place of birth for the foreign-born population - Belgium (%)
Place of birth for the foreign-born population - France (%)
Place of birth for the foreign-born population - Germany (%)
Place of birth for the foreign-born population - Netherlands (%)
Place of birth for the foreign-born population - Switzerland (%)
Place of birth for the foreign-born population - Other Western Europe (%)
Place of birth for the foreign-born population - Greece (%)
Place of birth for the foreign-born population - Italy (%)
Place of birth for the foreign-born population - Portugal (%)
Place of birth for the foreign-born population - Spain (%)
Place of birth for the foreign-born population - Other Southern Europe (%)
Place of birth for the foreign-born population - Albania (%)
Place of birth for the foreign-born population - Belarus (%)
Place of birth for the foreign-born population - Bosnia and Herzegovina (%)
Place of birth for the foreign-born population - Bulgaria (%)
Place of birth for the foreign-born population - Croatia (%)
Place of birth for the foreign-born population - Czechoslovakia (%)
Place of birth for the foreign-born population - Hungary (%)
Place of birth for the foreign-born population - Latvia (%)
Place of birth for the foreign-born population - Lithuania (%)
Place of birth for the foreign-born population - North Macedonia (Macedonia) (%)
Place of birth for the foreign-born population - Moldova (%)
Place of birth for the foreign-born population - Poland (%)
Place of birth for the foreign-born population - Romania (%)
Place of birth for the foreign-born population - Russia (%)
Place of birth for the foreign-born population - Serbia (%)
Place of birth for the foreign-born population - Ukraine (%)
Place of birth for the foreign-born population - Other Eastern Europe (%)
Place of birth for the foreign-born population - China (%)
Place of birth for the foreign-born population - Hong Kong (%)
Place of birth for the foreign-born population - Taiwan (%)
Place of birth for the foreign-born population - Japan (%)
Place of birth for the foreign-born population - Korea (%)
Place of birth for the foreign-born population - Other Eastern Asia (%)
Place of birth for the foreign-born population - Afghanistan (%)
Place of birth for the foreign-born population - Bangladesh (%)
Place of birth for the foreign-born population - India (%)
Place of birth for the foreign-born population - Iran (%)
Place of birth for the foreign-born population - Kazakhstan (%)
Place of birth for the foreign-born population - Nepal (%)
Place of birth for the foreign-born population - Pakistan (%)
Place of birth for the foreign-born population - Sri Lanka (%)
Place of birth for the foreign-born population - Uzbekistan (%)
Place of birth for the foreign-born population - Other South Central Asia (%)
Place of birth for the foreign-born population - Burma (%)
Place of birth for the foreign-born population - Cambodia (%)
Place of birth for the foreign-born population - Indonesia (%)
Place of birth for the foreign-born population - Laos (%)
Place of birth for the foreign-born population - Malaysia (%)
Place of birth for the foreign-born population - Philippines (%)
Place of birth for the foreign-born population - Singapore (%)
Place of birth for the foreign-born population - Thailand (%)
Place of birth for the foreign-born population - Vietnam (%)
Place of birth for the foreign-born population - Other South Eastern Asia (%)
Place of birth for the foreign-born population - Armenia (%)
Place of birth for the foreign-born population - Iraq (%)
Place of birth for the foreign-born population - Israel (%)
Place of birth for the foreign-born population - Jordan (%)
Place of birth for the foreign-born population - Kuwait (%)
Place of birth for the foreign-born population - Lebanon (%)
Place of birth for the foreign-born population - Saudi Arabia (%)
Place of birth for the foreign-born population - Syria (%)
Place of birth for the foreign-born population - Turkey (%)
Place of birth for the foreign-born population - Yemen (%)
Place of birth for the foreign-born population - Other Western Asia (%)
Place of birth for the foreign-born population - Eritrea (%)
Place of birth for the foreign-born population - Ethiopia (%)
Place of birth for the foreign-born population - Kenya (%)
Place of birth for the foreign-born population - Somalia (%)
Place of birth for the foreign-born population - Uganda (%)
Place of birth for the foreign-born population - Zimbabwe (%)
Place of birth for the foreign-born population - Other Eastern Africa (%)
Place of birth for the foreign-born population - Cameroon (%)
Place of birth for the foreign-born population - Congo (%)
Place of birth for the foreign-born population - Democratic Republic of Congo (Zaire) (%)
Place of birth for the foreign-born population - Other Middle Africa (%)
Place of birth for the foreign-born population - Egypt (%)
Place of birth for the foreign-born population - Morocco (%)
Place of birth for the foreign-born population - Sudan (%)
Place of birth for the foreign-born population - Other Northern Africa (%)
Place of birth for the foreign-born population - South Africa (%)
Place of birth for the foreign-born population - Other Southern Africa (%)
Place of birth for the foreign-born population - Cabo Verde (%)
Place of birth for the foreign-born population - Ghana (%)
Place of birth for the foreign-born population - Liberia (%)
Place of birth for the foreign-born population - Nigeria (%)
Place of birth for the foreign-born population - Senegal (%)
Place of birth for the foreign-born population - Sierra Leone (%)
Place of birth for the foreign-born population - Other Western Africa (%)
Place of birth for the foreign-born population - Australia (%)
Place of birth for the foreign-born population - New Zealand (%)
Place of birth for the foreign-born population - Fiji (%)
Place of birth for the foreign-born population - Micronesia (%)
Place of birth for the foreign-born population - Bahamas (%)
Place of birth for the foreign-born population - Barbados (%)
Place of birth for the foreign-born population - Cuba (%)
Place of birth for the foreign-born population - Dominica (%)
Place of birth for the foreign-born population - Dominican Republic (%)
Place of birth for the foreign-born population - Grenada (%)
Place of birth for the foreign-born population - Haiti (%)
Place of birth for the foreign-born population - Jamaica (%)
Place of birth for the foreign-born population - St. Vincent and the Grenadines (%)
Place of birth for the foreign-born population - Trinidad and Tobago (%)
Place of birth for the foreign-born population - West Indies (%)
Place of birth for the foreign-born population - Other Caribbean (%)
Place of birth for the foreign-born population - Belize (%)
Place of birth for the foreign-born population - Costa Rica (%)
Place of birth for the foreign-born population - El Salvador (%)
Place of birth for the foreign-born population - Guatemala (%)
Place of birth for the foreign-born population - Honduras (%)
Place of birth for the foreign-born population - Mexico (%)
Place of birth for the foreign-born population - Nicaragua (%)
Place of birth for the foreign-born population - Panama (%)
Place of birth for the foreign-born population - Other Central America (%)
Place of birth for the foreign-born population - Argentina (%)
Place of birth for the foreign-born population - Bolivia (%)
Place of birth for the foreign-born population - Brazil (%)
Place of birth for the foreign-born population - Chile (%)
Place of birth for the foreign-born population - Colombia (%)
Place of birth for the foreign-born population - Ecuador (%)
Place of birth for the foreign-born population - Guyana (%)
Place of birth for the foreign-born population - Peru (%)
Place of birth for the foreign-born population - Uruguay (%)
Place of birth for the foreign-born population - Venezuela (%)
Place of birth for the foreign-born population - Other South America (%)
Place of birth for the foreign-born population - Canada (%)
Place of birth for the foreign-born population - Other Northern America (%)
Place of birth for the foreign-born population - Other (%)
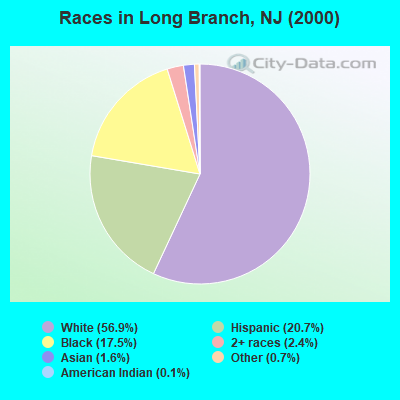
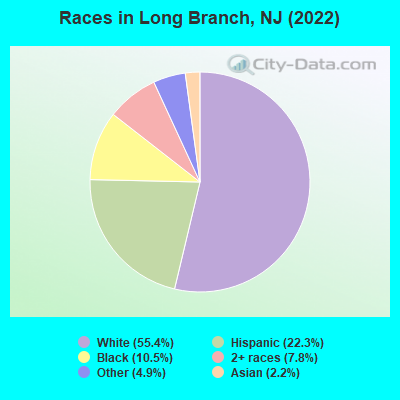
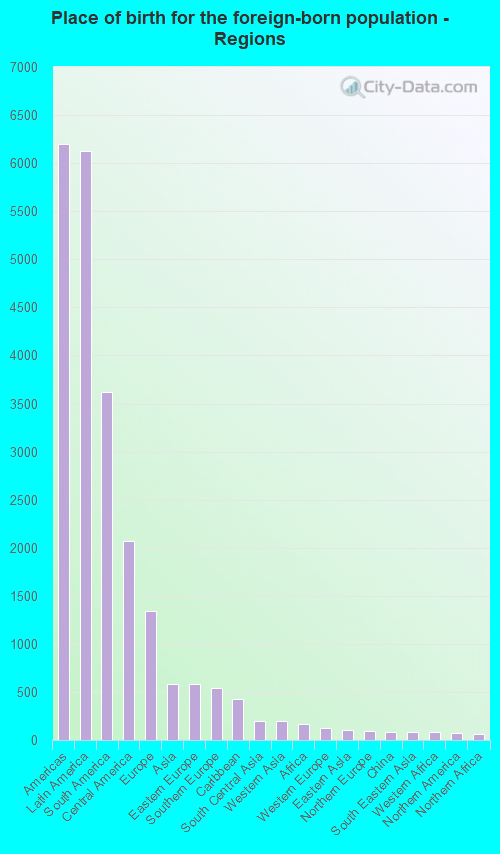
According to 2022 data, the most numerous races in Long Branch, NJ are White alone (17,713 residents), Hispanic (7,120 residents), and Black alone (3,345 residents). 64.5% of Long Branch residents speak English at home. 25.9% of Long Branch, NJ residents are foreign-born (18.9% born in Latin America, 4.1% born in Europe), which is 11.3% greater than the foreign-born rate of 23.0% across the entire state of New Jersey.
Race distribution in Long Branch
2000 2022
5,557,209 66.0% White alone 1,117,191 13.3% Hispanic 1,096,171 13.0% Black alone 477,012 5.7% Asian alone 133,689 1.6% Two or more races 19,565 0.2% Other race alone 11,338 0.1% American Indian alone 2,175 0.03% Native Hawaiian and Other
4,766,476 51.5% White alone 2,028,470 21.9% Hispanic 1,111,632 12.0% Black alone 923,546 10.0% Asian alone 332,237 3.6% Two or more races 89,847 1.0% Other race alone 8,557 0.09% American Indian alone 934 0.01% Native Hawaiian and Other
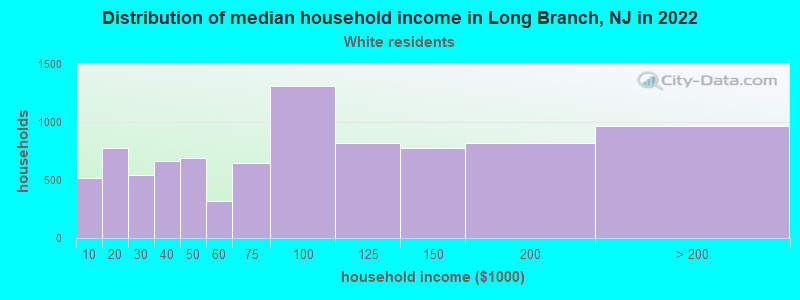
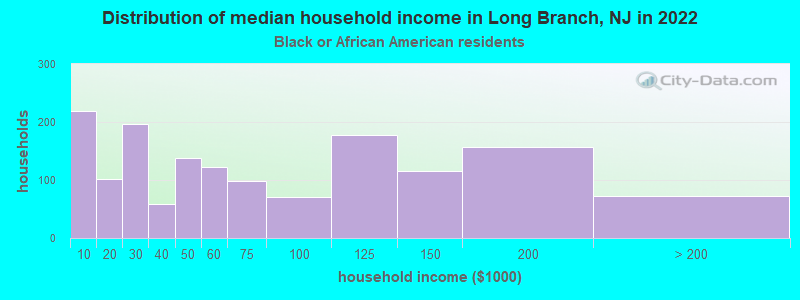
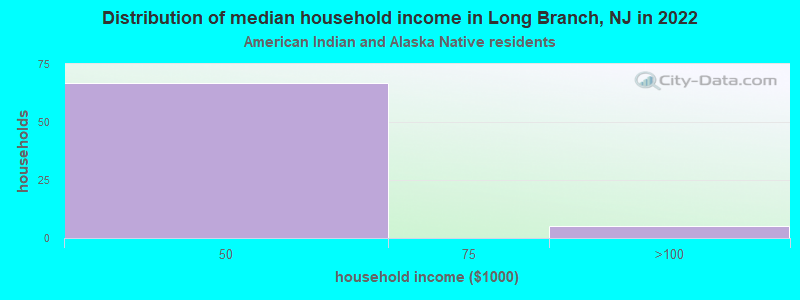
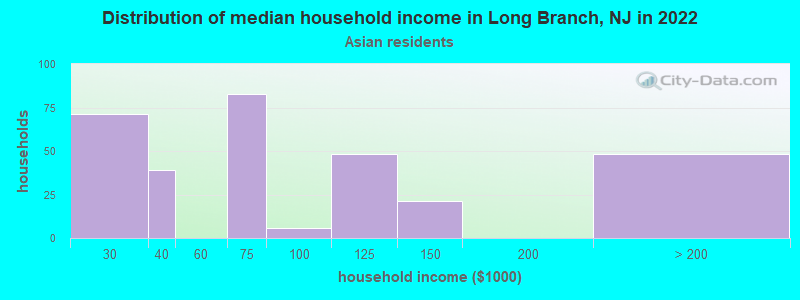
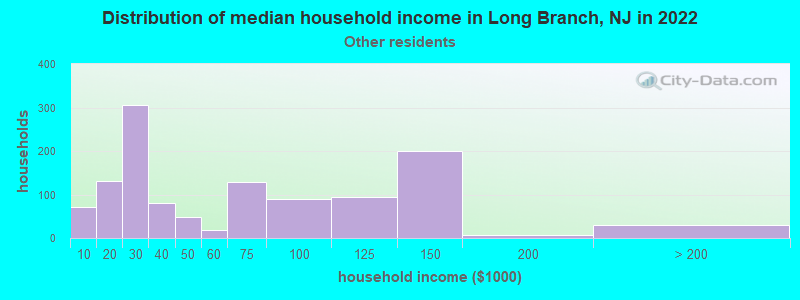
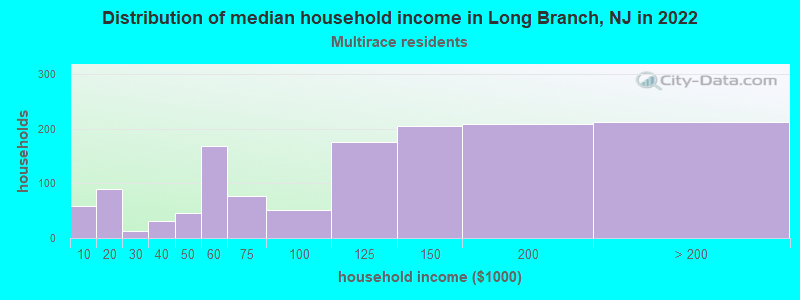
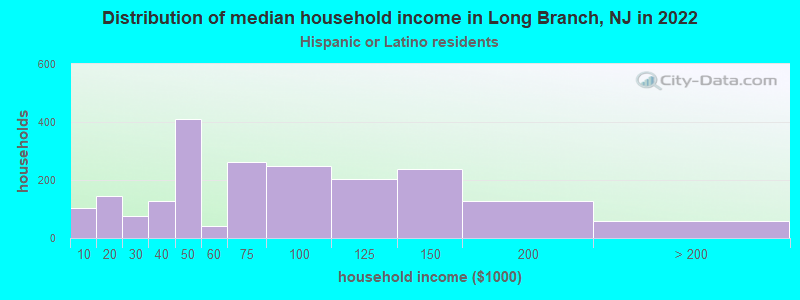
Income and house value in Long Branch Median household income in 2022 $76,787 White non-Hispanic householders$43,682 Black householders$60,485 Asian householders$48,377 Some other race householders$111,524 Two or more races householders$63,472 Hispanic or Latino race householdersMedian 2022 house value $506,998 White Non-Hispanic householders$366,126 Black or African American householders$346,461 American Indian or Alaska Native householders $470,886 Asian householders$412,249 Some other race householders$469,456 Two or more races householders$414,037 Hispanic or Latino householders
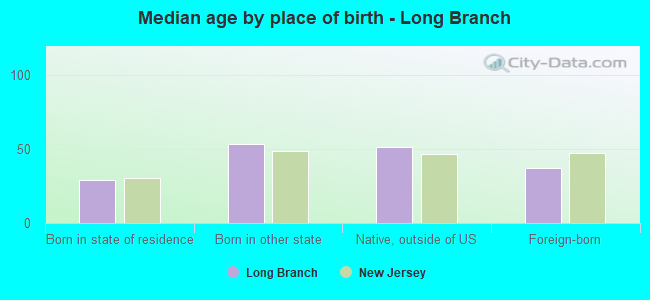
Median age by race in Long Branch
40.3 Median age for White residents43.1 38.4 40.2 Median age for Black or African American residents40.5 37.1 18.4 Median age for American Indian / Alaska Native residents21.8 17.8 39.0 Median age for Asian residents61.3 37.6 -804,177,544.9 Median age for Native Hawaiian / Pacific Islander residents-860,335,194.7 -713,070,378.3 34.3 Median age for Other race residents32.3 39.9 26.0 Median age for Two or more races residents26.6 28.0 42.8 Median age for White alone residents45.3 40.6 25.5 Median age for Hispanic or Latino residents25.7 25.1
Owner/renter occupied households by race in Long Branch
House owners and renters - White residents 4,367 50.5% Owner occupied4,276 49.5% Renter occupiedHouse owners and renters - Black or African American residents 575 36.1% Owner occupied1,021 63.9% Renter occupiedHouse owners and renters - American Indian / Alaska Native residents 74 100.0% Renter occupiedHouse owners and renters - Asian residents 161 46.0% Owner occupied189 54.0% Renter occupiedHouse owners and renters - Other race residents 368 30.9% Owner occupied822 69.1% Renter occupiedHouse owners and renters - Two or more races residents 178 12.6% Owner occupied1,238 87.4% Renter occupiedHouse owners and renters - White alone residents 4,211 51.9% Owner occupied3,902 48.1% Renter occupiedHouse owners and renters - Hispanic or Latino residents 466 23.9% Owner occupied1,485 76.1% Renter occupied
Language usage in Long Branch
English speakers - Total 64.5% of residents of Long Branch speak English at home.
14.0% of residents speak Spanish at home 2,101 50.2% Speak English very well2,085 49.8% Speak English less than very well22.1% of residents speak other language at home 3,112 47.1% Speak English very well3,496 52.9% Speak English less than very well
English speakers - Born in the United States 88.4% of residents of Long Branch speak English at home.
6.8% of residents speak Spanish at home 347 95.1% Speak English very well18 4.9% Speak English less than very well4.1% of residents speak other language at home 206 93.6% Speak English very well14 6.4% Speak English less than very well
English speakers - Native, born elsewhere 28.0% of residents of Long Branch speak English at home.
52.1% of residents speak Spanish at home 300 74.4% Speak English very well103 25.6% Speak English less than very well17.2% of residents speak other language at home 81 60.9% Speak English very well52 39.1% Speak English less than very well
English speakers - Foreign-born 11.4% of residents of Long Branch speak English at home.
28.5% of residents speak Spanish at home 487 20.9% Speak English very well1,845 79.1% Speak English less than very well63.2% of residents speak other language at home 1,846 35.7% Speak English very well3,329 64.3% Speak English less than very well
White (Caucasian) - Speak only English Native:
87.9% (12,857)Foreign-born:
12.1% (450)
White (Caucasian) - Speak another language Native:
10.5% (1,536)Foreign-born:
88.7% (3,313)
Black or African American - Speak only English Native:
93.7% (3,159)Foreign-born:
51.4% (172)
Black or African American - Speak another language Native:
5.6% (188)Foreign-born:
48.6% (163)
American Indian / Alaska Native - Speak another language Native:
100.0% (196)Foreign-born:
92.6% (134)
Asian - Speak only English Native:
66.7% (46)Foreign-born:
30.5% (153)
Asian - Speak another language Native:
27.3% (19)Foreign-born:
58.1% (290)
Other race - Speak only English Native:
41.3% (825)Foreign-born:
3.7% (69)
Other race - Speak another language Native:
53.7% (1,072)Foreign-born:
93.4% (1,722)
Two or more races - Speak only English Native:
77.3% (1,546)Foreign-born:
2.5% (49)
Two or more races - Speak another language Native:
21.3% (426)Foreign-born:
100.0% (2,009)
White alone - Speak only English Native:
91.7% (12,398)Foreign-born:
12.2% (417)
White alone - Speak another language Native:
8.0% (1,078)Foreign-born:
92.5% (3,151)
Hispanic or Latino - Speak only English Native:
47.7% (1,822)Foreign-born:
7.1% (172)
Hispanic or Latino - Speak another language Native:
49.9% (1,904)Foreign-born:
91.2% (2,198)
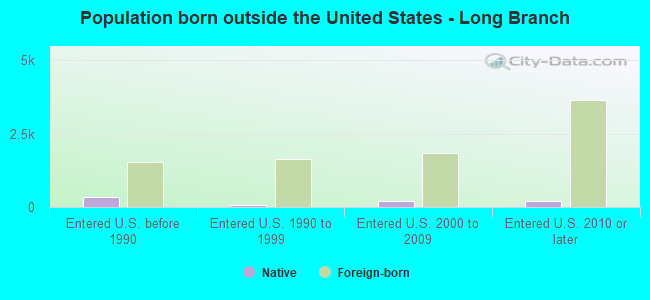
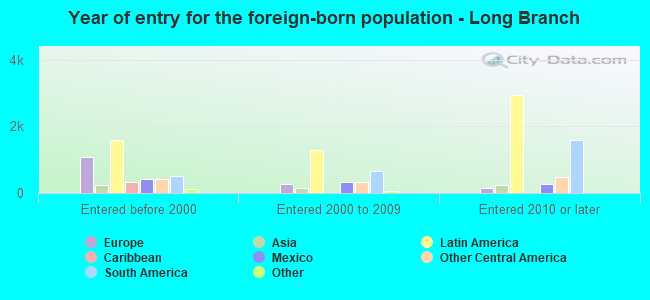
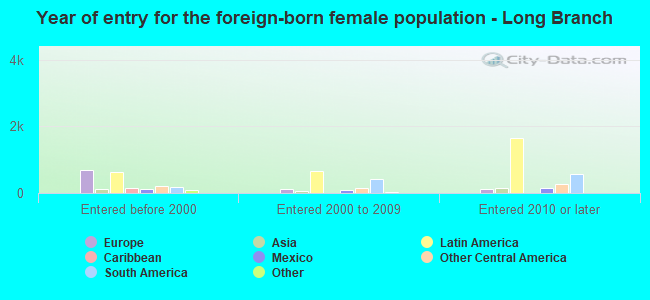
Foreign-born residents in Long Branch 8,294 residents are foreign born (18.9% Latin America , 4.1% Europe ).
This city:
25.9%New Jersey:
23.2%
Marital status for residents in Long Branch Marital status - White (Caucasian) population 15 years and over
Males 36.8% Never married49.2% Now married0.2% Separated2.9% Widowed11.0% DivorcedFemales 38.6% Never married39.8% Now married2.9% Separated6.5% Widowed12.1% DivorcedWomen who gave birth in the past 12 months Now married:
68.8% (215)Unmarried:
31.2% (97)
Women who did not give birth in the past 12 months Now married:
32.6% (1,425)Unmarried:
67.4% (2,946)
Marital status - Black or African American population 15 years and over
Males 53.1% Never married36.2% Now married0.2% Separated0.8% Widowed9.7% DivorcedFemales 57.8% Never married21.6% Now married4.5% Separated6.7% Widowed9.3% DivorcedWomen who gave birth in the past 12 months Now married:
0.0% (0)Unmarried:
100.0% (22)
Women who did not give birth in the past 12 months Now married:
12.9% (122)Unmarried:
87.1% (820)
Marital status - American Indian / Alaska Native population 15 years and over
Males 91.9% Never married0.0% Now married0.0% Separated0.0% Widowed8.1% DivorcedFemales 100.0% Never married0.0% Now married0.0% Separated0.0% Widowed0.0% DivorcedWomen who did not give birth in the past 12 months Now married:
0.0% (0)Unmarried:
100.0% (77)
Marital status - Asian population 15 years and over
Males 27.4% Never married68.2% Now married4.5% Separated0.0% Widowed0.0% DivorcedFemales 16.6% Never married82.5% Now married0.0% Separated0.9% Widowed0.0% DivorcedWomen who did not give birth in the past 12 months Now married:
61.6% (88)Unmarried:
38.4% (55)
Marital status - Other race population 15 years and over
Males 40.9% Never married50.9% Now married6.8% Separated0.0% Widowed1.3% DivorcedFemales 40.8% Never married44.0% Now married5.1% Separated0.0% Widowed10.1% DivorcedWomen who gave birth in the past 12 months Now married:
33.3% (20)Unmarried:
66.7% (41)
Women who did not give birth in the past 12 months Now married:
46.1% (509)Unmarried:
53.9% (595)
Marital status - Two or more races population 15 years and over
Males 64.1% Never married29.7% Now married0.0% Separated0.3% Widowed5.9% DivorcedFemales 37.9% Never married48.3% Now married1.2% Separated0.7% Widowed11.8% DivorcedWomen who gave birth in the past 12 months Now married:
0.0% (0)Unmarried:
100.0% (9)
Women who did not give birth in the past 12 months Now married:
46.9% (577)Unmarried:
53.1% (654)
Marital status - White alone, not Hispanic / Latino population 15 years and over
Males 34.9% Never married50.6% Now married0.0% Separated3.2% Widowed11.2% DivorcedFemales 37.0% Never married40.6% Now married2.9% Separated7.3% Widowed12.3% DivorcedWomen who gave birth in the past 12 months Now married:
72.2% (190)Unmarried:
27.8% (73)
Women who did not give birth in the past 12 months Now married:
33.8% (1,328)Unmarried:
66.2% (2,600)
Marital status - Hispanic or Latino population 15 years and over
Males 55.9% Never married35.4% Now married3.6% Separated0.2% Widowed4.9% DivorcedFemales 48.3% Never married36.3% Now married3.3% Separated0.3% Widowed11.8% DivorcedWomen who gave birth in the past 12 months Now married:
43.5% (49)Unmarried:
56.5% (63)
Women who did not give birth in the past 12 months Now married:
32.2% (529)Unmarried:
67.8% (1,113)
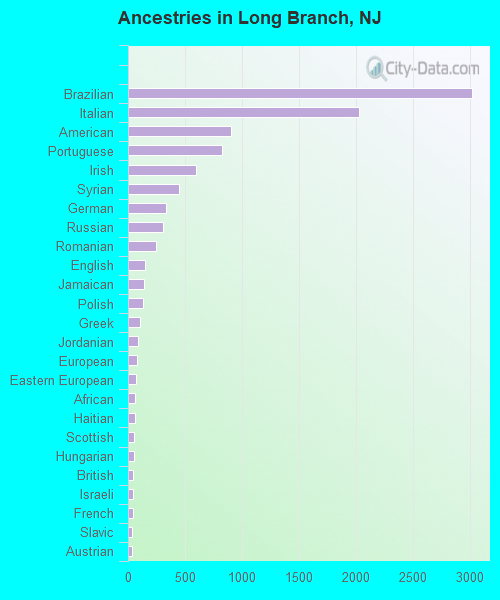
Ancestries in Long Branch
3,018 16.6% Brazilian2,027 11.2% Italian906 5.0% American829 4.6% Portuguese599 3.3% Irish452 2.5% Syrian337 1.9% German308 1.7% Russian246 1.4% Romanian147 0.8% English142 0.8% Jamaican128 0.7% Polish107 0.6% Greek92 0.5% Jordanian81 0.4% European70 0.4% Eastern European59 0.3% African58 0.3% Haitian57 0.3% Scottish54 0.3% Hungarian47 0.3% British47 0.3% Israeli47 0.3% French38 0.2% Slavic31 0.2% Austrian26 0.1% Turkish23 0.1% Armenian23 0.1% Czechoslovakian22 0.1% West Indian20 0.1% Egyptian16 0.09% Arab16 0.09% Welsh15 0.08% Norwegian15 0.08% Lebanese14 0.08% Ukrainian13 0.07% Belizean11 0.06% Canadian11 0.06% Ghanaian11 0.06% Bulgarian10 0.06% Slovak8 0.04% Scandinavian8 0.04% Czech7 0.04% Serbian
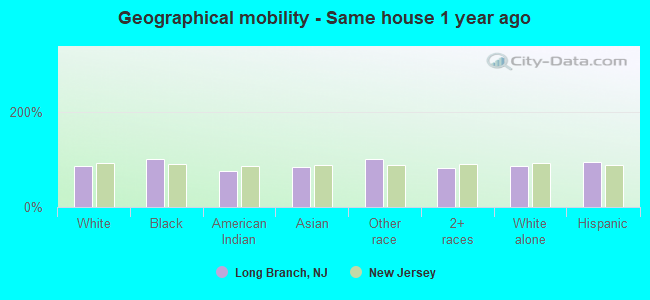
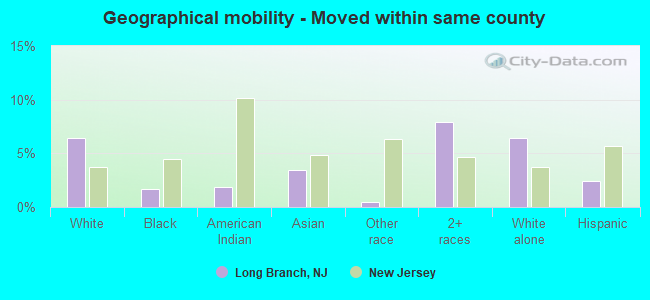
Geographical mobility in Long Branch Same house 1 year ago 16,707 86.2% White (Caucasian)3,814 100.0% Black or African American260 76.2% American Indian / Alaska Native603 83.4% Asian4,407 100.0% Other race3,723 80.9% Two or more races14,904 85.4% White alone, not Hispanic / Latino6,706 95.3% Hispanic or LatinoMoved within same county 1,244 6.4% White / Caucasian62 1.6% Black or African American6 1.9% American Indian / Alaska Native25 3.4% Asian19 0.4% Other race364 7.9% Two or more races1,126 6.5% White alone, not Hispanic / Latino171 2.4% Hispanic or LatinoMoved within same state 393 2.0% White / Caucasian2 0.0% Black or African American10 2.9% American Indian / Alaska Native12 0.3% Other race219 4.8% Two or more races387 2.2% White alone, not Hispanic / Latino36 0.5% Hispanic or LatinoMoved from different state 210 1.1% White / Caucasian43 1.1% Black or African American63 8.8% Asian159 3.5% Two or more races220 1.3% White alone, not Hispanic / Latino47 0.7% Hispanic or LatinoMoved from abroad 308 1.6% White60 17.6% American Indian / Alaska Native8 1.1% Asian2 0.0% Other race29 0.6% Two or more races850 4.9% White alone, not Hispanic / Latino87 1.2% Hispanic or Latino
Children Nativity (place of birth) in Long Branch
Children under 6 years - Living with two parents Both parents native 568 100.0% NativeBoth parents foreign-born 334 87.2% Native49 12.8% Foreign-bornOne native, one foreign-born parent 76 100.0% NativeChildren under 6 years - Living with one parent Native parent 305 100.0% NativeForeign-born parent 582 98.8% Native7 1.2% Foreign-bornChildren 6 to 17 years - Living with two parents Both parents native 621 100.0% NativeBoth parents foreign-born 634 69.8% Native275 30.2% Foreign-bornOne native, one foreign-born parent 415 96.2% Native16 3.8% Foreign-bornChildren 6 to 17 years - Living with one parent Native parent 1,325 100.0% NativeForeign-born parent 1,144 51.3% Native1,084 48.7% Foreign-born
Grandparents responsible for own grandchildren in Long Branch
Grandparents (30 to 59 years) White / Caucasian 136 70.2% Responsible for grandchildren58 29.8% Not responsible for grandchildrenBlack or African American 17 100.0% Not responsible for grandchildrenTwo or more races 25 100.0% Not responsible for grandchildrenWhite alone, not Hispanic / Latino 43 57.9% Responsible for grandchildren32 42.1% Not responsible for grandchildrenHispanic or Latino 44 100.0% Not responsible for grandchildrenGrandparents (60 years and over) White / Caucasian 9 3.0% Responsible for grandchildren293 97.0% Not responsible for grandchildrenBlack or African American 36 50.2% Responsible for grandchildren35 49.8% Not responsible for grandchildrenTwo or more races 27 100.0% Not responsible for grandchildrenWhite alone, not Hispanic / Latino 9 3.1% Responsible for grandchildren285 96.9% Not responsible for grandchildrenHispanic or Latino 45 100.0% Not responsible for grandchildren