Races in Lorain, Ohio (OH) Detailed Stats
Data:
Races - White alone (%)
Races - White alone (% change since 2000)
Races - Black alone (%)
Races - Black alone (% change since 2000)
Races - American Indian alone (%)
Races - American Indian alone (% change since 2000)
Races - Asian alone (%)
Races - Asian alone (% change since 2000)
Races - Hispanic (%)
Races - Hispanic (% change since 2000)
Races - Native Hawaiian and Other Pacific Islander alone (%)
Races - Native Hawaiian and Other Pacific Islander alone (% change since 2000)
Races - Two or more races(%)
Races - Two or more races(% change since 2000)
Races - Other race alone (%)
Races - Other race alone (% change since 2000)
Racial diversity
Place of birth - Born in state of residence (%)
Place of birth - Born in state of residence (%) - White
Place of birth - Born in state of residence (%) - Black or African American
Place of birth - Born in state of residence (%) - Asian
Place of birth - Born in state of residence (%) - Hispanic or Latino
Place of birth - Born in state of residence (%) - American Indian and Alaska Native
Place of birth - Born in state of residence (%) - Multirace
Place of birth - Born in state of residence (%) - Other Race
Place of birth - Born in other state (%)
Place of birth - Born in other state (%) - White
Place of birth - Born in other state (%) - Black or African American
Place of birth - Born in other state (%) - Asian
Place of birth - Born in other state (%) - Hispanic or Latino
Place of birth - Born in other state (%) - American Indian and Alaska Native
Place of birth - Born in other state (%) - Multirace
Place of birth - Born in other state (%) - Other Race
Place of birth - Native, outside of US (%)
Place of birth - Native, outside of US (%) - White
Place of birth - Native, outside of US (%) - Black or African American
Place of birth - Native, outside of US (%) - Asian
Place of birth - Native, outside of US (%) - Hispanic or Latino
Place of birth - Native, outside of US (%) - American Indian and Alaska Native
Place of birth - Native, outside of US (%) - Multirace
Place of birth - Native, outside of US (%) - Other Race
Place of birth - Foreign born (%)
Place of birth - Foreign born (%) - White
Place of birth - Foreign born (%) - Black or African American
Place of birth - Foreign born (%) - Asian
Place of birth - Foreign born (%) - Hispanic or Latino
Place of birth - Foreign born (%) - American Indian and Alaska Native
Place of birth - Foreign born (%) - Multirace
Place of birth - Foreign born (%) - Other Race
Residents speaking English at home (%)
Residents speaking English at home - Born in the United States (%)
Residents speaking English at home - Native, born elsewhere (%)
Residents speaking English at home - Foreign born (%)
Residents speaking Spanish at home (%)
Residents speaking Spanish at home - Born in the United States (%)
Residents speaking Spanish at home - Native, born elsewhere (%)
Residents speaking Spanish at home - Foreign born (%)
Residents speaking other language at home (%)
Residents speaking other language at home - Born in the United States (%)
Residents speaking other language at home - Native, born elsewhere (%)
Residents speaking other language at home - Foreign born (%)
Marital status - Never married (%)
Marital status - Now married (%)
Marital status - Separated (%)
Marital status - Widowed (%)
Marital status - Divorced (%)
Ancestries Reported - Arab (%)
Ancestries Reported - Czech (%)
Ancestries Reported - Danish (%)
Ancestries Reported - Dutch (%)
Ancestries Reported - English (%)
Ancestries Reported - French (%)
Ancestries Reported - French Canadian (%)
Ancestries Reported - German (%)
Ancestries Reported - Greek (%)
Ancestries Reported - Hungarian (%)
Ancestries Reported - Irish (%)
Ancestries Reported - Italian (%)
Ancestries Reported - Lithuanian (%)
Ancestries Reported - Norwegian (%)
Ancestries Reported - Polish (%)
Ancestries Reported - Portuguese (%)
Ancestries Reported - Russian (%)
Ancestries Reported - Scotch-Irish (%)
Ancestries Reported - Scottish (%)
Ancestries Reported - Slovak (%)
Ancestries Reported - Subsaharan African (%)
Ancestries Reported - Swedish (%)
Ancestries Reported - Swiss (%)
Ancestries Reported - Ukrainian (%)
Ancestries Reported - United States (%)
Ancestries Reported - Welsh (%)
Ancestries Reported - West Indian (%)
Ancestries Reported - Other (%)
Geographical mobility - Same house 1 year ago (%)
Geographical mobility - Same house 1 year ago (%) - White
Geographical mobility - Same house 1 year ago (%) - Black or African American
Geographical mobility - Same house 1 year ago (%) - Asian
Geographical mobility - Same house 1 year ago (%) - Hispanic or Latino
Geographical mobility - Same house 1 year ago (%) - American Indian and Alaska Native
Geographical mobility - Same house 1 year ago (%) - Multirace
Geographical mobility - Same house 1 year ago (%) - Other Race
Geographical mobility - Moved within same county (%)
Geographical mobility - Moved within same county (%) - White
Geographical mobility - Moved within same county (%) - Black or African American
Geographical mobility - Moved within same county (%) - Asian
Geographical mobility - Moved within same county (%) - Hispanic or Latino
Geographical mobility - Moved within same county (%) - American Indian and Alaska Native
Geographical mobility - Moved within same county (%) - Multirace
Geographical mobility - Moved within same county (%) - Other Race
Geographical mobility - Moved from different county within same state (%)
Geographical mobility - Moved from different county within same state (%) - White
Geographical mobility - Moved from different county within same state (%) - Black or African American
Geographical mobility - Moved from different county within same state (%) - Asian
Geographical mobility - Moved from different county within same state (%) - Hispanic or Latino
Geographical mobility - Moved from different county within same state (%) - American Indian and Alaska Native
Geographical mobility - Moved from different county within same state (%) - Multirace
Geographical mobility - Moved from different county within same state (%) - Other Race
Geographical mobility - Moved from different state (%)
Geographical mobility - Moved from different state (%) - White
Geographical mobility - Moved from different state (%) - Black or African American
Geographical mobility - Moved from different state (%) - Asian
Geographical mobility - Moved from different state (%) - Hispanic or Latino
Geographical mobility - Moved from different state (%) - American Indian and Alaska Native
Geographical mobility - Moved from different state (%) - Multirace
Geographical mobility - Moved from different state (%) - Other Race
Geographical mobility - Moved from abroad (%)
Geographical mobility - Moved from abroad (%) - White
Geographical mobility - Moved from abroad (%) - Black or African American
Geographical mobility - Moved from abroad (%) - Asian
Geographical mobility - Moved from abroad (%) - Hispanic or Latino
Geographical mobility - Moved from abroad (%) - American Indian and Alaska Native
Geographical mobility - Moved from abroad (%) - Multirace
Geographical mobility - Moved from abroad (%) - Other Race
Place of birth for the foreign-born population - Ireland (%)
Place of birth for the foreign-born population - Denmark (%)
Place of birth for the foreign-born population - Norway (%)
Place of birth for the foreign-born population - Sweden (%)
Place of birth for the foreign-born population - United Kingdom (%)
Place of birth for the foreign-born population - England (%)
Place of birth for the foreign-born population - Scotland (%)
Place of birth for the foreign-born population - Other Northern Europe (%)
Place of birth for the foreign-born population - Austria (%)
Place of birth for the foreign-born population - Belgium (%)
Place of birth for the foreign-born population - France (%)
Place of birth for the foreign-born population - Germany (%)
Place of birth for the foreign-born population - Netherlands (%)
Place of birth for the foreign-born population - Switzerland (%)
Place of birth for the foreign-born population - Other Western Europe (%)
Place of birth for the foreign-born population - Greece (%)
Place of birth for the foreign-born population - Italy (%)
Place of birth for the foreign-born population - Portugal (%)
Place of birth for the foreign-born population - Spain (%)
Place of birth for the foreign-born population - Other Southern Europe (%)
Place of birth for the foreign-born population - Albania (%)
Place of birth for the foreign-born population - Belarus (%)
Place of birth for the foreign-born population - Bosnia and Herzegovina (%)
Place of birth for the foreign-born population - Bulgaria (%)
Place of birth for the foreign-born population - Croatia (%)
Place of birth for the foreign-born population - Czechoslovakia (%)
Place of birth for the foreign-born population - Hungary (%)
Place of birth for the foreign-born population - Latvia (%)
Place of birth for the foreign-born population - Lithuania (%)
Place of birth for the foreign-born population - North Macedonia (Macedonia) (%)
Place of birth for the foreign-born population - Moldova (%)
Place of birth for the foreign-born population - Poland (%)
Place of birth for the foreign-born population - Romania (%)
Place of birth for the foreign-born population - Russia (%)
Place of birth for the foreign-born population - Serbia (%)
Place of birth for the foreign-born population - Ukraine (%)
Place of birth for the foreign-born population - Other Eastern Europe (%)
Place of birth for the foreign-born population - China (%)
Place of birth for the foreign-born population - Hong Kong (%)
Place of birth for the foreign-born population - Taiwan (%)
Place of birth for the foreign-born population - Japan (%)
Place of birth for the foreign-born population - Korea (%)
Place of birth for the foreign-born population - Other Eastern Asia (%)
Place of birth for the foreign-born population - Afghanistan (%)
Place of birth for the foreign-born population - Bangladesh (%)
Place of birth for the foreign-born population - India (%)
Place of birth for the foreign-born population - Iran (%)
Place of birth for the foreign-born population - Kazakhstan (%)
Place of birth for the foreign-born population - Nepal (%)
Place of birth for the foreign-born population - Pakistan (%)
Place of birth for the foreign-born population - Sri Lanka (%)
Place of birth for the foreign-born population - Uzbekistan (%)
Place of birth for the foreign-born population - Other South Central Asia (%)
Place of birth for the foreign-born population - Burma (%)
Place of birth for the foreign-born population - Cambodia (%)
Place of birth for the foreign-born population - Indonesia (%)
Place of birth for the foreign-born population - Laos (%)
Place of birth for the foreign-born population - Malaysia (%)
Place of birth for the foreign-born population - Philippines (%)
Place of birth for the foreign-born population - Singapore (%)
Place of birth for the foreign-born population - Thailand (%)
Place of birth for the foreign-born population - Vietnam (%)
Place of birth for the foreign-born population - Other South Eastern Asia (%)
Place of birth for the foreign-born population - Armenia (%)
Place of birth for the foreign-born population - Iraq (%)
Place of birth for the foreign-born population - Israel (%)
Place of birth for the foreign-born population - Jordan (%)
Place of birth for the foreign-born population - Kuwait (%)
Place of birth for the foreign-born population - Lebanon (%)
Place of birth for the foreign-born population - Saudi Arabia (%)
Place of birth for the foreign-born population - Syria (%)
Place of birth for the foreign-born population - Turkey (%)
Place of birth for the foreign-born population - Yemen (%)
Place of birth for the foreign-born population - Other Western Asia (%)
Place of birth for the foreign-born population - Eritrea (%)
Place of birth for the foreign-born population - Ethiopia (%)
Place of birth for the foreign-born population - Kenya (%)
Place of birth for the foreign-born population - Somalia (%)
Place of birth for the foreign-born population - Uganda (%)
Place of birth for the foreign-born population - Zimbabwe (%)
Place of birth for the foreign-born population - Other Eastern Africa (%)
Place of birth for the foreign-born population - Cameroon (%)
Place of birth for the foreign-born population - Congo (%)
Place of birth for the foreign-born population - Democratic Republic of Congo (Zaire) (%)
Place of birth for the foreign-born population - Other Middle Africa (%)
Place of birth for the foreign-born population - Egypt (%)
Place of birth for the foreign-born population - Morocco (%)
Place of birth for the foreign-born population - Sudan (%)
Place of birth for the foreign-born population - Other Northern Africa (%)
Place of birth for the foreign-born population - South Africa (%)
Place of birth for the foreign-born population - Other Southern Africa (%)
Place of birth for the foreign-born population - Cabo Verde (%)
Place of birth for the foreign-born population - Ghana (%)
Place of birth for the foreign-born population - Liberia (%)
Place of birth for the foreign-born population - Nigeria (%)
Place of birth for the foreign-born population - Senegal (%)
Place of birth for the foreign-born population - Sierra Leone (%)
Place of birth for the foreign-born population - Other Western Africa (%)
Place of birth for the foreign-born population - Australia (%)
Place of birth for the foreign-born population - New Zealand (%)
Place of birth for the foreign-born population - Fiji (%)
Place of birth for the foreign-born population - Micronesia (%)
Place of birth for the foreign-born population - Bahamas (%)
Place of birth for the foreign-born population - Barbados (%)
Place of birth for the foreign-born population - Cuba (%)
Place of birth for the foreign-born population - Dominica (%)
Place of birth for the foreign-born population - Dominican Republic (%)
Place of birth for the foreign-born population - Grenada (%)
Place of birth for the foreign-born population - Haiti (%)
Place of birth for the foreign-born population - Jamaica (%)
Place of birth for the foreign-born population - St. Vincent and the Grenadines (%)
Place of birth for the foreign-born population - Trinidad and Tobago (%)
Place of birth for the foreign-born population - West Indies (%)
Place of birth for the foreign-born population - Other Caribbean (%)
Place of birth for the foreign-born population - Belize (%)
Place of birth for the foreign-born population - Costa Rica (%)
Place of birth for the foreign-born population - El Salvador (%)
Place of birth for the foreign-born population - Guatemala (%)
Place of birth for the foreign-born population - Honduras (%)
Place of birth for the foreign-born population - Mexico (%)
Place of birth for the foreign-born population - Nicaragua (%)
Place of birth for the foreign-born population - Panama (%)
Place of birth for the foreign-born population - Other Central America (%)
Place of birth for the foreign-born population - Argentina (%)
Place of birth for the foreign-born population - Bolivia (%)
Place of birth for the foreign-born population - Brazil (%)
Place of birth for the foreign-born population - Chile (%)
Place of birth for the foreign-born population - Colombia (%)
Place of birth for the foreign-born population - Ecuador (%)
Place of birth for the foreign-born population - Guyana (%)
Place of birth for the foreign-born population - Peru (%)
Place of birth for the foreign-born population - Uruguay (%)
Place of birth for the foreign-born population - Venezuela (%)
Place of birth for the foreign-born population - Other South America (%)
Place of birth for the foreign-born population - Canada (%)
Place of birth for the foreign-born population - Other Northern America (%)
Place of birth for the foreign-born population - Other (%)
Latest news about races in Lorain, OH collected exclusively by city-data.com from local newspapers, TV, and radio stations
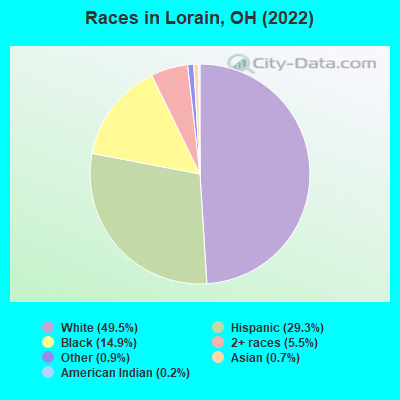
According to 2022 data, the most numerous races in Lorain, OH are White alone (32,596 residents), Black alone (9,783 residents), and Two or more races (3,643 residents). 84.3% of Lorain residents speak English at home. 2.7% of Lorain, OH residents are foreign-born (1.2% born in Latin America, 0.8% born in Europe, 0.5% born in Asia), which is 47.1% less than the foreign-born rate of 4.0% across the entire state of Ohio.
Race distribution in Lorain
2000 2022
9,538,111 84.0% White alone 1,290,662 11.4% Black alone 217,123 1.9% Hispanic 137,770 1.2% Two or more races 131,670 1.2% Asian alone 21,985 0.2% American Indian alone 13,483 0.1% Other race alone 2,336 0.02% Native Hawaiian and Other
8,948,793 76.1% White alone 1,401,403 11.9% Black alone 529,291 4.5% Two or more races 517,232 4.4% Hispanic 293,387 2.5% Asian alone 52,805 0.4% Other race alone 9,785 0.08% American Indian alone 3,362 0.03% Native Hawaiian and Other
Income and house value in Lorain Median household income in 2022 $54,191 White non-Hispanic householders$29,656 Black householders$31,331 Some other race householders$53,147 Two or more races householders$41,988 Hispanic or Latino race householdersMedian 2022 house value $123,425 White Non-Hispanic householders$110,241 Black or African American householders$227,917 American Indian or Alaska Native householders $152,038 Asian householders$112,626 Some other race householders$110,802 Two or more races householders$113,607 Hispanic or Latino householders
Median age by race in Lorain
52.8 Median age for White residents48.3 56.5 32.5 Median age for Black or African American residents29.8 34.6 40.6 Median age for American Indian / Alaska Native residents28.0 46.6 -666,666,666.0 Median age for Asian residents-666,666,666.0 -666,666,666.0 -666,666,666.0 Median age for Native Hawaiian / Pacific Islander residents-666,666,666.0 -666,666,666.0 43.9 Median age for Other race residents43.8 44.1 30.4 Median age for Two or more races residents32.1 28.4 54.5 Median age for White alone residents51.1 58.1 32.3 Median age for Hispanic or Latino residents31.3 33.5
Owner/renter occupied households by race in Lorain
House owners and renters - White residents 12,599 69.8% Owner occupied5,459 30.2% Renter occupiedHouse owners and renters - Black or African American residents 1,369 32.2% Owner occupied2,887 67.8% Renter occupiedHouse owners and renters - American Indian / Alaska Native residents 63 57.7% Owner occupied46 42.3% Renter occupiedHouse owners and renters - Asian residents 50 38.6% Owner occupied80 61.4% Renter occupiedHouse owners and renters - Native Hawaiian / Pacific Islander residents 14 100.0% Renter occupiedHouse owners and renters - Other race residents 355 36.2% Owner occupied626 63.8% Renter occupiedHouse owners and renters - Two or more races residents 2,951 64.7% Owner occupied1,607 35.3% Renter occupiedHouse owners and renters - White alone residents 12,308 70.7% Owner occupied5,098 29.3% Renter occupiedHouse owners and renters - Hispanic or Latino residents 3,158 55.6% Owner occupied2,524 44.4% Renter occupied
Language usage in Lorain
English speakers - Total 84.3% of residents of Lorain speak English at home.
15.7% of residents speak Spanish at home 5,614 58.9% Speak English very well3,916 41.1% Speak English less than very well1.2% of residents speak other language at home 547 72.4% Speak English very well209 27.6% Speak English less than very well
English speakers - Born in the United States 84.8% of residents of Lorain speak English at home.
18.1% of residents speak Spanish at home 1,675 91.1% Speak English very well164 8.9% Speak English less than very well0.7% of residents speak other language at home 60 80.0% Speak English very well15 20.0% Speak English less than very well
English speakers - Native, born elsewhere 10.9% of residents of Lorain speak English at home.
93.1% of residents speak Spanish at home 1,389 31.1% Speak English very well3,071 68.9% Speak English less than very well0.7% of residents speak other language at home 9 26.5% Speak English very well25 73.5% Speak English less than very well
English speakers - Foreign-born 17.0% of residents of Lorain speak English at home.
59.7% of residents speak Spanish at home 829 86.0% Speak English very well135 14.0% Speak English less than very well25.9% of residents speak other language at home 294 70.3% Speak English very well124 29.7% Speak English less than very well
White (Caucasian) - Speak only English Native:
97.0% (34,223)Foreign-born:
36.0% (207)
White (Caucasian) - Speak another language Native:
3.0% (1,067)Foreign-born:
64.0% (368)
Black or African American - Speak only English Native:
98.6% (9,379)Foreign-born:
72.0% (21)
Black or African American - Speak another language Native:
1.3% (119)Foreign-born:
32.4% (9)
American Indian / Alaska Native - Speak only English Native:
40.8% (167)Foreign-born:
100.0% (13)
Asian - Speak only English Native:
57.0% (148)Foreign-born:
31.7% (82)
Asian - Speak another language Native:
40.6% (106)Foreign-born:
54.7% (141)
Other race - Speak another language Native:
54.5% (1,613)Foreign-born:
100.0% (95)
Two or more races - Speak only English Native:
56.2% (6,478)Foreign-born:
6.2% (113)
Two or more races - Speak another language Native:
43.8% (5,055)Foreign-born:
93.8% (1,701)
White alone - Speak only English Native:
98.1% (29,878)Foreign-born:
65.5% (280)
White alone - Speak another language Native:
1.5% (443)Foreign-born:
83.2% (356)
Hispanic or Latino - Speak only English Native:
50.7% (7,716)Foreign-born:
5.8% (113)
Hispanic or Latino - Speak another language Native:
49.3% (7,504)Foreign-born:
94.2% (1,852)
Foreign-born residents in Lorain 1,789 residents are foreign born (1.2% Latin America , 0.8% Europe , 0.5% Asia ).
Marital status for residents in Lorain Marital status - White (Caucasian) population 15 years and over
Males 39.0% Never married42.9% Now married1.1% Separated5.2% Widowed11.8% DivorcedFemales 22.0% Never married41.0% Now married3.4% Separated12.2% Widowed21.4% DivorcedWomen who gave birth in the past 12 months Now married:
74.5% (164)Unmarried:
25.5% (56)
Women who did not give birth in the past 12 months Now married:
35.9% (2,162)Unmarried:
64.1% (3,855)
Marital status - Black or African American population 15 years and over
Males 53.6% Never married30.5% Now married0.0% Separated11.7% Widowed4.2% DivorcedFemales 58.5% Never married30.7% Now married3.5% Separated1.6% Widowed5.7% DivorcedWomen who gave birth in the past 12 months Now married:
27.1% (84)Unmarried:
72.9% (227)
Women who did not give birth in the past 12 months Now married:
13.1% (242)Unmarried:
86.9% (1,606)
Marital status - American Indian / Alaska Native population 15 years and over
Males 68.2% Never married11.8% Now married5.5% Separated0.0% Widowed14.5% DivorcedFemales 38.4% Never married34.6% Now married0.0% Separated4.3% Widowed22.7% DivorcedWomen who did not give birth in the past 12 months Now married:
41.5% (48)Unmarried:
58.5% (67)
Marital status - Asian population 15 years and over
Males 18.1% Never married62.9% Now married0.0% Separated0.0% Widowed19.0% DivorcedFemales 59.1% Never married35.4% Now married0.0% Separated0.7% Widowed4.7% DivorcedWomen who did not give birth in the past 12 months Now married:
26.7% (59)Unmarried:
73.3% (162)
Marital status - Other race population 15 years and over
Males 36.3% Never married37.3% Now married0.0% Separated6.1% Widowed20.4% DivorcedFemales 35.4% Never married41.4% Now married6.3% Separated4.1% Widowed12.7% DivorcedWomen who gave birth in the past 12 months Now married:
0.0% (0)Unmarried:
100.0% (25)
Women who did not give birth in the past 12 months Now married:
46.1% (450)Unmarried:
53.9% (527)
Marital status - Two or more races population 15 years and over
Males 53.3% Never married24.0% Now married6.2% Separated7.6% Widowed8.8% DivorcedFemales 55.8% Never married25.5% Now married2.9% Separated0.5% Widowed15.3% DivorcedWomen who gave birth in the past 12 months Now married:
17.7% (40)Unmarried:
82.3% (185)
Women who did not give birth in the past 12 months Now married:
31.8% (1,023)Unmarried:
68.2% (2,190)
Marital status - White alone, not Hispanic / Latino population 15 years and over
Males 38.8% Never married44.8% Now married0.8% Separated5.5% Widowed10.1% DivorcedFemales 19.6% Never married42.9% Now married3.7% Separated11.7% Widowed22.1% DivorcedWomen who gave birth in the past 12 months Now married:
74.5% (164)Unmarried:
25.5% (56)
Women who did not give birth in the past 12 months Now married:
40.8% (2,162)Unmarried:
59.2% (3,131)
Marital status - Hispanic or Latino population 15 years and over
Males 54.2% Never married16.6% Now married5.7% Separated5.8% Widowed17.6% DivorcedFemales 49.0% Never married29.7% Now married3.3% Separated3.8% Widowed14.2% DivorcedWomen who gave birth in the past 12 months Now married:
22.0% (81)Unmarried:
78.0% (289)
Women who did not give birth in the past 12 months Now married:
34.8% (1,556)Unmarried:
65.2% (2,910)
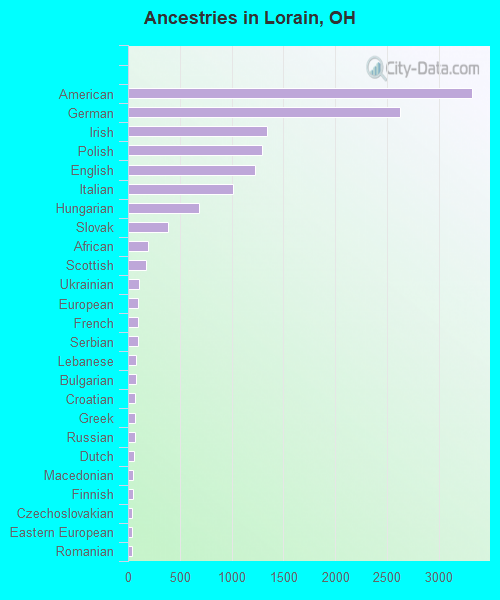
Ancestries in Lorain
3,319 9.1% American2,627 7.2% German1,345 3.7% Irish1,297 3.5% Polish1,229 3.4% English1,018 2.8% Italian682 1.9% Hungarian385 1.1% Slovak197 0.5% African170 0.5% Scottish103 0.3% Ukrainian99 0.3% European99 0.3% French92 0.3% Serbian80 0.2% Lebanese79 0.2% Bulgarian67 0.2% Croatian67 0.2% Greek64 0.2% Russian54 0.1% Dutch48 0.1% Macedonian46 0.1% Finnish42 0.1% Czechoslovakian41 0.1% Eastern European37 0.1% Romanian35 0.10% Czech30 0.08% Scotch-Irish29 0.08% Slovene20 0.05% Welsh19 0.05% Nigerian18 0.05% British16 0.04% Yugoslavian15 0.04% Syrian14 0.04% Pennsylvania German11 0.03% Swedish10 0.03% Northern European8 0.02% Austrian5 0.01% Norwegian
Geographical mobility in Lorain Same house 1 year ago 34,876 94.1% White (Caucasian)7,633 74.1% Black or African American477 100.0% American Indian / Alaska Native438 100.0% Asian12 100.0% Native Hawaiian / Pacific Islander3,354 90.3% Other race12,077 86.8% Two or more races31,275 93.5% White alone, not Hispanic / Latino16,787 88.0% Hispanic or LatinoMoved within same county 1,048 2.8% White / Caucasian1,884 18.3% Black or African American9 1.8% American Indian / Alaska Native60 1.6% Other race1,688 12.1% Two or more races1,048 3.1% White alone, not Hispanic / Latino1,475 7.7% Hispanic or LatinoMoved within same state 738 2.0% White / Caucasian780 7.6% Black or African American96 2.6% Other race261 1.9% Two or more races738 2.2% White alone, not Hispanic / Latino404 2.1% Hispanic or LatinoMoved from different state 406 1.1% White / Caucasian178 4.8% Other race9 0.1% Two or more races406 1.2% White alone, not Hispanic / Latino162 0.8% Hispanic or LatinoMoved from abroad 33 0.2% Two or more races88 0.5% Hispanic or Latino
Children Nativity (place of birth) in Lorain
Children under 6 years - Living with two parents Both parents native 1,950 100.0% NativeBoth parents foreign-born 31 100.0% NativeOne native, one foreign-born parent 39 100.0% NativeChildren under 6 years - Living with one parent Native parent 3,333 100.0% NativeForeign-born parent 20 100.0% NativeChildren 6 to 17 years - Living with two parents Both parents native 3,470 100.0% NativeBoth parents foreign-born 81 100.0% NativeOne native, one foreign-born parent 145 86.5% Native23 13.5% Foreign-bornChildren 6 to 17 years - Living with one parent Native parent 5,069 100.0% NativeForeign-born parent 70 50.4% Native69 49.6% Foreign-born
Grandparents responsible for own grandchildren in Lorain
Grandparents (30 to 59 years) White / Caucasian 234 79.8% Responsible for grandchildren59 20.2% Not responsible for grandchildrenBlack or African American 97 64.2% Responsible for grandchildren54 35.8% Not responsible for grandchildrenOther race 13 26.2% Responsible for grandchildren36 73.8% Not responsible for grandchildrenTwo or more races 150 100.0% Responsible for grandchildrenWhite alone, not Hispanic / Latino 203 82.1% Responsible for grandchildren44 17.9% Not responsible for grandchildrenHispanic or Latino 133 76.7% Responsible for grandchildren41 23.3% Not responsible for grandchildrenGrandparents (60 years and over) White / Caucasian 61 42.1% Responsible for grandchildren84 57.9% Not responsible for grandchildrenBlack or African American 100 80.0% Responsible for grandchildren25 20.0% Not responsible for grandchildrenOther race 35 100.0% Not responsible for grandchildrenTwo or more races 58 87.6% Responsible for grandchildren8 12.4% Not responsible for grandchildrenWhite alone, not Hispanic / Latino 59 40.9% Responsible for grandchildren85 59.1% Not responsible for grandchildrenHispanic or Latino 31 47.9% Responsible for grandchildren33 52.1% Not responsible for grandchildren