Races in Louisville, New York (NY) Detailed Stats
Ancestries, Foreign-born residents, place of birth

Recent posts about races in Louisville, New York on our local forum with over 2,400,000 registered users:
 | Events in Syracuse? (1152 replies) |
| If I move out of NYC, will I end up being bored because I've been spoiled with all NYC had to offer? (105 replies) |
| NYC protest get violent (602 replies) |
| Shooting at a backyard party in Rochester leaves 2 dead and 14 wounded (33 replies) |
| There is nothing wrong with being from Ohio (82 replies) |
| How is everyone making it on LI!? (118 replies) |
Latest news about races in Louisville, NY collected exclusively by city-data.com from local newspapers, TV, and radio stations
5.8% of Louisville, NY residents are foreign-born (3.6% born in North America, 1.7% born in Europe), which is 279.9% less than the foreign-born rate of 22.0% across the entire state of New York.
Race distribution in Louisville

- 3,06495.9%White alone
- 491.5%Hispanic
- 401.3%Asian alone
- 260.8%American Indian alone
- 140.4%Two or more races
- 20.06%Black alone

2000
2022
-
- 11,760,98162.0%White alone
- 2,867,58315.1%Hispanic
- 2,812,62314.8%Black alone
- 1,035,9265.5%Asian alone
- 366,1161.9%Two or more races
- 75,4990.4%Other race alone
- 52,4990.3%American Indian alone
- 5,2300.03%Native Hawaiian and Other
Pacific Islander alone

-
- 10,408,93352.9%White alone
- 3,867,29919.7%Hispanic
- 2,633,84013.4%Black alone
- 1,776,2869.0%Asian alone
- 732,6703.7%Two or more races
- 216,1101.1%Other race alone
- 35,0820.2%American Indian alone
- 6,9310.04%Native Hawaiian and Other
Pacific Islander alone

Income and house value in Louisville
- Median household income in 2022
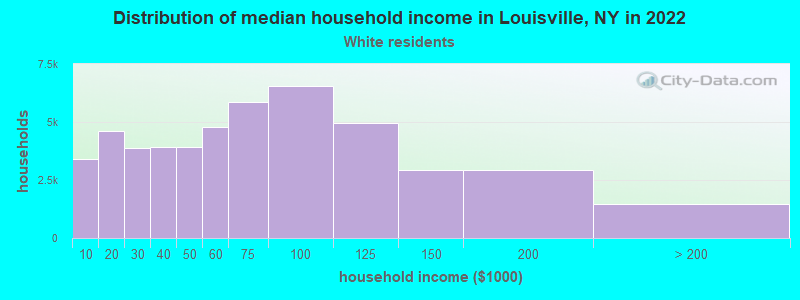
- $73,264White non-Hispanic householders
- $81,010Some other race householders
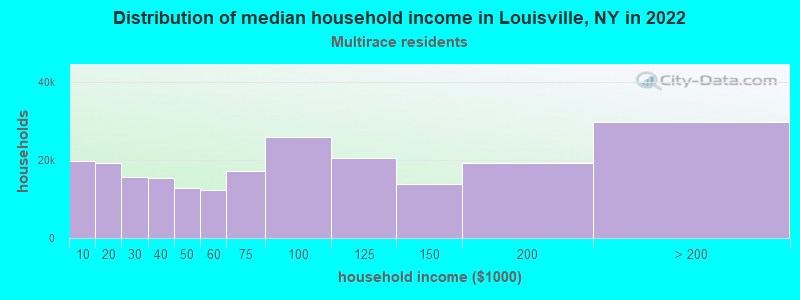
- $52,660Two or more races householders
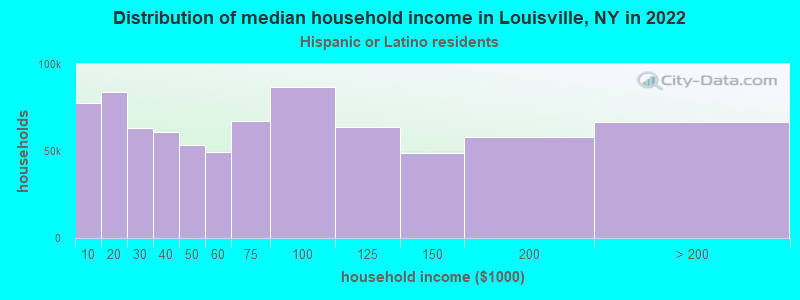
- $77,089Hispanic or Latino race householders
- Median 2022 house value
- $176,497White Non-Hispanic householders
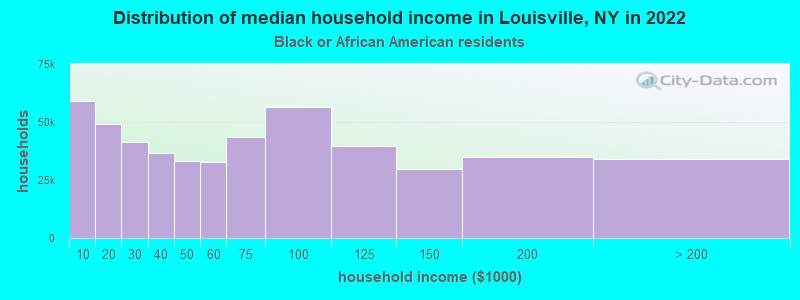
- $92,893Black or African American householders
- $175,465Some other race householders
- $118,697Two or more races householders
- $181,038Hispanic or Latino householders
Household income for White non-Hispanic householders
Household income for Black householders
Household income for Two or more races householders
Household income for Hispanic or Latino race householders
Foreign-born residents in Louisville
185 residents are foreign born (3.6% North America, 1.7% Europe).
| This city: | 5.8% |
| New York: | 20.4% |
Ancestries in Louisville

- 77822.3%French
- 50314.4%Irish
- 3299.4%United States
- 3209.2%French Canadian
- 2647.6%Other
- 2416.9%English
- 2246.4%Italian
- 1905.4%Scottish
- 1885.4%German
- 1133.2%Polish
- 681.9%Hungarian
- 581.7%Dutch
- 521.5%Scotch-Irish
- 330.9%Arab
- 280.8%Czech
- 260.7%Welsh
- 220.6%Swedish
- 170.5%Ukrainian
- 160.5%Russian
- 100.3%Greek
- 80.2%Norwegian

Zip codes: 13667.