Races in Loveland, Ohio (OH) Detailed Stats
Data:
Races - White alone (%)
Races - White alone (% change since 2000)
Races - Black alone (%)
Races - Black alone (% change since 2000)
Races - American Indian alone (%)
Races - American Indian alone (% change since 2000)
Races - Asian alone (%)
Races - Asian alone (% change since 2000)
Races - Hispanic (%)
Races - Hispanic (% change since 2000)
Races - Native Hawaiian and Other Pacific Islander alone (%)
Races - Native Hawaiian and Other Pacific Islander alone (% change since 2000)
Races - Two or more races(%)
Races - Two or more races(% change since 2000)
Races - Other race alone (%)
Races - Other race alone (% change since 2000)
Racial diversity
Place of birth - Born in state of residence (%)
Place of birth - Born in state of residence (%) - White
Place of birth - Born in state of residence (%) - Black or African American
Place of birth - Born in state of residence (%) - Asian
Place of birth - Born in state of residence (%) - Hispanic or Latino
Place of birth - Born in state of residence (%) - American Indian and Alaska Native
Place of birth - Born in state of residence (%) - Multirace
Place of birth - Born in state of residence (%) - Other Race
Place of birth - Born in other state (%)
Place of birth - Born in other state (%) - White
Place of birth - Born in other state (%) - Black or African American
Place of birth - Born in other state (%) - Asian
Place of birth - Born in other state (%) - Hispanic or Latino
Place of birth - Born in other state (%) - American Indian and Alaska Native
Place of birth - Born in other state (%) - Multirace
Place of birth - Born in other state (%) - Other Race
Place of birth - Native, outside of US (%)
Place of birth - Native, outside of US (%) - White
Place of birth - Native, outside of US (%) - Black or African American
Place of birth - Native, outside of US (%) - Asian
Place of birth - Native, outside of US (%) - Hispanic or Latino
Place of birth - Native, outside of US (%) - American Indian and Alaska Native
Place of birth - Native, outside of US (%) - Multirace
Place of birth - Native, outside of US (%) - Other Race
Place of birth - Foreign born (%)
Place of birth - Foreign born (%) - White
Place of birth - Foreign born (%) - Black or African American
Place of birth - Foreign born (%) - Asian
Place of birth - Foreign born (%) - Hispanic or Latino
Place of birth - Foreign born (%) - American Indian and Alaska Native
Place of birth - Foreign born (%) - Multirace
Place of birth - Foreign born (%) - Other Race
Residents speaking English at home (%)
Residents speaking English at home - Born in the United States (%)
Residents speaking English at home - Native, born elsewhere (%)
Residents speaking English at home - Foreign born (%)
Residents speaking Spanish at home (%)
Residents speaking Spanish at home - Born in the United States (%)
Residents speaking Spanish at home - Native, born elsewhere (%)
Residents speaking Spanish at home - Foreign born (%)
Residents speaking other language at home (%)
Residents speaking other language at home - Born in the United States (%)
Residents speaking other language at home - Native, born elsewhere (%)
Residents speaking other language at home - Foreign born (%)
Marital status - Never married (%)
Marital status - Now married (%)
Marital status - Separated (%)
Marital status - Widowed (%)
Marital status - Divorced (%)
Ancestries Reported - Arab (%)
Ancestries Reported - Czech (%)
Ancestries Reported - Danish (%)
Ancestries Reported - Dutch (%)
Ancestries Reported - English (%)
Ancestries Reported - French (%)
Ancestries Reported - French Canadian (%)
Ancestries Reported - German (%)
Ancestries Reported - Greek (%)
Ancestries Reported - Hungarian (%)
Ancestries Reported - Irish (%)
Ancestries Reported - Italian (%)
Ancestries Reported - Lithuanian (%)
Ancestries Reported - Norwegian (%)
Ancestries Reported - Polish (%)
Ancestries Reported - Portuguese (%)
Ancestries Reported - Russian (%)
Ancestries Reported - Scotch-Irish (%)
Ancestries Reported - Scottish (%)
Ancestries Reported - Slovak (%)
Ancestries Reported - Subsaharan African (%)
Ancestries Reported - Swedish (%)
Ancestries Reported - Swiss (%)
Ancestries Reported - Ukrainian (%)
Ancestries Reported - United States (%)
Ancestries Reported - Welsh (%)
Ancestries Reported - West Indian (%)
Ancestries Reported - Other (%)
Geographical mobility - Same house 1 year ago (%)
Geographical mobility - Same house 1 year ago (%) - White
Geographical mobility - Same house 1 year ago (%) - Black or African American
Geographical mobility - Same house 1 year ago (%) - Asian
Geographical mobility - Same house 1 year ago (%) - Hispanic or Latino
Geographical mobility - Same house 1 year ago (%) - American Indian and Alaska Native
Geographical mobility - Same house 1 year ago (%) - Multirace
Geographical mobility - Same house 1 year ago (%) - Other Race
Geographical mobility - Moved within same county (%)
Geographical mobility - Moved within same county (%) - White
Geographical mobility - Moved within same county (%) - Black or African American
Geographical mobility - Moved within same county (%) - Asian
Geographical mobility - Moved within same county (%) - Hispanic or Latino
Geographical mobility - Moved within same county (%) - American Indian and Alaska Native
Geographical mobility - Moved within same county (%) - Multirace
Geographical mobility - Moved within same county (%) - Other Race
Geographical mobility - Moved from different county within same state (%)
Geographical mobility - Moved from different county within same state (%) - White
Geographical mobility - Moved from different county within same state (%) - Black or African American
Geographical mobility - Moved from different county within same state (%) - Asian
Geographical mobility - Moved from different county within same state (%) - Hispanic or Latino
Geographical mobility - Moved from different county within same state (%) - American Indian and Alaska Native
Geographical mobility - Moved from different county within same state (%) - Multirace
Geographical mobility - Moved from different county within same state (%) - Other Race
Geographical mobility - Moved from different state (%)
Geographical mobility - Moved from different state (%) - White
Geographical mobility - Moved from different state (%) - Black or African American
Geographical mobility - Moved from different state (%) - Asian
Geographical mobility - Moved from different state (%) - Hispanic or Latino
Geographical mobility - Moved from different state (%) - American Indian and Alaska Native
Geographical mobility - Moved from different state (%) - Multirace
Geographical mobility - Moved from different state (%) - Other Race
Geographical mobility - Moved from abroad (%)
Geographical mobility - Moved from abroad (%) - White
Geographical mobility - Moved from abroad (%) - Black or African American
Geographical mobility - Moved from abroad (%) - Asian
Geographical mobility - Moved from abroad (%) - Hispanic or Latino
Geographical mobility - Moved from abroad (%) - American Indian and Alaska Native
Geographical mobility - Moved from abroad (%) - Multirace
Geographical mobility - Moved from abroad (%) - Other Race
Place of birth for the foreign-born population - Ireland (%)
Place of birth for the foreign-born population - Denmark (%)
Place of birth for the foreign-born population - Norway (%)
Place of birth for the foreign-born population - Sweden (%)
Place of birth for the foreign-born population - United Kingdom (%)
Place of birth for the foreign-born population - England (%)
Place of birth for the foreign-born population - Scotland (%)
Place of birth for the foreign-born population - Other Northern Europe (%)
Place of birth for the foreign-born population - Austria (%)
Place of birth for the foreign-born population - Belgium (%)
Place of birth for the foreign-born population - France (%)
Place of birth for the foreign-born population - Germany (%)
Place of birth for the foreign-born population - Netherlands (%)
Place of birth for the foreign-born population - Switzerland (%)
Place of birth for the foreign-born population - Other Western Europe (%)
Place of birth for the foreign-born population - Greece (%)
Place of birth for the foreign-born population - Italy (%)
Place of birth for the foreign-born population - Portugal (%)
Place of birth for the foreign-born population - Spain (%)
Place of birth for the foreign-born population - Other Southern Europe (%)
Place of birth for the foreign-born population - Albania (%)
Place of birth for the foreign-born population - Belarus (%)
Place of birth for the foreign-born population - Bosnia and Herzegovina (%)
Place of birth for the foreign-born population - Bulgaria (%)
Place of birth for the foreign-born population - Croatia (%)
Place of birth for the foreign-born population - Czechoslovakia (%)
Place of birth for the foreign-born population - Hungary (%)
Place of birth for the foreign-born population - Latvia (%)
Place of birth for the foreign-born population - Lithuania (%)
Place of birth for the foreign-born population - North Macedonia (Macedonia) (%)
Place of birth for the foreign-born population - Moldova (%)
Place of birth for the foreign-born population - Poland (%)
Place of birth for the foreign-born population - Romania (%)
Place of birth for the foreign-born population - Russia (%)
Place of birth for the foreign-born population - Serbia (%)
Place of birth for the foreign-born population - Ukraine (%)
Place of birth for the foreign-born population - Other Eastern Europe (%)
Place of birth for the foreign-born population - China (%)
Place of birth for the foreign-born population - Hong Kong (%)
Place of birth for the foreign-born population - Taiwan (%)
Place of birth for the foreign-born population - Japan (%)
Place of birth for the foreign-born population - Korea (%)
Place of birth for the foreign-born population - Other Eastern Asia (%)
Place of birth for the foreign-born population - Afghanistan (%)
Place of birth for the foreign-born population - Bangladesh (%)
Place of birth for the foreign-born population - India (%)
Place of birth for the foreign-born population - Iran (%)
Place of birth for the foreign-born population - Kazakhstan (%)
Place of birth for the foreign-born population - Nepal (%)
Place of birth for the foreign-born population - Pakistan (%)
Place of birth for the foreign-born population - Sri Lanka (%)
Place of birth for the foreign-born population - Uzbekistan (%)
Place of birth for the foreign-born population - Other South Central Asia (%)
Place of birth for the foreign-born population - Burma (%)
Place of birth for the foreign-born population - Cambodia (%)
Place of birth for the foreign-born population - Indonesia (%)
Place of birth for the foreign-born population - Laos (%)
Place of birth for the foreign-born population - Malaysia (%)
Place of birth for the foreign-born population - Philippines (%)
Place of birth for the foreign-born population - Singapore (%)
Place of birth for the foreign-born population - Thailand (%)
Place of birth for the foreign-born population - Vietnam (%)
Place of birth for the foreign-born population - Other South Eastern Asia (%)
Place of birth for the foreign-born population - Armenia (%)
Place of birth for the foreign-born population - Iraq (%)
Place of birth for the foreign-born population - Israel (%)
Place of birth for the foreign-born population - Jordan (%)
Place of birth for the foreign-born population - Kuwait (%)
Place of birth for the foreign-born population - Lebanon (%)
Place of birth for the foreign-born population - Saudi Arabia (%)
Place of birth for the foreign-born population - Syria (%)
Place of birth for the foreign-born population - Turkey (%)
Place of birth for the foreign-born population - Yemen (%)
Place of birth for the foreign-born population - Other Western Asia (%)
Place of birth for the foreign-born population - Eritrea (%)
Place of birth for the foreign-born population - Ethiopia (%)
Place of birth for the foreign-born population - Kenya (%)
Place of birth for the foreign-born population - Somalia (%)
Place of birth for the foreign-born population - Uganda (%)
Place of birth for the foreign-born population - Zimbabwe (%)
Place of birth for the foreign-born population - Other Eastern Africa (%)
Place of birth for the foreign-born population - Cameroon (%)
Place of birth for the foreign-born population - Congo (%)
Place of birth for the foreign-born population - Democratic Republic of Congo (Zaire) (%)
Place of birth for the foreign-born population - Other Middle Africa (%)
Place of birth for the foreign-born population - Egypt (%)
Place of birth for the foreign-born population - Morocco (%)
Place of birth for the foreign-born population - Sudan (%)
Place of birth for the foreign-born population - Other Northern Africa (%)
Place of birth for the foreign-born population - South Africa (%)
Place of birth for the foreign-born population - Other Southern Africa (%)
Place of birth for the foreign-born population - Cabo Verde (%)
Place of birth for the foreign-born population - Ghana (%)
Place of birth for the foreign-born population - Liberia (%)
Place of birth for the foreign-born population - Nigeria (%)
Place of birth for the foreign-born population - Senegal (%)
Place of birth for the foreign-born population - Sierra Leone (%)
Place of birth for the foreign-born population - Other Western Africa (%)
Place of birth for the foreign-born population - Australia (%)
Place of birth for the foreign-born population - New Zealand (%)
Place of birth for the foreign-born population - Fiji (%)
Place of birth for the foreign-born population - Micronesia (%)
Place of birth for the foreign-born population - Bahamas (%)
Place of birth for the foreign-born population - Barbados (%)
Place of birth for the foreign-born population - Cuba (%)
Place of birth for the foreign-born population - Dominica (%)
Place of birth for the foreign-born population - Dominican Republic (%)
Place of birth for the foreign-born population - Grenada (%)
Place of birth for the foreign-born population - Haiti (%)
Place of birth for the foreign-born population - Jamaica (%)
Place of birth for the foreign-born population - St. Vincent and the Grenadines (%)
Place of birth for the foreign-born population - Trinidad and Tobago (%)
Place of birth for the foreign-born population - West Indies (%)
Place of birth for the foreign-born population - Other Caribbean (%)
Place of birth for the foreign-born population - Belize (%)
Place of birth for the foreign-born population - Costa Rica (%)
Place of birth for the foreign-born population - El Salvador (%)
Place of birth for the foreign-born population - Guatemala (%)
Place of birth for the foreign-born population - Honduras (%)
Place of birth for the foreign-born population - Mexico (%)
Place of birth for the foreign-born population - Nicaragua (%)
Place of birth for the foreign-born population - Panama (%)
Place of birth for the foreign-born population - Other Central America (%)
Place of birth for the foreign-born population - Argentina (%)
Place of birth for the foreign-born population - Bolivia (%)
Place of birth for the foreign-born population - Brazil (%)
Place of birth for the foreign-born population - Chile (%)
Place of birth for the foreign-born population - Colombia (%)
Place of birth for the foreign-born population - Ecuador (%)
Place of birth for the foreign-born population - Guyana (%)
Place of birth for the foreign-born population - Peru (%)
Place of birth for the foreign-born population - Uruguay (%)
Place of birth for the foreign-born population - Venezuela (%)
Place of birth for the foreign-born population - Other South America (%)
Place of birth for the foreign-born population - Canada (%)
Place of birth for the foreign-born population - Other Northern America (%)
Place of birth for the foreign-born population - Other (%)
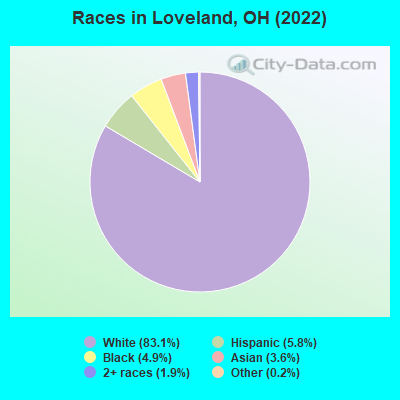
According to 2022 data, the most numerous races in Loveland, OH are White alone (10,971 residents), Black alone (641 residents), and Two or more races (247 residents). 89.2% of Loveland residents speak English at home. 7.1% of Loveland, OH residents are foreign-born (2.9% born in Asia, 2.6% born in Africa), which is 43.9% greater than the foreign-born rate of 4.0% across the entire state of Ohio.
Race distribution in Loveland
2000 2022
9,538,111 84.0% White alone 1,290,662 11.4% Black alone 217,123 1.9% Hispanic 137,770 1.2% Two or more races 131,670 1.2% Asian alone 21,985 0.2% American Indian alone 13,483 0.1% Other race alone 2,336 0.02% Native Hawaiian and Other
8,948,793 76.1% White alone 1,401,403 11.9% Black alone 529,291 4.5% Two or more races 517,232 4.4% Hispanic 293,387 2.5% Asian alone 52,805 0.4% Other race alone 9,785 0.08% American Indian alone 3,362 0.03% Native Hawaiian and Other
Income and house value in Loveland Median household income in 2022 $83,301 White non-Hispanic householders$61,416 Black householders$40,636 Asian householdersMedian 2022 house value $328,958 White Non-Hispanic householders$145,877 Black or African American householders $397,735 Asian householders$370,567 Hispanic or Latino householders
Median age by race in Loveland
41.1 Median age for White residents41.7 40.6 35.4 Median age for Black or African American residents40.8 31.5 19.7 Median age for American Indian / Alaska Native residents18.2 35.8 34.5 Median age for Asian residents6.1 39.8 -800,387,596.1 Median age for Native Hawaiian / Pacific Islander residents-750,242,953.6 -805,394,989.6 -577,294,685.4 Median age for Other race residents-583,333,332.8 -571,078,430.8 13.7 Median age for Two or more races residents15.3 9.8 41.9 Median age for White alone residents43.3 40.6 15.6 Median age for Hispanic or Latino residents19.9 15.5
Owner/renter occupied households by race in Loveland
House owners and renters - White residents 3,576 78.7% Owner occupied969 21.3% Renter occupiedHouse owners and renters - Black or African American residents 41 11.5% Owner occupied316 88.5% Renter occupiedHouse owners and renters - American Indian / Alaska Native residents 36 100.0% Renter occupiedHouse owners and renters - Asian residents 43 29.5% Owner occupied102 70.5% Renter occupiedHouse owners and renters - Two or more races residents 111 93.7% Owner occupied7 6.3% Renter occupiedHouse owners and renters - White alone residents 3,586 79.3% Owner occupied937 20.7% Renter occupiedHouse owners and renters - Hispanic or Latino residents 89 100.0% Renter occupied
Language usage in Loveland
English speakers - Total 89.2% of residents of Loveland speak English at home.
2.0% of residents speak Spanish at home 157 63.1% Speak English very well92 36.9% Speak English less than very well8.7% of residents speak other language at home 687 62.5% Speak English very well413 37.5% Speak English less than very well
English speakers - Born in the United States 94.8% of residents of Loveland speak English at home.
2.6% of residents speak Spanish at home 77 100.0% Speak English very well2.1% of residents speak other language at home 61 95.3% Speak English very well3 4.7% Speak English less than very well
English speakers - Native, born elsewhere 77.5% of residents of Loveland speak English at home.
17.2% of residents speak Spanish at home 26 100.0% Speak English very well11.9% of residents speak other language at home 18 100.0% Speak English very well
English speakers - Foreign-born 16.3% of residents of Loveland speak English at home.
10.6% of residents speak Spanish at home 38 38.4% Speak English very well61 61.6% Speak English less than very well71.5% of residents speak other language at home 494 74.1% Speak English very well173 25.9% Speak English less than very well
White (Caucasian) - Speak only English Native:
98.2% (10,168)Foreign-born:
32.7% (62)
White (Caucasian) - Speak another language Native:
1.8% (186)Foreign-born:
66.5% (125)
Black or African American - Speak another language Native:
14.7% (68)Foreign-born:
88.4% (240)
American Indian / Alaska Native - Speak another language Native:
74.9% (43)Foreign-born:
96.6% (124)
Asian - Speak only English Native:
9.1% (15)Foreign-born:
18.1% (54)
Asian - Speak another language Native:
75.5% (122)Foreign-born:
82.1% (245)
Two or more races - Speak only English Native:
72.7% (282)Foreign-born:
100.0% (34)
Two or more races - Speak another language Native:
33.3% (129)Foreign-born:
3.4% (1)
White alone - Speak only English Native:
98.0% (10,101)Foreign-born:
34.5% (66)
White alone - Speak another language Native:
2.1% (212)Foreign-born:
61.3% (117)
Hispanic or Latino - Speak another language Native:
20.4% (119)Foreign-born:
100.0% (116)
Foreign-born residents in Loveland 942 residents are foreign born (2.9% Asia , 2.6% Africa ).
Marital status for residents in Loveland Marital status - White (Caucasian) population 15 years and over
Males 26.8% Never married61.5% Now married0.4% Separated1.3% Widowed10.0% DivorcedFemales 29.6% Never married50.5% Now married0.4% Separated6.3% Widowed13.1% DivorcedWomen who gave birth in the past 12 months Now married:
100.0% (102)Unmarried:
0.0% (0)
Women who did not give birth in the past 12 months Now married:
41.8% (1,032)Unmarried:
58.2% (1,437)
Marital status - Black or African American population 15 years and over
Males 11.0% Never married82.0% Now married4.9% Separated0.6% Widowed1.5% DivorcedFemales 30.5% Never married55.6% Now married0.0% Separated1.9% Widowed12.1% DivorcedWomen who did not give birth in the past 12 months Now married:
64.6% (173)Unmarried:
35.4% (95)
Marital status - American Indian / Alaska Native population 15 years and over
Males 61.8% Never married38.2% Now married0.0% Separated0.0% Widowed0.0% DivorcedFemales 0.0% Never married100.0% Now married0.0% Separated0.0% Widowed0.0% DivorcedWomen who did not give birth in the past 12 months Now married:
100.0% (50)Unmarried:
0.0% (0)
Marital status - Asian population 15 years and over
Males 0.0% Never married43.0% Now married0.0% Separated0.0% Widowed57.0% DivorcedFemales 10.2% Never married33.8% Now married28.7% Separated0.0% Widowed27.4% DivorcedWomen who did not give birth in the past 12 months Now married:
86.0% (97)Unmarried:
14.0% (16)
Marital status - Two or more races population 15 years and over
Males 35.2% Never married36.6% Now married0.0% Separated28.2% Widowed0.0% DivorcedFemales 29.9% Never married18.2% Now married0.0% Separated7.8% Widowed44.2% DivorcedWomen who did not give birth in the past 12 months Now married:
0.0% (0)Unmarried:
100.0% (38)
Marital status - White alone, not Hispanic / Latino population 15 years and over
Males 27.2% Never married60.9% Now married0.4% Separated1.3% Widowed10.2% DivorcedFemales 29.7% Never married50.4% Now married0.4% Separated6.3% Widowed13.2% DivorcedWomen who gave birth in the past 12 months Now married:
100.0% (103)Unmarried:
0.0% (0)
Women who did not give birth in the past 12 months Now married:
41.7% (1,034)Unmarried:
58.3% (1,449)
Marital status - Hispanic or Latino population 15 years and over
Males 28.0% Never married72.0% Now married0.0% Separated0.0% Widowed0.0% DivorcedFemales 7.8% Never married92.2% Now married0.0% Separated0.0% Widowed0.0% DivorcedWomen who did not give birth in the past 12 months Now married:
85.5% (104)Unmarried:
14.5% (18)
Ancestries in Loveland
1,392 24.9% German692 12.4% English410 7.3% Irish365 6.5% American298 5.3% Zimbabwean282 5.1% European271 4.9% Italian145 2.6% African141 2.5% Scottish98 1.8% Polish83 1.5% Turkish78 1.4% Scotch-Irish68 1.2% Eastern European44 0.8% Slovak40 0.7% Canadian24 0.4% Russian18 0.3% Croatian17 0.3% Northern European16 0.3% Greek15 0.3% Danish15 0.3% Welsh14 0.3% Finnish14 0.3% French Canadian12 0.2% Arab11 0.2% Pennsylvania German10 0.2% Scandinavian9 0.2% French9 0.2% Swiss8 0.1% Lithuanian5 0.09% British
Children Nativity (place of birth) in Loveland
Children under 6 years - Living with two parents Both parents native 555 100.0% NativeBoth parents foreign-born 266 100.0% NativeOne native, one foreign-born parent 13 100.0% NativeChildren under 6 years - Living with one parent Native parent 97 100.0% Native
Children 6 to 17 years - Living with two parents Both parents native 1,442 100.0% NativeBoth parents foreign-born 173 100.0% NativeOne native, one foreign-born parent 205 100.0% NativeChildren 6 to 17 years - Living with one parent Native parent 646 100.0% Native
Grandparents responsible for own grandchildren in Loveland
Grandparents (30 to 59 years) White / Caucasian 83 58.1% Responsible for grandchildren60 41.9% Not responsible for grandchildrenOther race 109 100.0% Responsible for grandchildrenWhite alone, not Hispanic / Latino 58 47.6% Responsible for grandchildren63 52.4% Not responsible for grandchildrenHispanic or Latino 131 100.0% Responsible for grandchildrenGrandparents (60 years and over) White / Caucasian 43 52.9% Responsible for grandchildren39 47.1% Not responsible for grandchildrenWhite alone, not Hispanic / Latino 43 52.8% Responsible for grandchildren39 47.2% Not responsible for grandchildren