Races in Lower Peninsula, Washington (WA) Detailed Stats
Ancestries, Foreign-born residents, place of birth
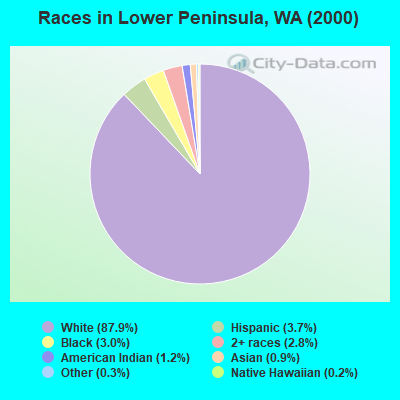
Race distribution in Lower Peninsula

- 11,88687.9%White alone
- 4943.7%Hispanic
- 4003.0%Black alone
- 3852.8%Two or more races
- 1631.2%American Indian alone
- 1260.9%Asian alone
- 420.3%Other race alone
- 260.2%Native Hawaiian and Other
Pacific Islander alone
2000
2022
-
- 4,652,49078.9%White alone
- 441,5097.5%Hispanic
- 319,4015.4%Asian alone
- 184,6313.1%Black alone
- 175,9263.0%Two or more races
- 85,3961.4%American Indian alone
- 22,7790.4%Native Hawaiian and Other
Pacific Islander alone - 11,9890.2%Other race alone

-
- 4,941,45663.5%White alone
- 1,093,31314.0%Hispanic
- 755,8329.7%Asian alone
- 523,4486.7%Two or more races
- 299,5373.8%Black alone
- 69,0240.9%American Indian alone
- 52,2310.7%Native Hawaiian and Other
Pacific Islander alone - 50,9450.7%Other race alone

Income and house value in Lower Peninsula
- Median household income in 2022
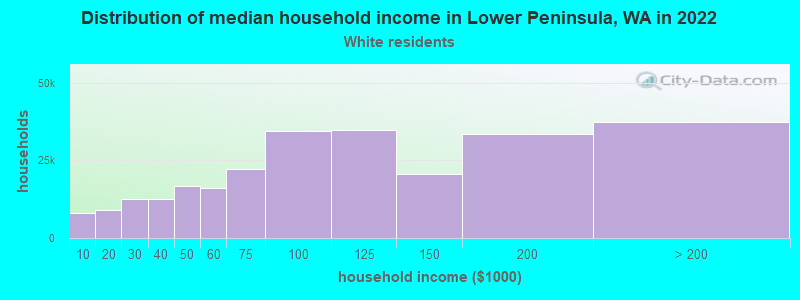
- $102,078White non-Hispanic householders
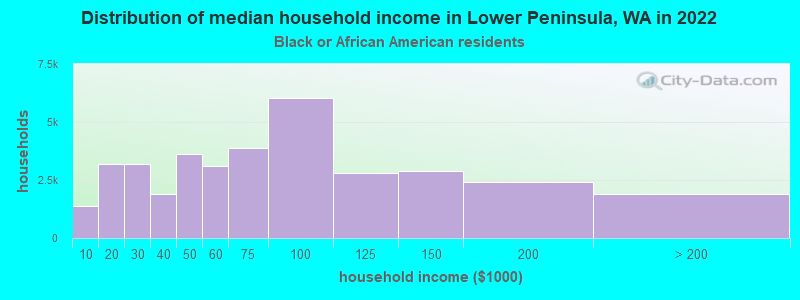
- $95,525Black householders
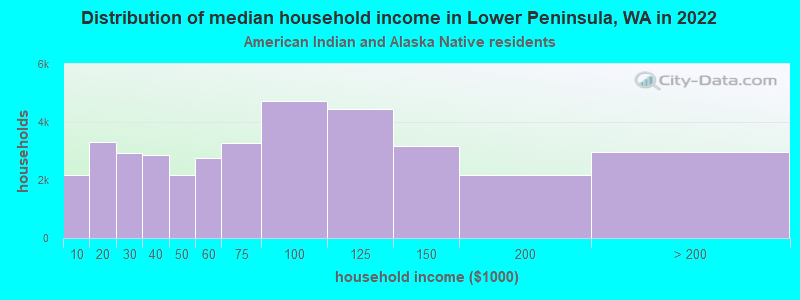
- over $200,000American Indian and Alaska Native householders
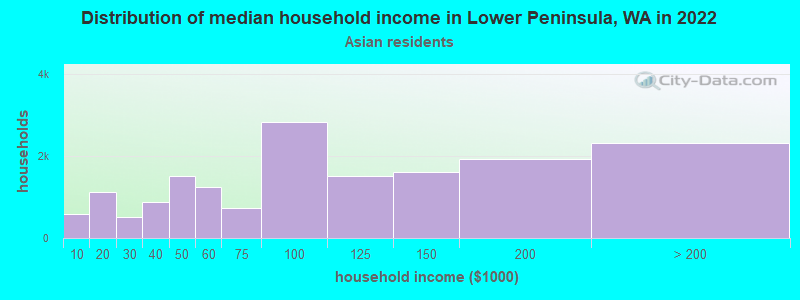
- $65,307Asian householders
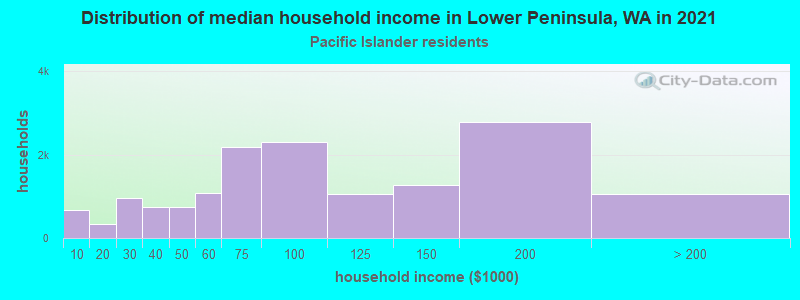
- $94,109Native Hawaiian and other Pacific Islander householders
- $79,382Some other race householders
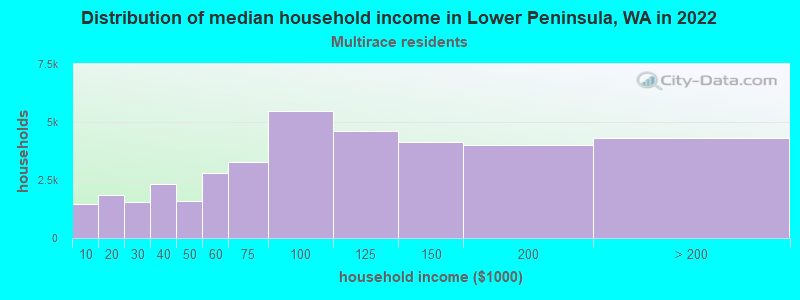
- $91,604Two or more races householders
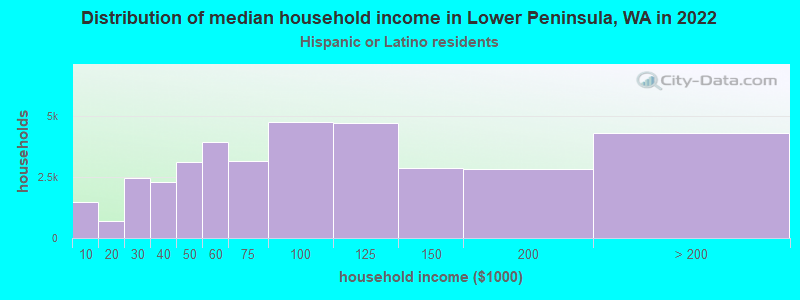
- $98,963Hispanic or Latino race householders
- Median 2022 house value
- $545,585White Non-Hispanic householders
- $419,537Black or African American householders
- $512,768American Indian or Alaska Native householders
- $632,476Asian householders
- $699,229Native Hawaiian and other Pacific Islander householders
- $316,984Some other race householders
- $566,469Two or more races householders
- $316,984Hispanic or Latino householders
Household income for White non-Hispanic householders
Household income for Black householders
Household income for American Indian and Alaska Native householders
Household income for Asian householders
Household income for Native Hawaiian and other Pacific Islander householders
Household income for Two or more races householders
Household income for Hispanic or Latino race householders
Zip code: 98349