Races in Lynden, Washington (WA) Detailed Stats
Data:
Races - White alone (%)
Races - White alone (% change since 2000)
Races - Black alone (%)
Races - Black alone (% change since 2000)
Races - American Indian alone (%)
Races - American Indian alone (% change since 2000)
Races - Asian alone (%)
Races - Asian alone (% change since 2000)
Races - Hispanic (%)
Races - Hispanic (% change since 2000)
Races - Native Hawaiian and Other Pacific Islander alone (%)
Races - Native Hawaiian and Other Pacific Islander alone (% change since 2000)
Races - Two or more races(%)
Races - Two or more races(% change since 2000)
Races - Other race alone (%)
Races - Other race alone (% change since 2000)
Racial diversity
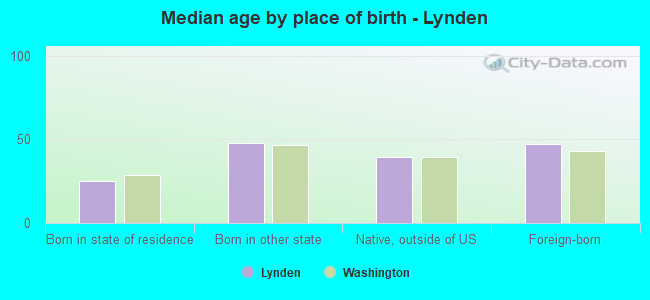
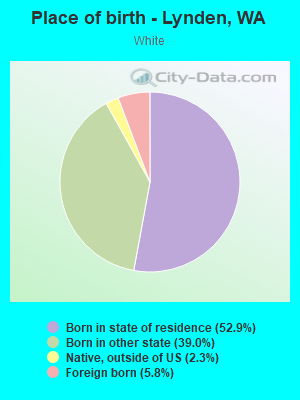
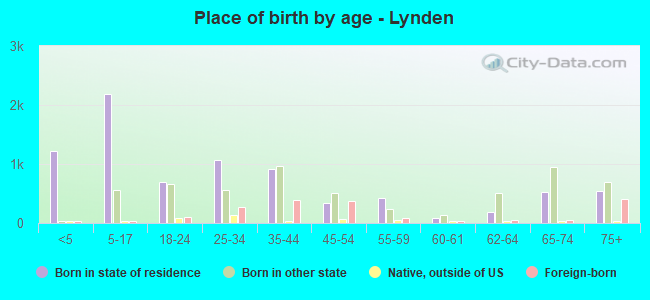
Place of birth - Born in state of residence (%)
Place of birth - Born in state of residence (%) - White
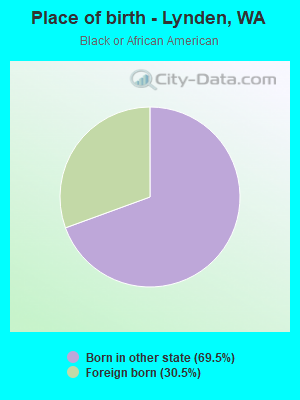
Place of birth - Born in state of residence (%) - Black or African American
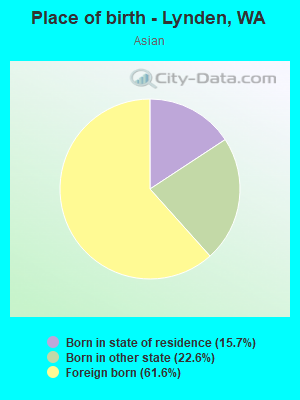
Place of birth - Born in state of residence (%) - Asian
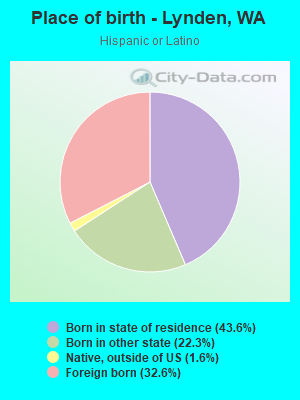
Place of birth - Born in state of residence (%) - Hispanic or Latino
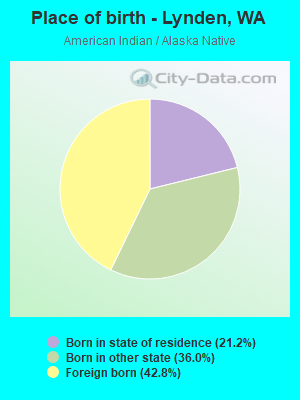
Place of birth - Born in state of residence (%) - American Indian and Alaska Native
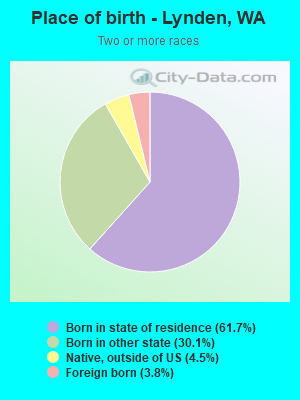
Place of birth - Born in state of residence (%) - Multirace
Place of birth - Born in state of residence (%) - Other Race
Place of birth - Born in other state (%)
Place of birth - Born in other state (%) - White
Place of birth - Born in other state (%) - Black or African American
Place of birth - Born in other state (%) - Asian
Place of birth - Born in other state (%) - Hispanic or Latino
Place of birth - Born in other state (%) - American Indian and Alaska Native
Place of birth - Born in other state (%) - Multirace
Place of birth - Born in other state (%) - Other Race
Place of birth - Native, outside of US (%)
Place of birth - Native, outside of US (%) - White
Place of birth - Native, outside of US (%) - Black or African American
Place of birth - Native, outside of US (%) - Asian
Place of birth - Native, outside of US (%) - Hispanic or Latino
Place of birth - Native, outside of US (%) - American Indian and Alaska Native
Place of birth - Native, outside of US (%) - Multirace
Place of birth - Native, outside of US (%) - Other Race
Place of birth - Foreign born (%)
Place of birth - Foreign born (%) - White
Place of birth - Foreign born (%) - Black or African American
Place of birth - Foreign born (%) - Asian
Place of birth - Foreign born (%) - Hispanic or Latino
Place of birth - Foreign born (%) - American Indian and Alaska Native
Place of birth - Foreign born (%) - Multirace
Place of birth - Foreign born (%) - Other Race
Residents speaking English at home (%)
Residents speaking English at home - Born in the United States (%)
Residents speaking English at home - Native, born elsewhere (%)
Residents speaking English at home - Foreign born (%)
Residents speaking Spanish at home (%)
Residents speaking Spanish at home - Born in the United States (%)
Residents speaking Spanish at home - Native, born elsewhere (%)
Residents speaking Spanish at home - Foreign born (%)
Residents speaking other language at home (%)
Residents speaking other language at home - Born in the United States (%)
Residents speaking other language at home - Native, born elsewhere (%)
Residents speaking other language at home - Foreign born (%)
Marital status - Never married (%)
Marital status - Now married (%)
Marital status - Separated (%)
Marital status - Widowed (%)
Marital status - Divorced (%)
Ancestries Reported - Arab (%)
Ancestries Reported - Czech (%)
Ancestries Reported - Danish (%)
Ancestries Reported - Dutch (%)
Ancestries Reported - English (%)
Ancestries Reported - French (%)
Ancestries Reported - French Canadian (%)
Ancestries Reported - German (%)
Ancestries Reported - Greek (%)
Ancestries Reported - Hungarian (%)
Ancestries Reported - Irish (%)
Ancestries Reported - Italian (%)
Ancestries Reported - Lithuanian (%)
Ancestries Reported - Norwegian (%)
Ancestries Reported - Polish (%)
Ancestries Reported - Portuguese (%)
Ancestries Reported - Russian (%)
Ancestries Reported - Scotch-Irish (%)
Ancestries Reported - Scottish (%)
Ancestries Reported - Slovak (%)
Ancestries Reported - Subsaharan African (%)
Ancestries Reported - Swedish (%)
Ancestries Reported - Swiss (%)
Ancestries Reported - Ukrainian (%)
Ancestries Reported - United States (%)
Ancestries Reported - Welsh (%)
Ancestries Reported - West Indian (%)
Ancestries Reported - Other (%)
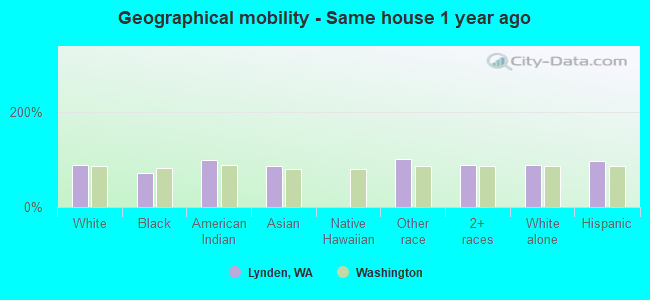
Geographical mobility - Same house 1 year ago (%)
Geographical mobility - Same house 1 year ago (%) - White
Geographical mobility - Same house 1 year ago (%) - Black or African American
Geographical mobility - Same house 1 year ago (%) - Asian
Geographical mobility - Same house 1 year ago (%) - Hispanic or Latino
Geographical mobility - Same house 1 year ago (%) - American Indian and Alaska Native
Geographical mobility - Same house 1 year ago (%) - Multirace
Geographical mobility - Same house 1 year ago (%) - Other Race
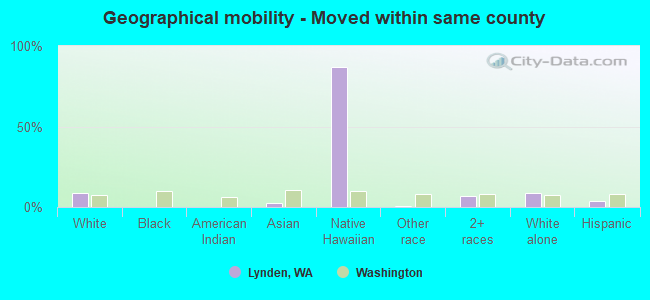
Geographical mobility - Moved within same county (%)
Geographical mobility - Moved within same county (%) - White
Geographical mobility - Moved within same county (%) - Black or African American
Geographical mobility - Moved within same county (%) - Asian
Geographical mobility - Moved within same county (%) - Hispanic or Latino
Geographical mobility - Moved within same county (%) - American Indian and Alaska Native
Geographical mobility - Moved within same county (%) - Multirace
Geographical mobility - Moved within same county (%) - Other Race
Geographical mobility - Moved from different county within same state (%)
Geographical mobility - Moved from different county within same state (%) - White
Geographical mobility - Moved from different county within same state (%) - Black or African American
Geographical mobility - Moved from different county within same state (%) - Asian
Geographical mobility - Moved from different county within same state (%) - Hispanic or Latino
Geographical mobility - Moved from different county within same state (%) - American Indian and Alaska Native
Geographical mobility - Moved from different county within same state (%) - Multirace
Geographical mobility - Moved from different county within same state (%) - Other Race
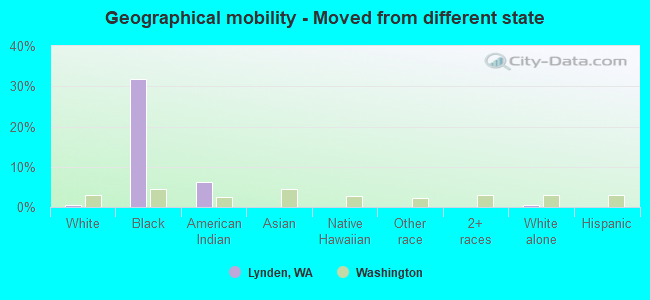
Geographical mobility - Moved from different state (%)
Geographical mobility - Moved from different state (%) - White
Geographical mobility - Moved from different state (%) - Black or African American
Geographical mobility - Moved from different state (%) - Asian
Geographical mobility - Moved from different state (%) - Hispanic or Latino
Geographical mobility - Moved from different state (%) - American Indian and Alaska Native
Geographical mobility - Moved from different state (%) - Multirace
Geographical mobility - Moved from different state (%) - Other Race
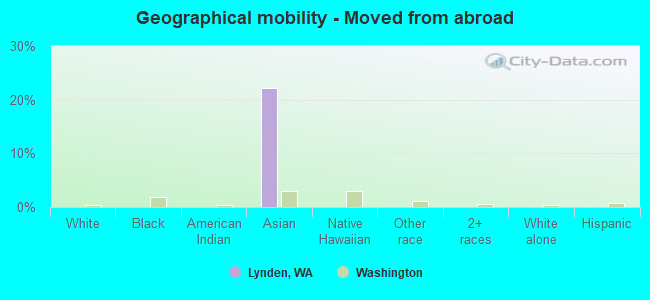
Geographical mobility - Moved from abroad (%)
Geographical mobility - Moved from abroad (%) - White
Geographical mobility - Moved from abroad (%) - Black or African American
Geographical mobility - Moved from abroad (%) - Asian
Geographical mobility - Moved from abroad (%) - Hispanic or Latino
Geographical mobility - Moved from abroad (%) - American Indian and Alaska Native
Geographical mobility - Moved from abroad (%) - Multirace
Geographical mobility - Moved from abroad (%) - Other Race
Place of birth for the foreign-born population - Ireland (%)
Place of birth for the foreign-born population - Denmark (%)
Place of birth for the foreign-born population - Norway (%)
Place of birth for the foreign-born population - Sweden (%)
Place of birth for the foreign-born population - United Kingdom (%)
Place of birth for the foreign-born population - England (%)
Place of birth for the foreign-born population - Scotland (%)
Place of birth for the foreign-born population - Other Northern Europe (%)
Place of birth for the foreign-born population - Austria (%)
Place of birth for the foreign-born population - Belgium (%)
Place of birth for the foreign-born population - France (%)
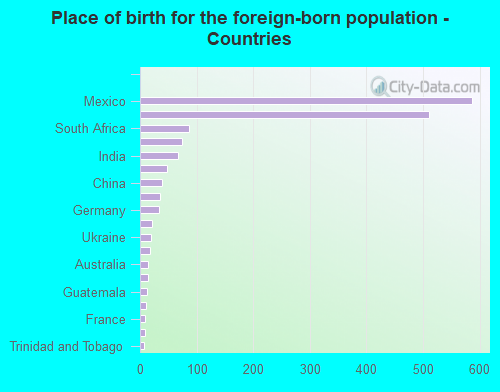
Place of birth for the foreign-born population - Germany (%)
Place of birth for the foreign-born population - Netherlands (%)
Place of birth for the foreign-born population - Switzerland (%)
Place of birth for the foreign-born population - Other Western Europe (%)
Place of birth for the foreign-born population - Greece (%)
Place of birth for the foreign-born population - Italy (%)
Place of birth for the foreign-born population - Portugal (%)
Place of birth for the foreign-born population - Spain (%)
Place of birth for the foreign-born population - Other Southern Europe (%)
Place of birth for the foreign-born population - Albania (%)
Place of birth for the foreign-born population - Belarus (%)
Place of birth for the foreign-born population - Bosnia and Herzegovina (%)
Place of birth for the foreign-born population - Bulgaria (%)
Place of birth for the foreign-born population - Croatia (%)
Place of birth for the foreign-born population - Czechoslovakia (%)
Place of birth for the foreign-born population - Hungary (%)
Place of birth for the foreign-born population - Latvia (%)
Place of birth for the foreign-born population - Lithuania (%)
Place of birth for the foreign-born population - North Macedonia (Macedonia) (%)
Place of birth for the foreign-born population - Moldova (%)
Place of birth for the foreign-born population - Poland (%)
Place of birth for the foreign-born population - Romania (%)
Place of birth for the foreign-born population - Russia (%)
Place of birth for the foreign-born population - Serbia (%)
Place of birth for the foreign-born population - Ukraine (%)
Place of birth for the foreign-born population - Other Eastern Europe (%)
Place of birth for the foreign-born population - China (%)
Place of birth for the foreign-born population - Hong Kong (%)
Place of birth for the foreign-born population - Taiwan (%)
Place of birth for the foreign-born population - Japan (%)
Place of birth for the foreign-born population - Korea (%)
Place of birth for the foreign-born population - Other Eastern Asia (%)
Place of birth for the foreign-born population - Afghanistan (%)
Place of birth for the foreign-born population - Bangladesh (%)
Place of birth for the foreign-born population - India (%)
Place of birth for the foreign-born population - Iran (%)
Place of birth for the foreign-born population - Kazakhstan (%)
Place of birth for the foreign-born population - Nepal (%)
Place of birth for the foreign-born population - Pakistan (%)
Place of birth for the foreign-born population - Sri Lanka (%)
Place of birth for the foreign-born population - Uzbekistan (%)
Place of birth for the foreign-born population - Other South Central Asia (%)
Place of birth for the foreign-born population - Burma (%)
Place of birth for the foreign-born population - Cambodia (%)
Place of birth for the foreign-born population - Indonesia (%)
Place of birth for the foreign-born population - Laos (%)
Place of birth for the foreign-born population - Malaysia (%)
Place of birth for the foreign-born population - Philippines (%)
Place of birth for the foreign-born population - Singapore (%)
Place of birth for the foreign-born population - Thailand (%)
Place of birth for the foreign-born population - Vietnam (%)
Place of birth for the foreign-born population - Other South Eastern Asia (%)
Place of birth for the foreign-born population - Armenia (%)
Place of birth for the foreign-born population - Iraq (%)
Place of birth for the foreign-born population - Israel (%)
Place of birth for the foreign-born population - Jordan (%)
Place of birth for the foreign-born population - Kuwait (%)
Place of birth for the foreign-born population - Lebanon (%)
Place of birth for the foreign-born population - Saudi Arabia (%)
Place of birth for the foreign-born population - Syria (%)
Place of birth for the foreign-born population - Turkey (%)
Place of birth for the foreign-born population - Yemen (%)
Place of birth for the foreign-born population - Other Western Asia (%)
Place of birth for the foreign-born population - Eritrea (%)
Place of birth for the foreign-born population - Ethiopia (%)
Place of birth for the foreign-born population - Kenya (%)
Place of birth for the foreign-born population - Somalia (%)
Place of birth for the foreign-born population - Uganda (%)
Place of birth for the foreign-born population - Zimbabwe (%)
Place of birth for the foreign-born population - Other Eastern Africa (%)
Place of birth for the foreign-born population - Cameroon (%)
Place of birth for the foreign-born population - Congo (%)
Place of birth for the foreign-born population - Democratic Republic of Congo (Zaire) (%)
Place of birth for the foreign-born population - Other Middle Africa (%)
Place of birth for the foreign-born population - Egypt (%)
Place of birth for the foreign-born population - Morocco (%)
Place of birth for the foreign-born population - Sudan (%)
Place of birth for the foreign-born population - Other Northern Africa (%)
Place of birth for the foreign-born population - South Africa (%)
Place of birth for the foreign-born population - Other Southern Africa (%)
Place of birth for the foreign-born population - Cabo Verde (%)
Place of birth for the foreign-born population - Ghana (%)
Place of birth for the foreign-born population - Liberia (%)
Place of birth for the foreign-born population - Nigeria (%)
Place of birth for the foreign-born population - Senegal (%)
Place of birth for the foreign-born population - Sierra Leone (%)
Place of birth for the foreign-born population - Other Western Africa (%)
Place of birth for the foreign-born population - Australia (%)
Place of birth for the foreign-born population - New Zealand (%)
Place of birth for the foreign-born population - Fiji (%)
Place of birth for the foreign-born population - Micronesia (%)
Place of birth for the foreign-born population - Bahamas (%)
Place of birth for the foreign-born population - Barbados (%)
Place of birth for the foreign-born population - Cuba (%)
Place of birth for the foreign-born population - Dominica (%)
Place of birth for the foreign-born population - Dominican Republic (%)
Place of birth for the foreign-born population - Grenada (%)
Place of birth for the foreign-born population - Haiti (%)
Place of birth for the foreign-born population - Jamaica (%)
Place of birth for the foreign-born population - St. Vincent and the Grenadines (%)
Place of birth for the foreign-born population - Trinidad and Tobago (%)
Place of birth for the foreign-born population - West Indies (%)
Place of birth for the foreign-born population - Other Caribbean (%)
Place of birth for the foreign-born population - Belize (%)
Place of birth for the foreign-born population - Costa Rica (%)
Place of birth for the foreign-born population - El Salvador (%)
Place of birth for the foreign-born population - Guatemala (%)
Place of birth for the foreign-born population - Honduras (%)
Place of birth for the foreign-born population - Mexico (%)
Place of birth for the foreign-born population - Nicaragua (%)
Place of birth for the foreign-born population - Panama (%)
Place of birth for the foreign-born population - Other Central America (%)
Place of birth for the foreign-born population - Argentina (%)
Place of birth for the foreign-born population - Bolivia (%)
Place of birth for the foreign-born population - Brazil (%)
Place of birth for the foreign-born population - Chile (%)
Place of birth for the foreign-born population - Colombia (%)
Place of birth for the foreign-born population - Ecuador (%)
Place of birth for the foreign-born population - Guyana (%)
Place of birth for the foreign-born population - Peru (%)
Place of birth for the foreign-born population - Uruguay (%)
Place of birth for the foreign-born population - Venezuela (%)
Place of birth for the foreign-born population - Other South America (%)
Place of birth for the foreign-born population - Canada (%)
Place of birth for the foreign-born population - Other Northern America (%)
Place of birth for the foreign-born population - Other (%)
Latest news about races in Lynden, WA collected exclusively by city-data.com from local newspapers, TV, and radio stations
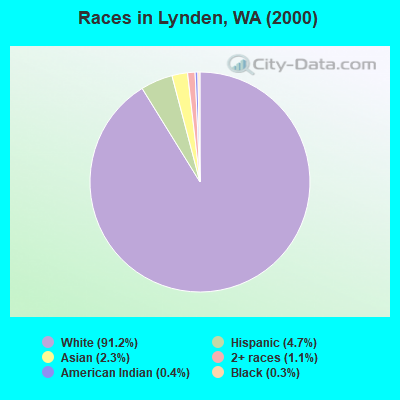
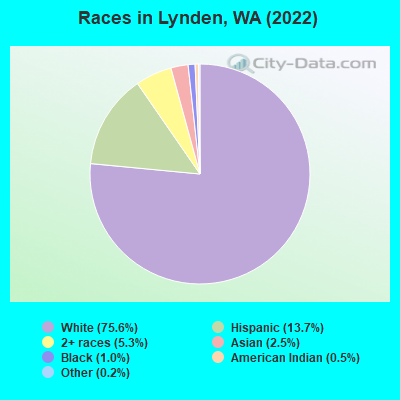
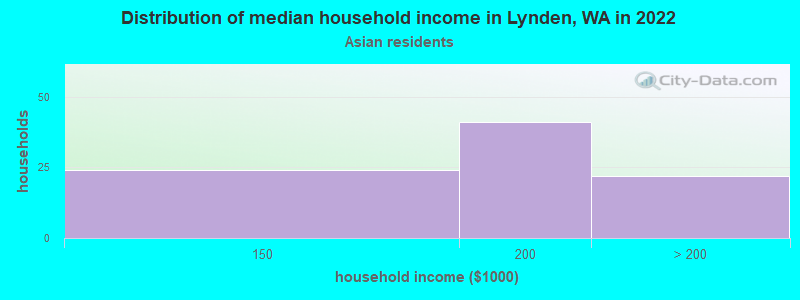
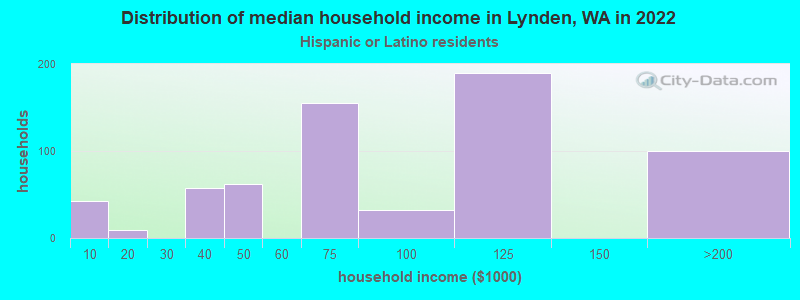
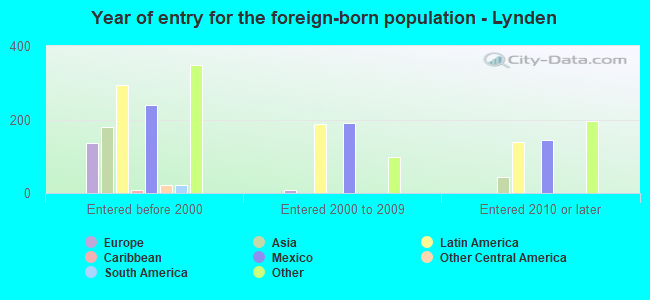
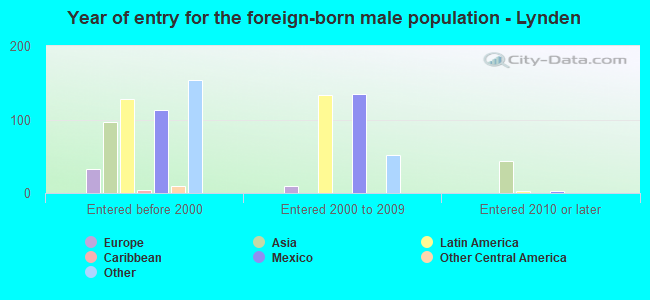
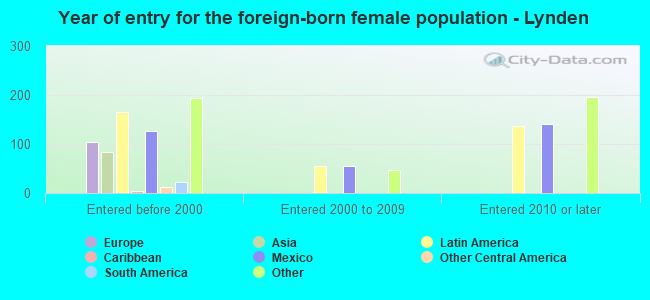
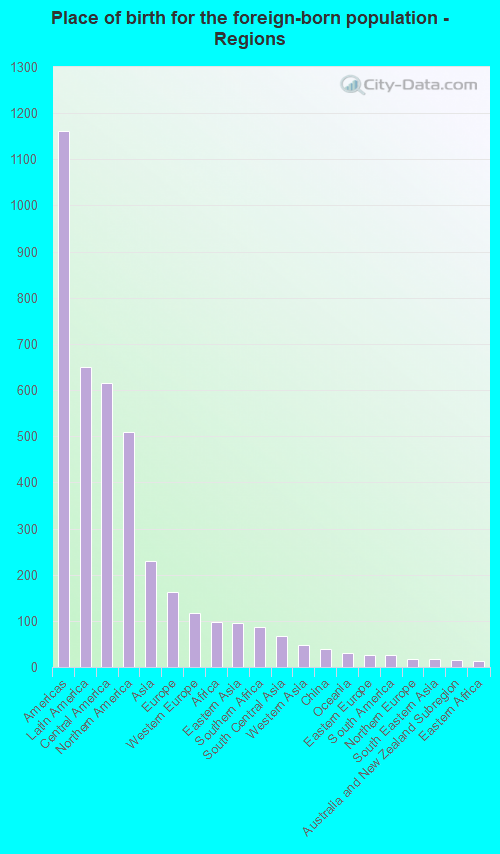
According to 2022 data, the most numerous races in Lynden, WA are White alone (12,103 residents), Hispanic (2,192 residents), and Asian alone (394 residents). 84.8% of Lynden residents speak English at home. 10.5% of Lynden, WA residents are foreign-born (4.0% born in Latin America, 3.1% born in North America, 1.4% born in Asia), which is 42.5% less than the foreign-born rate of 15.0% across the entire state of Washington.
Race distribution in Lynden
2000 2022
4,652,490 78.9% White alone 441,509 7.5% Hispanic 319,401 5.4% Asian alone 184,631 3.1% Black alone 175,926 3.0% Two or more races 85,396 1.4% American Indian alone 22,779 0.4% Native Hawaiian and Other 11,989 0.2% Other race alone
4,941,456 63.5% White alone 1,093,313 14.0% Hispanic 755,832 9.7% Asian alone 523,448 6.7% Two or more races 299,537 3.8% Black alone 69,024 0.9% American Indian alone 52,231 0.7% Native Hawaiian and Other 50,945 0.7% Other race alone
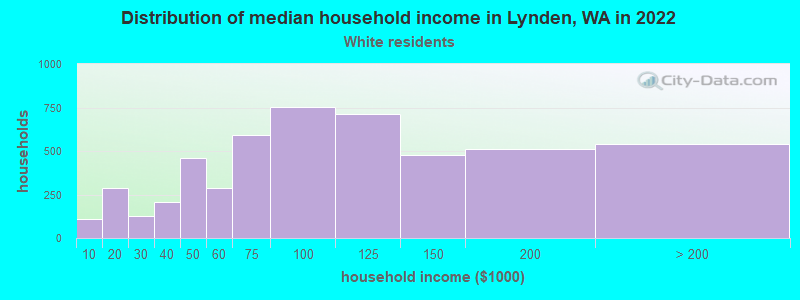
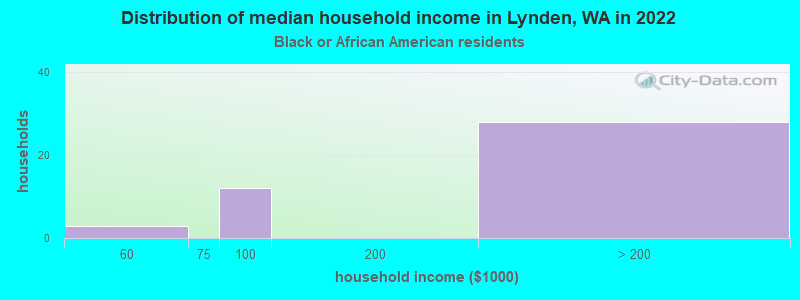
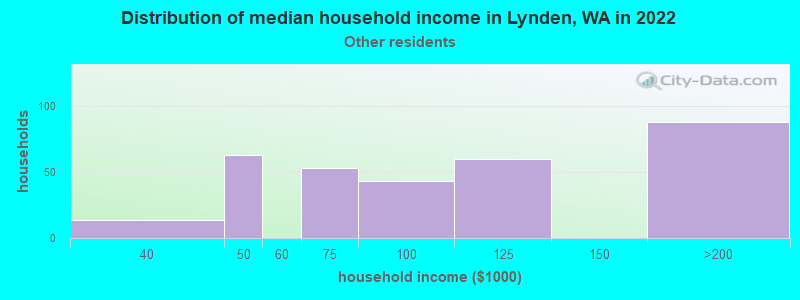
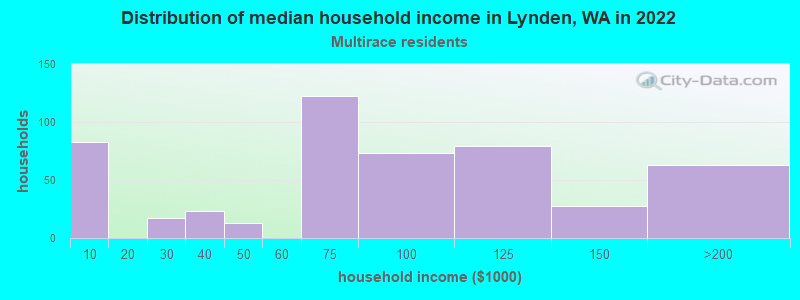
Income and house value in Lynden Median household income in 2022 $87,011 White non-Hispanic householdersover $200,000 Black householders$179,345 Asian householders$149,350 Some other race householders$83,995 Two or more races householders$69,876 Hispanic or Latino race householdersMedian 2022 house value $614,192 White Non-Hispanic householders$632,486 American Indian or Alaska Native householders $558,144 Asian householders$789,342 Some other race householders$729,791 Two or more races householders$600,180 Hispanic or Latino householders
Median age by race in Lynden
39.9 Median age for White residents38.9 40.8 19.2 Median age for Black or African American residents52.7 25.4 40.2 Median age for American Indian / Alaska Native residents23.7 78.0 35.5 Median age for Asian residents30.1 34.6 -393,939,393.5 Median age for Native Hawaiian / Pacific Islander residents-696,774,192.9 -494,407,158.3 22.8 Median age for Other race residents23.5 22.6 20.4 Median age for Two or more races residents30.3 19.1 40.3 Median age for White alone residents39.0 41.1 19.9 Median age for Hispanic or Latino residents20.0 21.2
Owner/renter occupied households by race in Lynden
House owners and renters - White residents 3,360 65.8% Owner occupied1,744 34.2% Renter occupiedHouse owners and renters - Black or African American residents 42 77.9% Owner occupied12 22.1% Renter occupiedHouse owners and renters - American Indian / Alaska Native residents 6 100.0% Renter occupiedHouse owners and renters - Asian residents 87 100.0% Owner occupiedHouse owners and renters - Other race residents 141 57.5% Owner occupied104 42.5% Renter occupiedHouse owners and renters - Two or more races residents 383 74.6% Owner occupied130 25.4% Renter occupiedHouse owners and renters - White alone residents 3,307 66.1% Owner occupied1,693 33.9% Renter occupiedHouse owners and renters - Hispanic or Latino residents 314 53.0% Owner occupied279 47.0% Renter occupied
Language usage in Lynden
English speakers - Total 84.8% of residents of Lynden speak English at home.
8.2% of residents speak Spanish at home 853 71.1% Speak English very well347 28.9% Speak English less than very well6.2% of residents speak other language at home 661 72.1% Speak English very well256 27.9% Speak English less than very well
English speakers - Born in the United States 93.5% of residents of Lynden speak English at home.
3.8% of residents speak Spanish at home 202 92.7% Speak English very well16 7.3% Speak English less than very well3.3% of residents speak other language at home 190 100.0% Speak English very well
English speakers - Native, born elsewhere 86.5% of residents of Lynden speak English at home.
6.5% of residents speak Spanish at home 25 100.0% Speak English very well
English speakers - Foreign-born 33.2% of residents of Lynden speak English at home.
36.1% of residents speak Spanish at home 226 36.6% Speak English very well392 63.4% Speak English less than very well28.7% of residents speak other language at home 269 54.7% Speak English very well223 45.3% Speak English less than very well
White (Caucasian) - Speak only English Native:
96.0% (10,499)Foreign-born:
62.6% (446)
White (Caucasian) - Speak another language Native:
4.0% (432)Foreign-born:
37.1% (264)
Black or African American - Speak only English Native:
100.0% (104)Foreign-born:
79.4% (26)
American Indian / Alaska Native - Speak only English Native:
60.6% (42)Foreign-born:
12.4% (6)
American Indian / Alaska Native - Speak another language Native:
43.8% (30)Foreign-born:
86.3% (45)
Asian - Speak another language Native:
100.0% (106)Foreign-born:
90.2% (176)
Other race - Speak only English Native:
36.5% (246)Foreign-born:
9.8% (49)
Other race - Speak another language Native:
78.4% (528)Foreign-born:
100.0% (498)
Two or more races - Speak only English Native:
87.3% (1,023)Foreign-born:
50.9% (29)
Two or more races - Speak another language Native:
12.3% (144)Foreign-born:
53.4% (30)
White alone - Speak only English Native:
96.5% (10,325)Foreign-born:
67.1% (445)
White alone - Speak another language Native:
3.3% (355)Foreign-born:
32.8% (217)
Hispanic or Latino - Speak only English Native:
47.5% (559)Foreign-born:
7.1% (50)
Hispanic or Latino - Speak another language Native:
40.4% (476)Foreign-born:
93.7% (666)
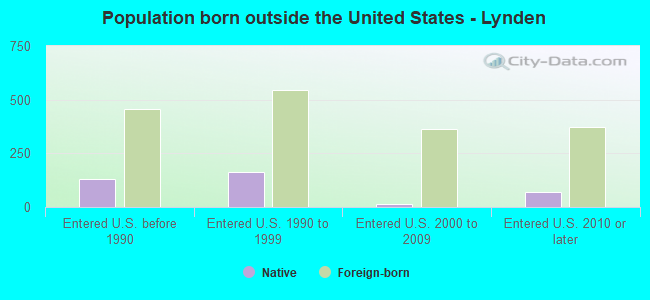
Foreign-born residents in Lynden 1,685 residents are foreign born (4.0% Latin America , 3.1% North America , 1.4% Asia ).
This city:
10.5%Washington:
14.9%
Marital status for residents in Lynden Marital status - White (Caucasian) population 15 years and over
Males 24.0% Never married62.0% Now married0.5% Separated4.6% Widowed8.9% DivorcedFemales 23.1% Never married56.0% Now married0.6% Separated8.6% Widowed11.8% DivorcedWomen who gave birth in the past 12 months Now married:
90.7% (251)Unmarried:
9.3% (26)
Women who did not give birth in the past 12 months Now married:
47.2% (1,228)Unmarried:
52.8% (1,374)
Marital status - Black or African American population 15 years and over
Males 0.0% Never married66.7% Now married0.0% Separated25.0% Widowed8.3% DivorcedFemales 87.2% Never married0.0% Now married0.0% Separated6.4% Widowed6.4% DivorcedWomen who did not give birth in the past 12 months Now married:
0.0% (0)Unmarried:
100.0% (41)
Marital status - American Indian / Alaska Native population 15 years and over
Males 80.5% Never married19.5% Now married0.0% Separated0.0% Widowed0.0% DivorcedFemales 11.1% Never married39.7% Now married0.0% Separated36.5% Widowed12.7% DivorcedWomen who did not give birth in the past 12 months Now married:
53.3% (9)Unmarried:
46.7% (8)
Marital status - Asian population 15 years and over
Males 24.8% Never married57.1% Now married0.0% Separated18.1% Widowed0.0% DivorcedFemales 17.5% Never married74.6% Now married0.0% Separated7.9% Widowed0.0% DivorcedWomen who did not give birth in the past 12 months Now married:
64.5% (43)Unmarried:
35.5% (24)
Marital status - Other race population 15 years and over
Males 17.6% Never married72.1% Now married0.0% Separated0.0% Widowed10.3% DivorcedFemales 17.3% Never married82.7% Now married0.0% Separated0.0% Widowed0.0% DivorcedWomen who did not give birth in the past 12 months Now married:
81.2% (269)Unmarried:
18.8% (62)
Marital status - Two or more races population 15 years and over
Males 24.3% Never married53.8% Now married0.0% Separated2.8% Widowed19.1% DivorcedFemales 40.5% Never married55.1% Now married0.0% Separated1.2% Widowed3.2% DivorcedWomen who gave birth in the past 12 months Now married:
100.0% (16)Unmarried:
0.0% (0)
Women who did not give birth in the past 12 months Now married:
53.4% (160)Unmarried:
46.6% (140)
Marital status - White alone, not Hispanic / Latino population 15 years and over
Males 23.2% Never married62.5% Now married0.5% Separated4.7% Widowed9.1% DivorcedFemales 23.5% Never married55.1% Now married0.6% Separated8.8% Widowed12.0% DivorcedWomen who gave birth in the past 12 months Now married:
90.2% (237)Unmarried:
9.8% (26)
Women who did not give birth in the past 12 months Now married:
45.8% (1,164)Unmarried:
54.2% (1,376)
Marital status - Hispanic or Latino population 15 years and over
Males 24.7% Never married55.1% Now married0.0% Separated2.1% Widowed18.1% DivorcedFemales 14.0% Never married80.5% Now married0.0% Separated5.4% Widowed0.0% DivorcedWomen who gave birth in the past 12 months Now married:
100.0% (16)Unmarried:
0.0% (0)
Women who did not give birth in the past 12 months Now married:
83.0% (343)Unmarried:
17.0% (70)
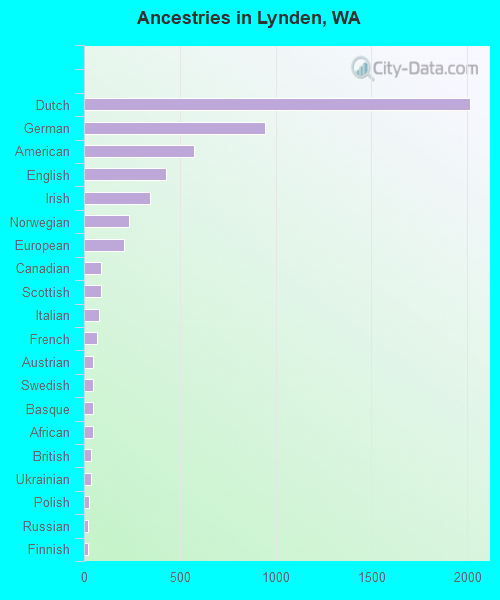
Ancestries in Lynden
2,014 25.7% Dutch944 12.1% German576 7.4% American429 5.5% English343 4.4% Irish236 3.0% Norwegian210 2.7% European87 1.1% Canadian87 1.1% Scottish79 1.0% Italian66 0.8% French47 0.6% Austrian46 0.6% Swedish45 0.6% Basque45 0.6% African39 0.5% British35 0.4% Ukrainian25 0.3% Polish23 0.3% Russian19 0.2% Finnish15 0.2% Eastern European15 0.2% Swiss7 0.09% Northern European7 0.09% Scotch-Irish5 0.06% Trinidadian and Tobagonian4 0.05% Jamaican3 0.04% French Canadian3 0.04% Scandinavian2 0.03% Czech
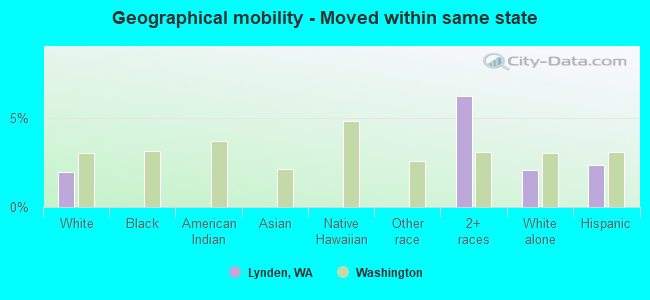
Geographical mobility in Lynden Same house 1 year ago 10,937 89.4% White (Caucasian)99 71.0% Black or African American128 98.3% American Indian / Alaska Native337 85.7% Asian1,360 100.0% Other race1,327 87.2% Two or more races10,666 89.3% White alone, not Hispanic / Latino2,062 95.8% Hispanic or LatinoMoved within same county 1,095 9.0% White / Caucasian9 2.3% Asian13 87.0% Native Hawaiian / Pacific Islander7 0.6% Other race108 7.1% Two or more races1,061 8.9% White alone, not Hispanic / Latino87 4.0% Hispanic or LatinoMoved within same state 238 1.9% White / Caucasian95 6.2% Two or more races248 2.1% White alone, not Hispanic / Latino51 2.4% Hispanic or LatinoMoved from different state 62 0.5% White / Caucasian44 31.9% Black or African American8 6.2% American Indian / Alaska Native65 0.5% White alone, not Hispanic / LatinoMoved from abroad 88 22.2% Asian
Children Nativity (place of birth) in Lynden
Children under 6 years - Living with two parents Both parents native 1,058 96.6% Native37 3.4% Foreign-bornBoth parents foreign-born 85 100.0% NativeOne native, one foreign-born parent 262 100.0% NativeChildren under 6 years - Living with one parent Native parent 29 100.0% NativeForeign-born parent 45 100.0% NativeChildren 6 to 17 years - Living with two parents Both parents native 1,625 100.0% NativeBoth parents foreign-born 405 100.0% NativeOne native, one foreign-born parent 202 100.0% NativeChildren 6 to 17 years - Living with one parent Native parent 220 100.0% NativeForeign-born parent 121 50.6% Native118 49.4% Foreign-born
Grandparents responsible for own grandchildren in Lynden
Grandparents (30 to 59 years) White / Caucasian 51 48.7% Responsible for grandchildren54 51.3% Not responsible for grandchildrenWhite alone, not Hispanic / Latino 51 45.9% Responsible for grandchildren60 54.1% Not responsible for grandchildrenGrandparents (60 years and over) White / Caucasian 8 7.2% Responsible for grandchildren105 92.8% Not responsible for grandchildrenWhite alone, not Hispanic / Latino 8 7.1% Responsible for grandchildren109 92.9% Not responsible for grandchildren