Races in Lynn Haven, Florida (FL) Detailed Stats
Data:
Races - White alone (%)
Races - White alone (% change since 2000)
Races - Black alone (%)
Races - Black alone (% change since 2000)
Races - American Indian alone (%)
Races - American Indian alone (% change since 2000)
Races - Asian alone (%)
Races - Asian alone (% change since 2000)
Races - Hispanic (%)
Races - Hispanic (% change since 2000)
Races - Native Hawaiian and Other Pacific Islander alone (%)
Races - Native Hawaiian and Other Pacific Islander alone (% change since 2000)
Races - Two or more races(%)
Races - Two or more races(% change since 2000)
Races - Other race alone (%)
Races - Other race alone (% change since 2000)
Racial diversity
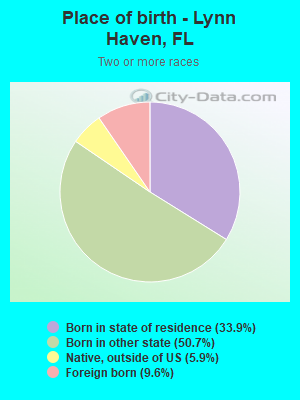
Place of birth - Born in state of residence (%)
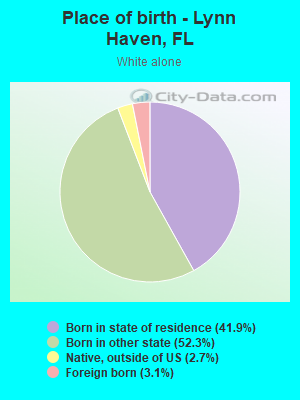
Place of birth - Born in state of residence (%) - White
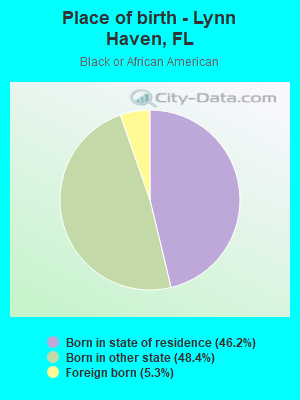
Place of birth - Born in state of residence (%) - Black or African American
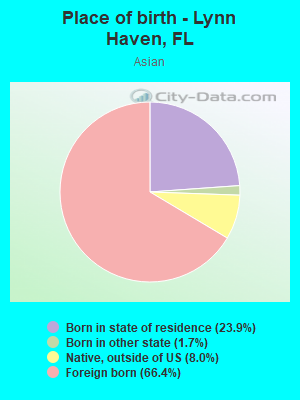
Place of birth - Born in state of residence (%) - Asian
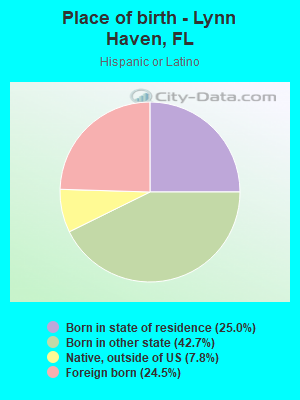
Place of birth - Born in state of residence (%) - Hispanic or Latino
Place of birth - Born in state of residence (%) - American Indian and Alaska Native
Place of birth - Born in state of residence (%) - Multirace
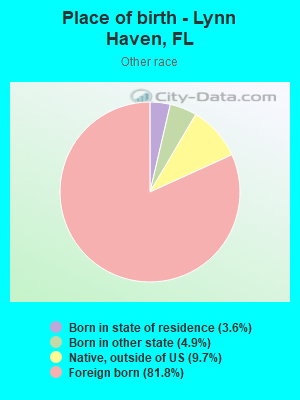
Place of birth - Born in state of residence (%) - Other Race
Place of birth - Born in other state (%)
Place of birth - Born in other state (%) - White
Place of birth - Born in other state (%) - Black or African American
Place of birth - Born in other state (%) - Asian
Place of birth - Born in other state (%) - Hispanic or Latino
Place of birth - Born in other state (%) - American Indian and Alaska Native
Place of birth - Born in other state (%) - Multirace
Place of birth - Born in other state (%) - Other Race
Place of birth - Native, outside of US (%)
Place of birth - Native, outside of US (%) - White
Place of birth - Native, outside of US (%) - Black or African American
Place of birth - Native, outside of US (%) - Asian
Place of birth - Native, outside of US (%) - Hispanic or Latino
Place of birth - Native, outside of US (%) - American Indian and Alaska Native
Place of birth - Native, outside of US (%) - Multirace
Place of birth - Native, outside of US (%) - Other Race
Place of birth - Foreign born (%)
Place of birth - Foreign born (%) - White
Place of birth - Foreign born (%) - Black or African American
Place of birth - Foreign born (%) - Asian
Place of birth - Foreign born (%) - Hispanic or Latino
Place of birth - Foreign born (%) - American Indian and Alaska Native
Place of birth - Foreign born (%) - Multirace
Place of birth - Foreign born (%) - Other Race
Residents speaking English at home (%)
Residents speaking English at home - Born in the United States (%)
Residents speaking English at home - Native, born elsewhere (%)
Residents speaking English at home - Foreign born (%)
Residents speaking Spanish at home (%)
Residents speaking Spanish at home - Born in the United States (%)
Residents speaking Spanish at home - Native, born elsewhere (%)
Residents speaking Spanish at home - Foreign born (%)
Residents speaking other language at home (%)
Residents speaking other language at home - Born in the United States (%)
Residents speaking other language at home - Native, born elsewhere (%)
Residents speaking other language at home - Foreign born (%)
Marital status - Never married (%)
Marital status - Now married (%)
Marital status - Separated (%)
Marital status - Widowed (%)
Marital status - Divorced (%)
Ancestries Reported - Arab (%)
Ancestries Reported - Czech (%)
Ancestries Reported - Danish (%)
Ancestries Reported - Dutch (%)
Ancestries Reported - English (%)
Ancestries Reported - French (%)
Ancestries Reported - French Canadian (%)
Ancestries Reported - German (%)
Ancestries Reported - Greek (%)
Ancestries Reported - Hungarian (%)
Ancestries Reported - Irish (%)
Ancestries Reported - Italian (%)
Ancestries Reported - Lithuanian (%)
Ancestries Reported - Norwegian (%)
Ancestries Reported - Polish (%)
Ancestries Reported - Portuguese (%)
Ancestries Reported - Russian (%)
Ancestries Reported - Scotch-Irish (%)
Ancestries Reported - Scottish (%)
Ancestries Reported - Slovak (%)
Ancestries Reported - Subsaharan African (%)
Ancestries Reported - Swedish (%)
Ancestries Reported - Swiss (%)
Ancestries Reported - Ukrainian (%)
Ancestries Reported - United States (%)
Ancestries Reported - Welsh (%)
Ancestries Reported - West Indian (%)
Ancestries Reported - Other (%)
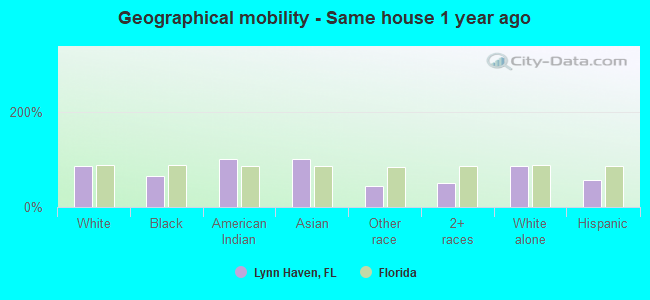
Geographical mobility - Same house 1 year ago (%)
Geographical mobility - Same house 1 year ago (%) - White
Geographical mobility - Same house 1 year ago (%) - Black or African American
Geographical mobility - Same house 1 year ago (%) - Asian
Geographical mobility - Same house 1 year ago (%) - Hispanic or Latino
Geographical mobility - Same house 1 year ago (%) - American Indian and Alaska Native
Geographical mobility - Same house 1 year ago (%) - Multirace
Geographical mobility - Same house 1 year ago (%) - Other Race
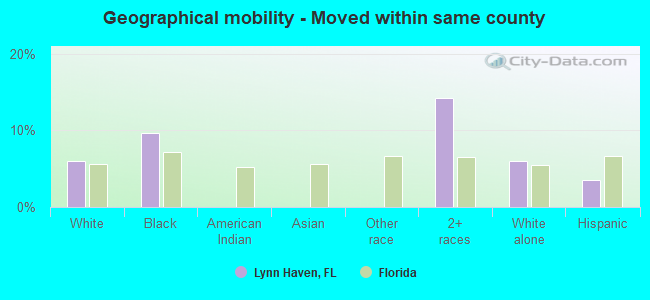
Geographical mobility - Moved within same county (%)
Geographical mobility - Moved within same county (%) - White
Geographical mobility - Moved within same county (%) - Black or African American
Geographical mobility - Moved within same county (%) - Asian
Geographical mobility - Moved within same county (%) - Hispanic or Latino
Geographical mobility - Moved within same county (%) - American Indian and Alaska Native
Geographical mobility - Moved within same county (%) - Multirace
Geographical mobility - Moved within same county (%) - Other Race
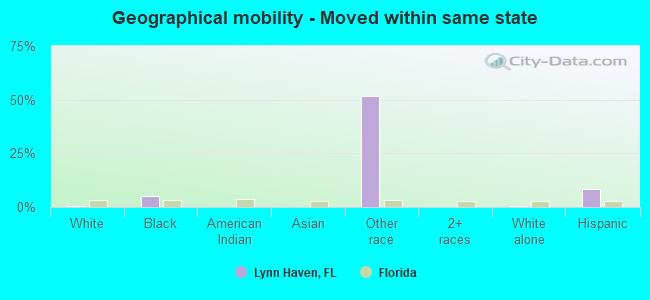
Geographical mobility - Moved from different county within same state (%)
Geographical mobility - Moved from different county within same state (%) - White
Geographical mobility - Moved from different county within same state (%) - Black or African American
Geographical mobility - Moved from different county within same state (%) - Asian
Geographical mobility - Moved from different county within same state (%) - Hispanic or Latino
Geographical mobility - Moved from different county within same state (%) - American Indian and Alaska Native
Geographical mobility - Moved from different county within same state (%) - Multirace
Geographical mobility - Moved from different county within same state (%) - Other Race
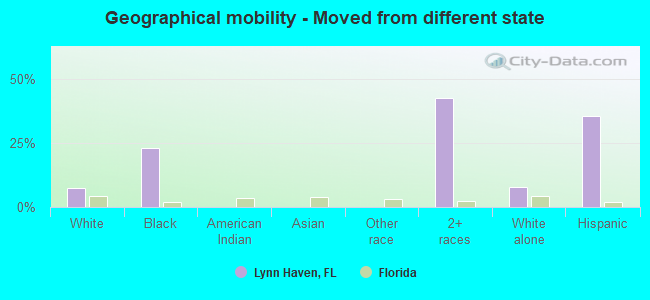
Geographical mobility - Moved from different state (%)
Geographical mobility - Moved from different state (%) - White
Geographical mobility - Moved from different state (%) - Black or African American
Geographical mobility - Moved from different state (%) - Asian
Geographical mobility - Moved from different state (%) - Hispanic or Latino
Geographical mobility - Moved from different state (%) - American Indian and Alaska Native
Geographical mobility - Moved from different state (%) - Multirace
Geographical mobility - Moved from different state (%) - Other Race
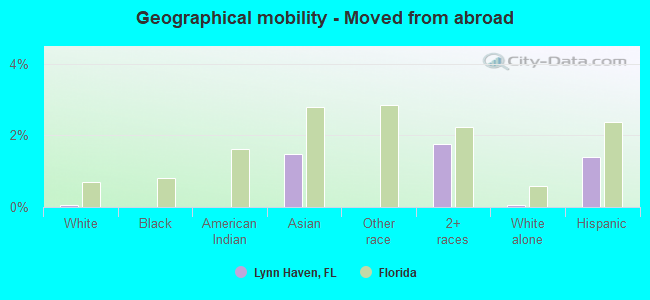
Geographical mobility - Moved from abroad (%)
Geographical mobility - Moved from abroad (%) - White
Geographical mobility - Moved from abroad (%) - Black or African American
Geographical mobility - Moved from abroad (%) - Asian
Geographical mobility - Moved from abroad (%) - Hispanic or Latino
Geographical mobility - Moved from abroad (%) - American Indian and Alaska Native
Geographical mobility - Moved from abroad (%) - Multirace
Geographical mobility - Moved from abroad (%) - Other Race
Place of birth for the foreign-born population - Ireland (%)
Place of birth for the foreign-born population - Denmark (%)
Place of birth for the foreign-born population - Norway (%)
Place of birth for the foreign-born population - Sweden (%)
Place of birth for the foreign-born population - United Kingdom (%)
Place of birth for the foreign-born population - England (%)
Place of birth for the foreign-born population - Scotland (%)
Place of birth for the foreign-born population - Other Northern Europe (%)
Place of birth for the foreign-born population - Austria (%)
Place of birth for the foreign-born population - Belgium (%)
Place of birth for the foreign-born population - France (%)
Place of birth for the foreign-born population - Germany (%)
Place of birth for the foreign-born population - Netherlands (%)
Place of birth for the foreign-born population - Switzerland (%)
Place of birth for the foreign-born population - Other Western Europe (%)
Place of birth for the foreign-born population - Greece (%)
Place of birth for the foreign-born population - Italy (%)
Place of birth for the foreign-born population - Portugal (%)
Place of birth for the foreign-born population - Spain (%)
Place of birth for the foreign-born population - Other Southern Europe (%)
Place of birth for the foreign-born population - Albania (%)
Place of birth for the foreign-born population - Belarus (%)
Place of birth for the foreign-born population - Bosnia and Herzegovina (%)
Place of birth for the foreign-born population - Bulgaria (%)
Place of birth for the foreign-born population - Croatia (%)
Place of birth for the foreign-born population - Czechoslovakia (%)
Place of birth for the foreign-born population - Hungary (%)
Place of birth for the foreign-born population - Latvia (%)
Place of birth for the foreign-born population - Lithuania (%)
Place of birth for the foreign-born population - North Macedonia (Macedonia) (%)
Place of birth for the foreign-born population - Moldova (%)
Place of birth for the foreign-born population - Poland (%)
Place of birth for the foreign-born population - Romania (%)
Place of birth for the foreign-born population - Russia (%)
Place of birth for the foreign-born population - Serbia (%)
Place of birth for the foreign-born population - Ukraine (%)
Place of birth for the foreign-born population - Other Eastern Europe (%)
Place of birth for the foreign-born population - China (%)
Place of birth for the foreign-born population - Hong Kong (%)
Place of birth for the foreign-born population - Taiwan (%)
Place of birth for the foreign-born population - Japan (%)
Place of birth for the foreign-born population - Korea (%)
Place of birth for the foreign-born population - Other Eastern Asia (%)
Place of birth for the foreign-born population - Afghanistan (%)
Place of birth for the foreign-born population - Bangladesh (%)
Place of birth for the foreign-born population - India (%)
Place of birth for the foreign-born population - Iran (%)
Place of birth for the foreign-born population - Kazakhstan (%)
Place of birth for the foreign-born population - Nepal (%)
Place of birth for the foreign-born population - Pakistan (%)
Place of birth for the foreign-born population - Sri Lanka (%)
Place of birth for the foreign-born population - Uzbekistan (%)
Place of birth for the foreign-born population - Other South Central Asia (%)
Place of birth for the foreign-born population - Burma (%)
Place of birth for the foreign-born population - Cambodia (%)
Place of birth for the foreign-born population - Indonesia (%)
Place of birth for the foreign-born population - Laos (%)
Place of birth for the foreign-born population - Malaysia (%)
Place of birth for the foreign-born population - Philippines (%)
Place of birth for the foreign-born population - Singapore (%)
Place of birth for the foreign-born population - Thailand (%)
Place of birth for the foreign-born population - Vietnam (%)
Place of birth for the foreign-born population - Other South Eastern Asia (%)
Place of birth for the foreign-born population - Armenia (%)
Place of birth for the foreign-born population - Iraq (%)
Place of birth for the foreign-born population - Israel (%)
Place of birth for the foreign-born population - Jordan (%)
Place of birth for the foreign-born population - Kuwait (%)
Place of birth for the foreign-born population - Lebanon (%)
Place of birth for the foreign-born population - Saudi Arabia (%)
Place of birth for the foreign-born population - Syria (%)
Place of birth for the foreign-born population - Turkey (%)
Place of birth for the foreign-born population - Yemen (%)
Place of birth for the foreign-born population - Other Western Asia (%)
Place of birth for the foreign-born population - Eritrea (%)
Place of birth for the foreign-born population - Ethiopia (%)
Place of birth for the foreign-born population - Kenya (%)
Place of birth for the foreign-born population - Somalia (%)
Place of birth for the foreign-born population - Uganda (%)
Place of birth for the foreign-born population - Zimbabwe (%)
Place of birth for the foreign-born population - Other Eastern Africa (%)
Place of birth for the foreign-born population - Cameroon (%)
Place of birth for the foreign-born population - Congo (%)
Place of birth for the foreign-born population - Democratic Republic of Congo (Zaire) (%)
Place of birth for the foreign-born population - Other Middle Africa (%)
Place of birth for the foreign-born population - Egypt (%)
Place of birth for the foreign-born population - Morocco (%)
Place of birth for the foreign-born population - Sudan (%)
Place of birth for the foreign-born population - Other Northern Africa (%)
Place of birth for the foreign-born population - South Africa (%)
Place of birth for the foreign-born population - Other Southern Africa (%)
Place of birth for the foreign-born population - Cabo Verde (%)
Place of birth for the foreign-born population - Ghana (%)
Place of birth for the foreign-born population - Liberia (%)
Place of birth for the foreign-born population - Nigeria (%)
Place of birth for the foreign-born population - Senegal (%)
Place of birth for the foreign-born population - Sierra Leone (%)
Place of birth for the foreign-born population - Other Western Africa (%)
Place of birth for the foreign-born population - Australia (%)
Place of birth for the foreign-born population - New Zealand (%)
Place of birth for the foreign-born population - Fiji (%)
Place of birth for the foreign-born population - Micronesia (%)
Place of birth for the foreign-born population - Bahamas (%)
Place of birth for the foreign-born population - Barbados (%)
Place of birth for the foreign-born population - Cuba (%)
Place of birth for the foreign-born population - Dominica (%)
Place of birth for the foreign-born population - Dominican Republic (%)
Place of birth for the foreign-born population - Grenada (%)
Place of birth for the foreign-born population - Haiti (%)
Place of birth for the foreign-born population - Jamaica (%)
Place of birth for the foreign-born population - St. Vincent and the Grenadines (%)
Place of birth for the foreign-born population - Trinidad and Tobago (%)
Place of birth for the foreign-born population - West Indies (%)
Place of birth for the foreign-born population - Other Caribbean (%)
Place of birth for the foreign-born population - Belize (%)
Place of birth for the foreign-born population - Costa Rica (%)
Place of birth for the foreign-born population - El Salvador (%)
Place of birth for the foreign-born population - Guatemala (%)
Place of birth for the foreign-born population - Honduras (%)
Place of birth for the foreign-born population - Mexico (%)
Place of birth for the foreign-born population - Nicaragua (%)
Place of birth for the foreign-born population - Panama (%)
Place of birth for the foreign-born population - Other Central America (%)
Place of birth for the foreign-born population - Argentina (%)
Place of birth for the foreign-born population - Bolivia (%)
Place of birth for the foreign-born population - Brazil (%)
Place of birth for the foreign-born population - Chile (%)
Place of birth for the foreign-born population - Colombia (%)
Place of birth for the foreign-born population - Ecuador (%)
Place of birth for the foreign-born population - Guyana (%)
Place of birth for the foreign-born population - Peru (%)
Place of birth for the foreign-born population - Uruguay (%)
Place of birth for the foreign-born population - Venezuela (%)
Place of birth for the foreign-born population - Other South America (%)
Place of birth for the foreign-born population - Canada (%)
Place of birth for the foreign-born population - Other Northern America (%)
Place of birth for the foreign-born population - Other (%)
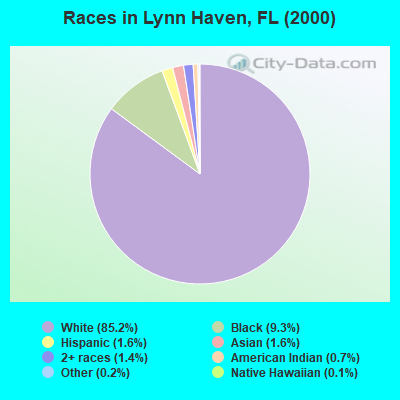
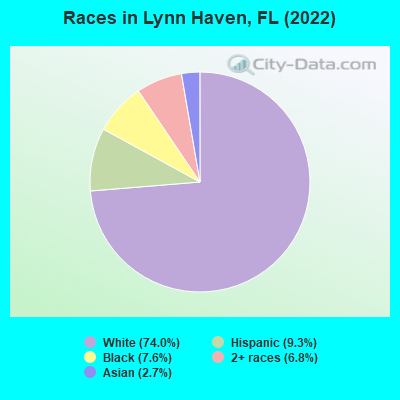
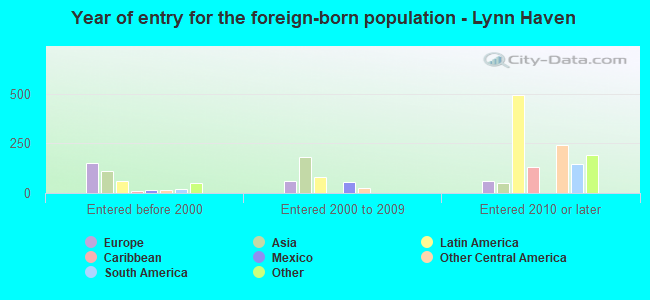
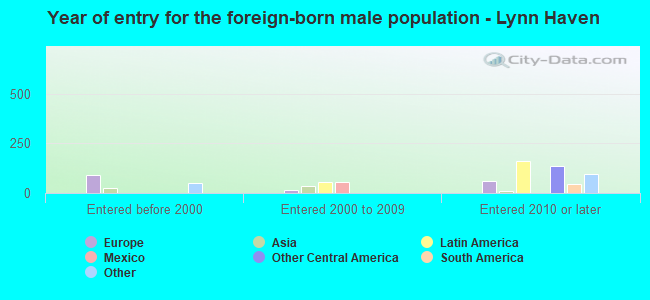
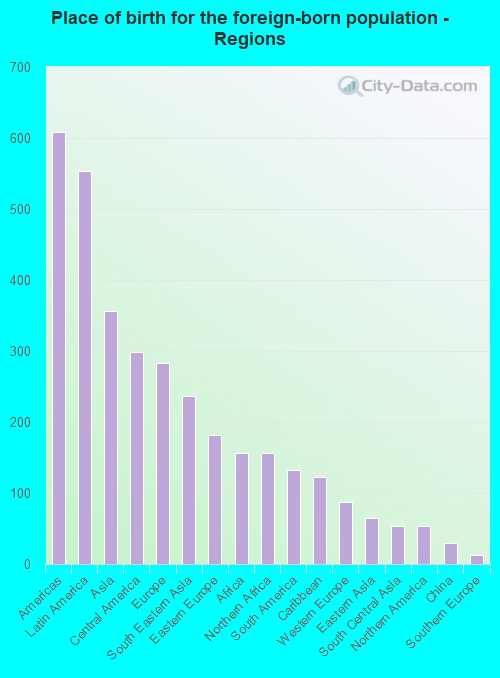
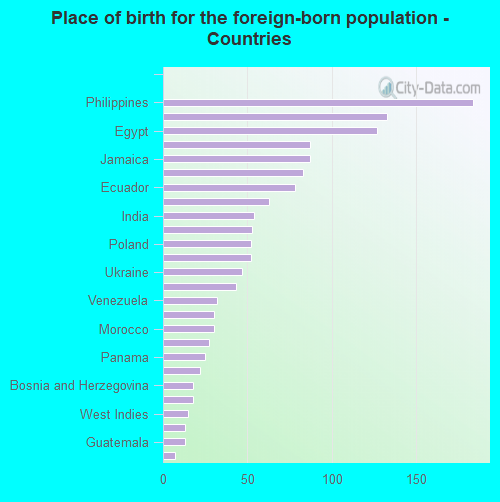
According to 2022 data, the most numerous races in Lynn Haven, FL are White alone (14,690 residents), Hispanic (1,853 residents), and Black alone (1,506 residents). 89.4% of Lynn Haven residents speak English at home. 7.1% of Lynn Haven, FL residents are foreign-born (2.7% born in Latin America, 1.7% born in Asia, 1.4% born in Europe, 0.8% born in Africa), which is 196.6% less than the foreign-born rate of 21.0% across the entire state of Florida.
Race distribution in Lynn Haven
2000 2022
10,458,509 65.4% White alone 2,682,715 16.8% Hispanic 2,264,268 14.2% Black alone 261,693 1.6% Asian alone 236,954 1.5% Two or more races 42,358 0.3% American Indian alone 28,994 0.2% Other race alone 6,887 0.04% Native Hawaiian and Other
11,309,403 50.8% White alone 6,025,039 27.1% Hispanic 3,241,015 14.6% Black alone 861,630 3.9% Two or more races 623,692 2.8% Asian alone 152,054 0.7% Other race alone 22,504 0.1% American Indian alone 9,486 0.04% Native Hawaiian and Other
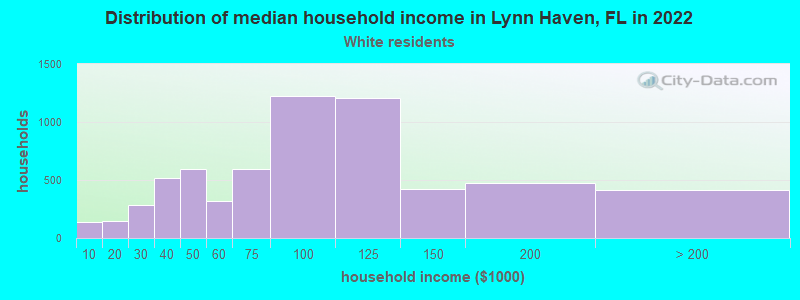
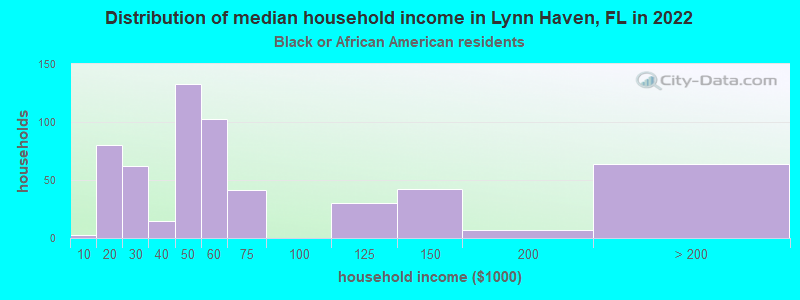
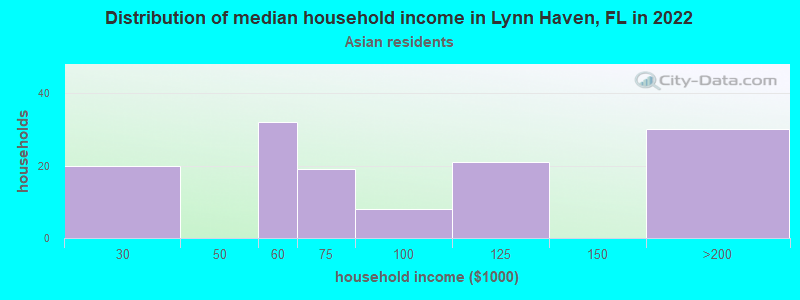
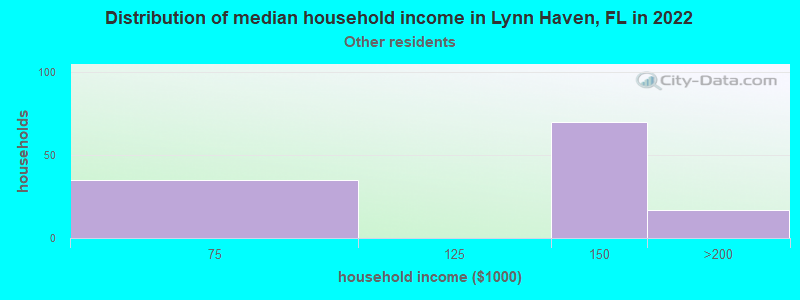
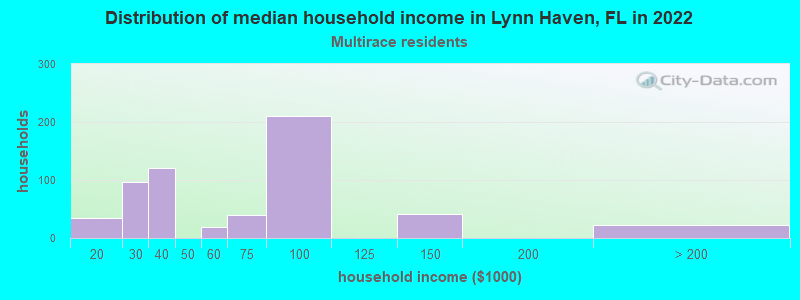
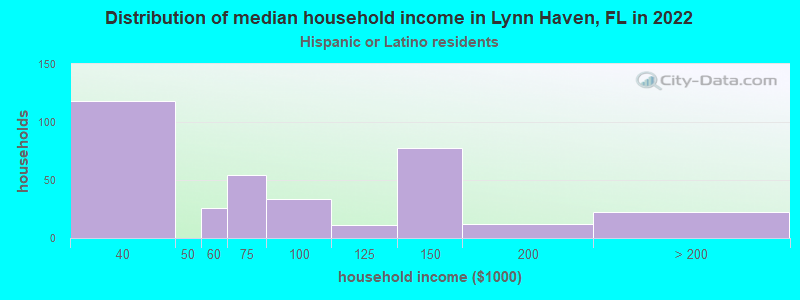
Income and house value in Lynn Haven Median household income in 2022 $86,270 White non-Hispanic householders$50,578 Black householders$69,118 Asian householders$99,769 Some other race householders$88,429 Two or more races householders$76,981 Hispanic or Latino race householdersMedian 2022 house value $338,850 White Non-Hispanic householders$237,297 Black or African American householders $249,949 Asian householders$459,551 Some other race householders$336,456 Two or more races householders$441,770 Hispanic or Latino householders
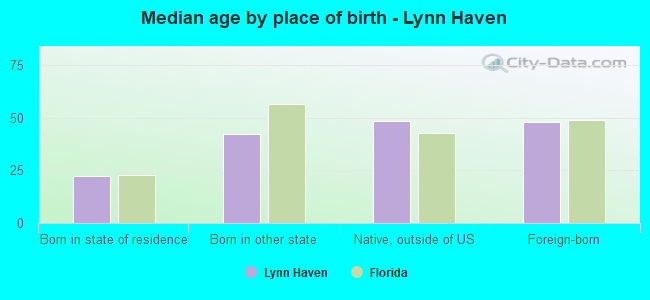
Median age by race in Lynn Haven
36.7 Median age for White residents37.2 36.1 30.5 Median age for Black or African American residents31.8 32.1 -598,566,307.6 Median age for American Indian / Alaska Native residents-611,418,047.3 -594,925,633.7 40.6 Median age for Asian residents29.8 39.7 -679,849,340.2 Median age for Native Hawaiian / Pacific Islander residents-858,307,848.3 -443,298,968.6 24.9 Median age for Other race residents31.6 18.9 19.4 Median age for Two or more races residents13.7 25.4 36.6 Median age for White alone residents36.8 36.0 22.4 Median age for Hispanic or Latino residents20.6 22.7
Owner/renter occupied households by race in Lynn Haven
House owners and renters - White residents 4,501 72.1% Owner occupied1,746 27.9% Renter occupiedHouse owners and renters - Black or African American residents 365 53.5% Owner occupied316 46.5% Renter occupiedHouse owners and renters - American Indian / Alaska Native residents 9 100.0% Owner occupiedHouse owners and renters - Asian residents 56 37.4% Owner occupied94 62.6% Renter occupiedHouse owners and renters - Other race residents 15 13.5% Owner occupied95 86.5% Renter occupiedHouse owners and renters - Two or more races residents 154 23.3% Owner occupied508 76.7% Renter occupiedHouse owners and renters - White alone residents 4,431 72.1% Owner occupied1,717 27.9% Renter occupiedHouse owners and renters - Hispanic or Latino residents 133 33.6% Owner occupied262 66.4% Renter occupied
Language usage in Lynn Haven
English speakers - Total 89.4% of residents of Lynn Haven speak English at home.
6.2% of residents speak Spanish at home 448 39.9% Speak English very well674 60.1% Speak English less than very well4.2% of residents speak other language at home 521 67.8% Speak English very well248 32.2% Speak English less than very well
English speakers - Born in the United States 94.4% of residents of Lynn Haven speak English at home.
4.4% of residents speak Spanish at home 331 81.5% Speak English very well75 18.5% Speak English less than very well1.0% of residents speak other language at home 95 100.0% Speak English very well
English speakers - Native, born elsewhere 71.1% of residents of Lynn Haven speak English at home.
25.2% of residents speak Spanish at home 21 14.0% Speak English very well129 86.0% Speak English less than very well6.9% of residents speak other language at home 41 100.0% Speak English very well
English speakers - Foreign-born 19.7% of residents of Lynn Haven speak English at home.
37.3% of residents speak Spanish at home 67 14.6% Speak English very well392 85.4% Speak English less than very well39.7% of residents speak other language at home 297 60.7% Speak English very well192 39.3% Speak English less than very well
White (Caucasian) - Speak only English Native:
97.9% (13,156)Foreign-born:
16.3% (76)
White (Caucasian) - Speak another language Native:
2.1% (288)Foreign-born:
82.0% (381)
Black or African American - Speak only English Native:
91.7% (1,167)Foreign-born:
97.0% (83)
Asian - Speak only English Native:
75.5% (173)Foreign-born:
22.0% (70)
Asian - Speak another language Native:
22.5% (51)Foreign-born:
77.2% (244)
Other race - Speak only English Native:
44.2% (40)Foreign-born:
14.3% (46)
Other race - Speak another language Native:
66.7% (61)Foreign-born:
87.6% (284)
Two or more races - Speak only English Native:
75.0% (1,453)Foreign-born:
29.6% (71)
Two or more races - Speak another language Native:
26.3% (510)Foreign-born:
71.2% (170)
White alone - Speak only English Native:
98.4% (12,959)Foreign-born:
18.3% (84)
White alone - Speak another language Native:
1.6% (214)Foreign-born:
78.8% (361)
Hispanic or Latino - Speak only English Native:
48.0% (513)Foreign-born:
5.5% (25)
Hispanic or Latino - Speak another language Native:
52.9% (566)Foreign-born:
94.8% (435)
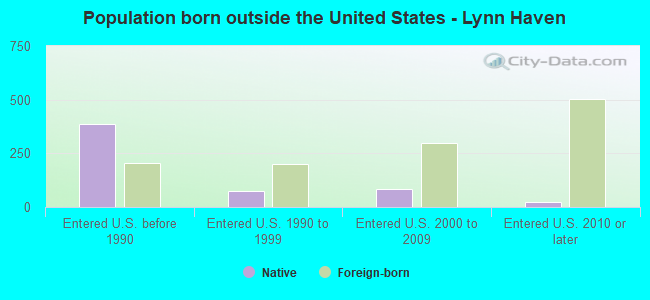
Foreign-born residents in Lynn Haven 1,406 residents are foreign born (2.7% Latin America , 1.7% Asia , 1.4% Europe , 0.8% Africa ).
This city:
7.1%Florida:
21.1%
Marital status for residents in Lynn Haven Marital status - White (Caucasian) population 15 years and over
Males 24.2% Never married68.0% Now married0.5% Separated2.9% Widowed4.4% DivorcedFemales 22.8% Never married52.3% Now married3.1% Separated10.1% Widowed11.8% DivorcedWomen who gave birth in the past 12 months Now married:
95.2% (214)Unmarried:
4.8% (11)
Women who did not give birth in the past 12 months Now married:
54.4% (1,930)Unmarried:
45.6% (1,618)
Marital status - Black or African American population 15 years and over
Males 38.2% Never married54.9% Now married0.0% Separated1.8% Widowed5.1% DivorcedFemales 28.5% Never married41.5% Now married8.1% Separated19.1% Widowed2.8% DivorcedWomen who did not give birth in the past 12 months Now married:
48.7% (192)Unmarried:
51.3% (202)
Marital status - Asian population 15 years and over
Males 49.4% Never married50.6% Now married0.0% Separated0.0% Widowed0.0% DivorcedFemales 0.0% Never married100.0% Now married0.0% Separated0.0% Widowed0.0% DivorcedWomen who did not give birth in the past 12 months Now married:
100.0% (220)Unmarried:
0.0% (0)
Marital status - Other race population 15 years and over
Males 74.6% Never married25.4% Now married0.0% Separated0.0% Widowed0.0% DivorcedFemales 95.3% Never married0.0% Now married0.0% Separated0.0% Widowed4.7% DivorcedWomen who did not give birth in the past 12 months Now married:
0.0% (0)Unmarried:
100.0% (193)
Marital status - Two or more races population 15 years and over
Males 42.5% Never married53.5% Now married4.0% Separated0.0% Widowed0.0% DivorcedFemales 36.2% Never married47.7% Now married0.0% Separated1.3% Widowed14.8% DivorcedWomen who gave birth in the past 12 months Now married:
100.0% (56)Unmarried:
0.0% (0)
Women who did not give birth in the past 12 months Now married:
37.2% (208)Unmarried:
62.8% (352)
Marital status - White alone, not Hispanic / Latino population 15 years and over
Males 23.3% Never married68.8% Now married0.3% Separated3.0% Widowed4.6% DivorcedFemales 22.5% Never married52.7% Now married3.1% Separated9.7% Widowed12.0% DivorcedWomen who gave birth in the past 12 months Now married:
95.2% (219)Unmarried:
4.8% (11)
Women who did not give birth in the past 12 months Now married:
54.7% (1,934)Unmarried:
45.3% (1,604)
Marital status - Hispanic or Latino population 15 years and over
Males 40.2% Never married57.7% Now married2.1% Separated0.0% Widowed0.0% DivorcedFemales 42.6% Never married46.9% Now married0.0% Separated9.2% Widowed1.3% DivorcedWomen who gave birth in the past 12 months Now married:
100.0% (45)Unmarried:
0.0% (0)
Women who did not give birth in the past 12 months Now married:
37.8% (157)Unmarried:
62.2% (258)
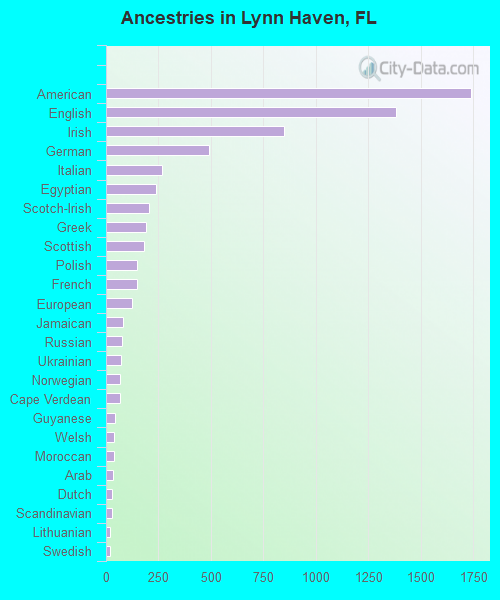
Ancestries in Lynn Haven
1,739 18.0% American1,382 14.3% English850 8.8% Irish492 5.1% German265 2.7% Italian236 2.4% Egyptian206 2.1% Scotch-Irish191 2.0% Greek182 1.9% Scottish148 1.5% Polish146 1.5% French122 1.3% European80 0.8% Jamaican74 0.8% Russian73 0.8% Ukrainian68 0.7% Norwegian68 0.7% Cape Verdean42 0.4% Guyanese38 0.4% Welsh37 0.4% Moroccan33 0.3% Arab30 0.3% Dutch27 0.3% Scandinavian17 0.2% Lithuanian17 0.2% Swedish16 0.2% Portuguese13 0.1% Pennsylvania German12 0.1% British11 0.1% Eastern European8 0.08% Yugoslavian
Geographical mobility in Lynn Haven Same house 1 year ago 12,774 86.0% White (Caucasian)978 64.1% Black or African American11 100.0% American Indian / Alaska Native526 99.8% Asian229 44.9% Other race1,247 51.1% Two or more races12,412 86.0% White alone, not Hispanic / Latino1,017 56.7% Hispanic or LatinoMoved within same county 895 6.0% White / Caucasian147 9.6% Black or African American347 14.2% Two or more races857 5.9% White alone, not Hispanic / Latino64 3.5% Hispanic or LatinoMoved within same state 85 0.6% White / Caucasian75 4.9% Black or African American264 51.7% Other race41 0.3% White alone, not Hispanic / Latino152 8.5% Hispanic or LatinoMoved from different state 1,130 7.6% White / Caucasian353 23.1% Black or African American1,044 42.8% Two or more races1,155 8.0% White alone, not Hispanic / Latino635 35.4% Hispanic or LatinoMoved from abroad 8 0.1% White8 1.5% Asian43 1.8% Two or more races10 0.1% White alone, not Hispanic / Latino25 1.4% Hispanic or Latino
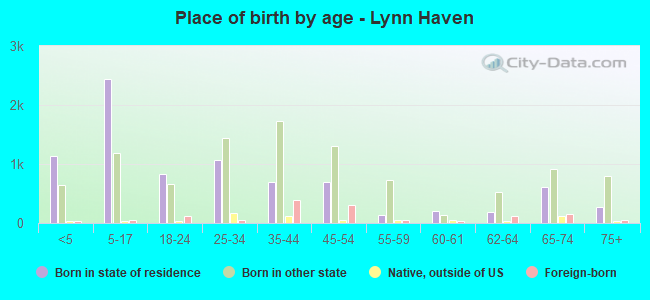
Children Nativity (place of birth) in Lynn Haven
Children under 6 years - Living with two parents Both parents native 1,253 100.0% NativeBoth parents foreign-born 82 100.0% NativeOne native, one foreign-born parent 144 100.0% NativeChildren under 6 years - Living with one parent Native parent 442 100.0% NativeChildren 6 to 17 years - Living with two parents Both parents native 1,768 100.0% NativeBoth parents foreign-born 75 59.5% Native51 40.5% Foreign-bornOne native, one foreign-born parent 258 100.0% NativeChildren 6 to 17 years - Living with one parent Native parent 782 96.2% Native31 3.8% Foreign-bornForeign-born parent 74 76.2% Native23 23.8% Foreign-born
Grandparents responsible for own grandchildren in Lynn Haven
Grandparents (30 to 59 years) White / Caucasian 158 76.5% Responsible for grandchildren49 23.5% Not responsible for grandchildrenTwo or more races 74 100.0% Not responsible for grandchildrenWhite alone, not Hispanic / Latino 171 73.2% Responsible for grandchildren63 26.8% Not responsible for grandchildrenHispanic or Latino 43 100.0% Not responsible for grandchildrenGrandparents (60 years and over) White / Caucasian 171 82.0% Responsible for grandchildren38 18.0% Not responsible for grandchildrenTwo or more races 18 100.0% Not responsible for grandchildrenWhite alone, not Hispanic / Latino 171 92.0% Responsible for grandchildren15 8.0% Not responsible for grandchildrenHispanic or Latino 35 100.0% Not responsible for grandchildren