Races in Lyons, Illinois (IL) Detailed Stats
Data:
Races - White alone (%)
Races - White alone (% change since 2000)
Races - Black alone (%)
Races - Black alone (% change since 2000)
Races - American Indian alone (%)
Races - American Indian alone (% change since 2000)
Races - Asian alone (%)
Races - Asian alone (% change since 2000)
Races - Hispanic (%)
Races - Hispanic (% change since 2000)
Races - Native Hawaiian and Other Pacific Islander alone (%)
Races - Native Hawaiian and Other Pacific Islander alone (% change since 2000)
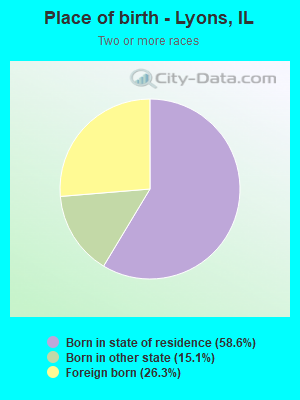
Races - Two or more races(%)
Races - Two or more races(% change since 2000)
Races - Other race alone (%)
Races - Other race alone (% change since 2000)
Racial diversity
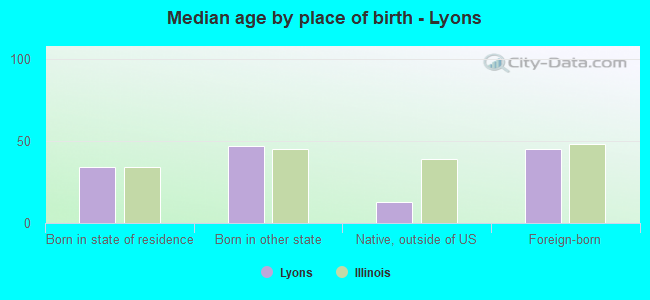
Place of birth - Born in state of residence (%)
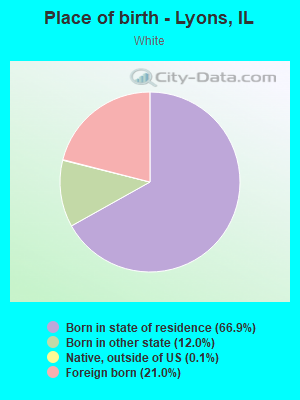
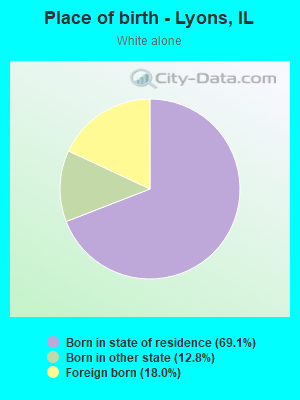
Place of birth - Born in state of residence (%) - White
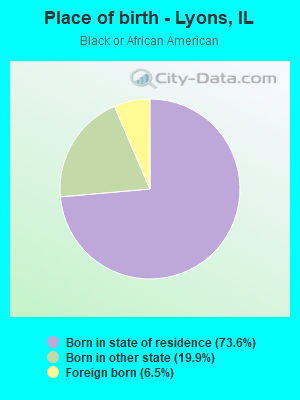
Place of birth - Born in state of residence (%) - Black or African American
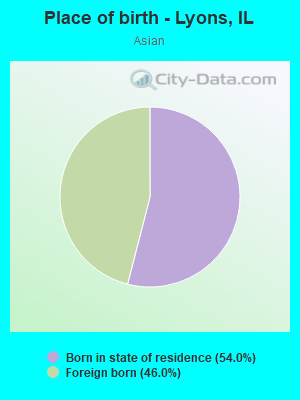
Place of birth - Born in state of residence (%) - Asian
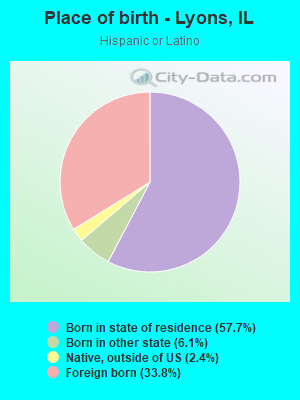
Place of birth - Born in state of residence (%) - Hispanic or Latino
Place of birth - Born in state of residence (%) - American Indian and Alaska Native
Place of birth - Born in state of residence (%) - Multirace
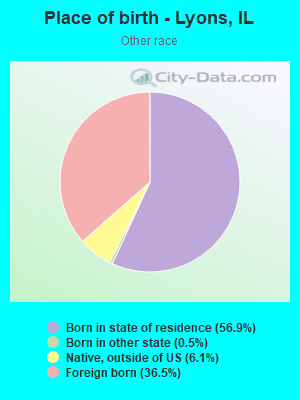
Place of birth - Born in state of residence (%) - Other Race
Place of birth - Born in other state (%)
Place of birth - Born in other state (%) - White
Place of birth - Born in other state (%) - Black or African American
Place of birth - Born in other state (%) - Asian
Place of birth - Born in other state (%) - Hispanic or Latino
Place of birth - Born in other state (%) - American Indian and Alaska Native
Place of birth - Born in other state (%) - Multirace
Place of birth - Born in other state (%) - Other Race
Place of birth - Native, outside of US (%)
Place of birth - Native, outside of US (%) - White
Place of birth - Native, outside of US (%) - Black or African American
Place of birth - Native, outside of US (%) - Asian
Place of birth - Native, outside of US (%) - Hispanic or Latino
Place of birth - Native, outside of US (%) - American Indian and Alaska Native
Place of birth - Native, outside of US (%) - Multirace
Place of birth - Native, outside of US (%) - Other Race
Place of birth - Foreign born (%)
Place of birth - Foreign born (%) - White
Place of birth - Foreign born (%) - Black or African American
Place of birth - Foreign born (%) - Asian
Place of birth - Foreign born (%) - Hispanic or Latino
Place of birth - Foreign born (%) - American Indian and Alaska Native
Place of birth - Foreign born (%) - Multirace
Place of birth - Foreign born (%) - Other Race
Residents speaking English at home (%)
Residents speaking English at home - Born in the United States (%)
Residents speaking English at home - Native, born elsewhere (%)
Residents speaking English at home - Foreign born (%)
Residents speaking Spanish at home (%)
Residents speaking Spanish at home - Born in the United States (%)
Residents speaking Spanish at home - Native, born elsewhere (%)
Residents speaking Spanish at home - Foreign born (%)
Residents speaking other language at home (%)
Residents speaking other language at home - Born in the United States (%)
Residents speaking other language at home - Native, born elsewhere (%)
Residents speaking other language at home - Foreign born (%)
Marital status - Never married (%)
Marital status - Now married (%)
Marital status - Separated (%)
Marital status - Widowed (%)
Marital status - Divorced (%)
Ancestries Reported - Arab (%)
Ancestries Reported - Czech (%)
Ancestries Reported - Danish (%)
Ancestries Reported - Dutch (%)
Ancestries Reported - English (%)
Ancestries Reported - French (%)
Ancestries Reported - French Canadian (%)
Ancestries Reported - German (%)
Ancestries Reported - Greek (%)
Ancestries Reported - Hungarian (%)
Ancestries Reported - Irish (%)
Ancestries Reported - Italian (%)
Ancestries Reported - Lithuanian (%)
Ancestries Reported - Norwegian (%)
Ancestries Reported - Polish (%)
Ancestries Reported - Portuguese (%)
Ancestries Reported - Russian (%)
Ancestries Reported - Scotch-Irish (%)
Ancestries Reported - Scottish (%)
Ancestries Reported - Slovak (%)
Ancestries Reported - Subsaharan African (%)
Ancestries Reported - Swedish (%)
Ancestries Reported - Swiss (%)
Ancestries Reported - Ukrainian (%)
Ancestries Reported - United States (%)
Ancestries Reported - Welsh (%)
Ancestries Reported - West Indian (%)
Ancestries Reported - Other (%)
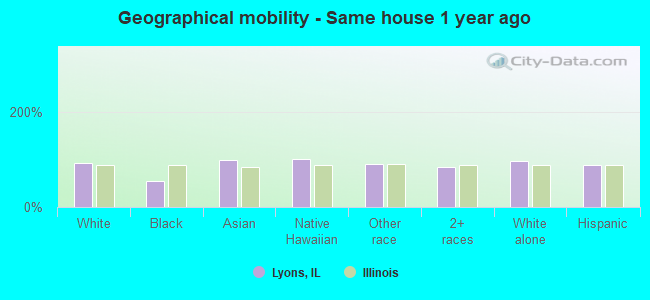
Geographical mobility - Same house 1 year ago (%)
Geographical mobility - Same house 1 year ago (%) - White
Geographical mobility - Same house 1 year ago (%) - Black or African American
Geographical mobility - Same house 1 year ago (%) - Asian
Geographical mobility - Same house 1 year ago (%) - Hispanic or Latino
Geographical mobility - Same house 1 year ago (%) - American Indian and Alaska Native
Geographical mobility - Same house 1 year ago (%) - Multirace
Geographical mobility - Same house 1 year ago (%) - Other Race
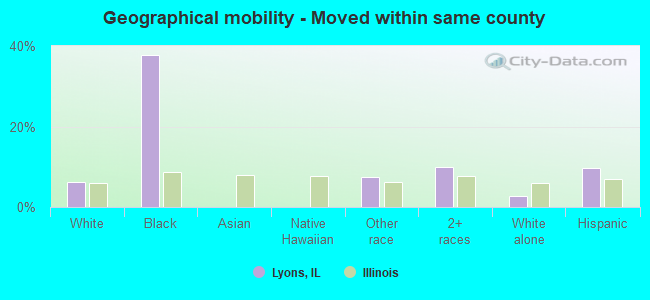
Geographical mobility - Moved within same county (%)
Geographical mobility - Moved within same county (%) - White
Geographical mobility - Moved within same county (%) - Black or African American
Geographical mobility - Moved within same county (%) - Asian
Geographical mobility - Moved within same county (%) - Hispanic or Latino
Geographical mobility - Moved within same county (%) - American Indian and Alaska Native
Geographical mobility - Moved within same county (%) - Multirace
Geographical mobility - Moved within same county (%) - Other Race
Geographical mobility - Moved from different county within same state (%)
Geographical mobility - Moved from different county within same state (%) - White
Geographical mobility - Moved from different county within same state (%) - Black or African American
Geographical mobility - Moved from different county within same state (%) - Asian
Geographical mobility - Moved from different county within same state (%) - Hispanic or Latino
Geographical mobility - Moved from different county within same state (%) - American Indian and Alaska Native
Geographical mobility - Moved from different county within same state (%) - Multirace
Geographical mobility - Moved from different county within same state (%) - Other Race
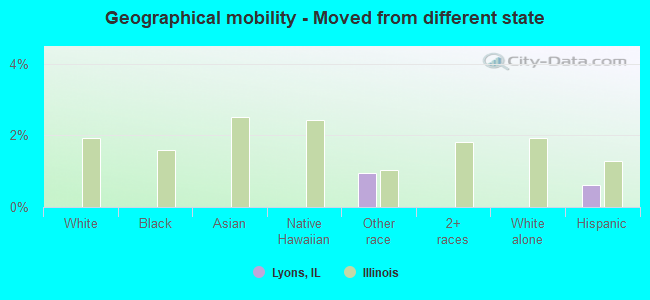
Geographical mobility - Moved from different state (%)
Geographical mobility - Moved from different state (%) - White
Geographical mobility - Moved from different state (%) - Black or African American
Geographical mobility - Moved from different state (%) - Asian
Geographical mobility - Moved from different state (%) - Hispanic or Latino
Geographical mobility - Moved from different state (%) - American Indian and Alaska Native
Geographical mobility - Moved from different state (%) - Multirace
Geographical mobility - Moved from different state (%) - Other Race
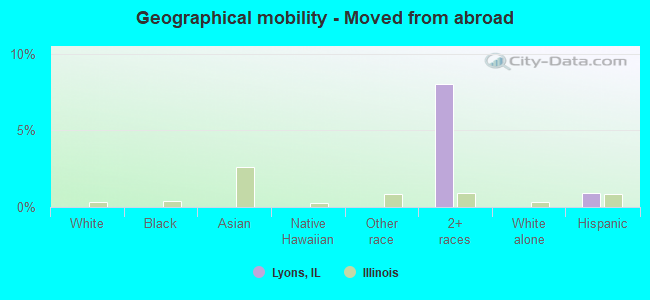
Geographical mobility - Moved from abroad (%)
Geographical mobility - Moved from abroad (%) - White
Geographical mobility - Moved from abroad (%) - Black or African American
Geographical mobility - Moved from abroad (%) - Asian
Geographical mobility - Moved from abroad (%) - Hispanic or Latino
Geographical mobility - Moved from abroad (%) - American Indian and Alaska Native
Geographical mobility - Moved from abroad (%) - Multirace
Geographical mobility - Moved from abroad (%) - Other Race
Place of birth for the foreign-born population - Ireland (%)
Place of birth for the foreign-born population - Denmark (%)
Place of birth for the foreign-born population - Norway (%)
Place of birth for the foreign-born population - Sweden (%)
Place of birth for the foreign-born population - United Kingdom (%)
Place of birth for the foreign-born population - England (%)
Place of birth for the foreign-born population - Scotland (%)
Place of birth for the foreign-born population - Other Northern Europe (%)
Place of birth for the foreign-born population - Austria (%)
Place of birth for the foreign-born population - Belgium (%)
Place of birth for the foreign-born population - France (%)
Place of birth for the foreign-born population - Germany (%)
Place of birth for the foreign-born population - Netherlands (%)
Place of birth for the foreign-born population - Switzerland (%)
Place of birth for the foreign-born population - Other Western Europe (%)
Place of birth for the foreign-born population - Greece (%)
Place of birth for the foreign-born population - Italy (%)
Place of birth for the foreign-born population - Portugal (%)
Place of birth for the foreign-born population - Spain (%)
Place of birth for the foreign-born population - Other Southern Europe (%)
Place of birth for the foreign-born population - Albania (%)
Place of birth for the foreign-born population - Belarus (%)
Place of birth for the foreign-born population - Bosnia and Herzegovina (%)
Place of birth for the foreign-born population - Bulgaria (%)
Place of birth for the foreign-born population - Croatia (%)
Place of birth for the foreign-born population - Czechoslovakia (%)
Place of birth for the foreign-born population - Hungary (%)
Place of birth for the foreign-born population - Latvia (%)
Place of birth for the foreign-born population - Lithuania (%)
Place of birth for the foreign-born population - North Macedonia (Macedonia) (%)
Place of birth for the foreign-born population - Moldova (%)
Place of birth for the foreign-born population - Poland (%)
Place of birth for the foreign-born population - Romania (%)
Place of birth for the foreign-born population - Russia (%)
Place of birth for the foreign-born population - Serbia (%)
Place of birth for the foreign-born population - Ukraine (%)
Place of birth for the foreign-born population - Other Eastern Europe (%)
Place of birth for the foreign-born population - China (%)
Place of birth for the foreign-born population - Hong Kong (%)
Place of birth for the foreign-born population - Taiwan (%)
Place of birth for the foreign-born population - Japan (%)
Place of birth for the foreign-born population - Korea (%)
Place of birth for the foreign-born population - Other Eastern Asia (%)
Place of birth for the foreign-born population - Afghanistan (%)
Place of birth for the foreign-born population - Bangladesh (%)
Place of birth for the foreign-born population - India (%)
Place of birth for the foreign-born population - Iran (%)
Place of birth for the foreign-born population - Kazakhstan (%)
Place of birth for the foreign-born population - Nepal (%)
Place of birth for the foreign-born population - Pakistan (%)
Place of birth for the foreign-born population - Sri Lanka (%)
Place of birth for the foreign-born population - Uzbekistan (%)
Place of birth for the foreign-born population - Other South Central Asia (%)
Place of birth for the foreign-born population - Burma (%)
Place of birth for the foreign-born population - Cambodia (%)
Place of birth for the foreign-born population - Indonesia (%)
Place of birth for the foreign-born population - Laos (%)
Place of birth for the foreign-born population - Malaysia (%)
Place of birth for the foreign-born population - Philippines (%)
Place of birth for the foreign-born population - Singapore (%)
Place of birth for the foreign-born population - Thailand (%)
Place of birth for the foreign-born population - Vietnam (%)
Place of birth for the foreign-born population - Other South Eastern Asia (%)
Place of birth for the foreign-born population - Armenia (%)
Place of birth for the foreign-born population - Iraq (%)
Place of birth for the foreign-born population - Israel (%)
Place of birth for the foreign-born population - Jordan (%)
Place of birth for the foreign-born population - Kuwait (%)
Place of birth for the foreign-born population - Lebanon (%)
Place of birth for the foreign-born population - Saudi Arabia (%)
Place of birth for the foreign-born population - Syria (%)
Place of birth for the foreign-born population - Turkey (%)
Place of birth for the foreign-born population - Yemen (%)
Place of birth for the foreign-born population - Other Western Asia (%)
Place of birth for the foreign-born population - Eritrea (%)
Place of birth for the foreign-born population - Ethiopia (%)
Place of birth for the foreign-born population - Kenya (%)
Place of birth for the foreign-born population - Somalia (%)
Place of birth for the foreign-born population - Uganda (%)
Place of birth for the foreign-born population - Zimbabwe (%)
Place of birth for the foreign-born population - Other Eastern Africa (%)
Place of birth for the foreign-born population - Cameroon (%)
Place of birth for the foreign-born population - Congo (%)
Place of birth for the foreign-born population - Democratic Republic of Congo (Zaire) (%)
Place of birth for the foreign-born population - Other Middle Africa (%)
Place of birth for the foreign-born population - Egypt (%)
Place of birth for the foreign-born population - Morocco (%)
Place of birth for the foreign-born population - Sudan (%)
Place of birth for the foreign-born population - Other Northern Africa (%)
Place of birth for the foreign-born population - South Africa (%)
Place of birth for the foreign-born population - Other Southern Africa (%)
Place of birth for the foreign-born population - Cabo Verde (%)
Place of birth for the foreign-born population - Ghana (%)
Place of birth for the foreign-born population - Liberia (%)
Place of birth for the foreign-born population - Nigeria (%)
Place of birth for the foreign-born population - Senegal (%)
Place of birth for the foreign-born population - Sierra Leone (%)
Place of birth for the foreign-born population - Other Western Africa (%)
Place of birth for the foreign-born population - Australia (%)
Place of birth for the foreign-born population - New Zealand (%)
Place of birth for the foreign-born population - Fiji (%)
Place of birth for the foreign-born population - Micronesia (%)
Place of birth for the foreign-born population - Bahamas (%)
Place of birth for the foreign-born population - Barbados (%)
Place of birth for the foreign-born population - Cuba (%)
Place of birth for the foreign-born population - Dominica (%)
Place of birth for the foreign-born population - Dominican Republic (%)
Place of birth for the foreign-born population - Grenada (%)
Place of birth for the foreign-born population - Haiti (%)
Place of birth for the foreign-born population - Jamaica (%)
Place of birth for the foreign-born population - St. Vincent and the Grenadines (%)
Place of birth for the foreign-born population - Trinidad and Tobago (%)
Place of birth for the foreign-born population - West Indies (%)
Place of birth for the foreign-born population - Other Caribbean (%)
Place of birth for the foreign-born population - Belize (%)
Place of birth for the foreign-born population - Costa Rica (%)
Place of birth for the foreign-born population - El Salvador (%)
Place of birth for the foreign-born population - Guatemala (%)
Place of birth for the foreign-born population - Honduras (%)
Place of birth for the foreign-born population - Mexico (%)
Place of birth for the foreign-born population - Nicaragua (%)
Place of birth for the foreign-born population - Panama (%)
Place of birth for the foreign-born population - Other Central America (%)
Place of birth for the foreign-born population - Argentina (%)
Place of birth for the foreign-born population - Bolivia (%)
Place of birth for the foreign-born population - Brazil (%)
Place of birth for the foreign-born population - Chile (%)
Place of birth for the foreign-born population - Colombia (%)
Place of birth for the foreign-born population - Ecuador (%)
Place of birth for the foreign-born population - Guyana (%)
Place of birth for the foreign-born population - Peru (%)
Place of birth for the foreign-born population - Uruguay (%)
Place of birth for the foreign-born population - Venezuela (%)
Place of birth for the foreign-born population - Other South America (%)
Place of birth for the foreign-born population - Canada (%)
Place of birth for the foreign-born population - Other Northern America (%)
Place of birth for the foreign-born population - Other (%)
Latest news about races in Lyons, IL collected exclusively by city-data.com from local newspapers, TV, and radio stations
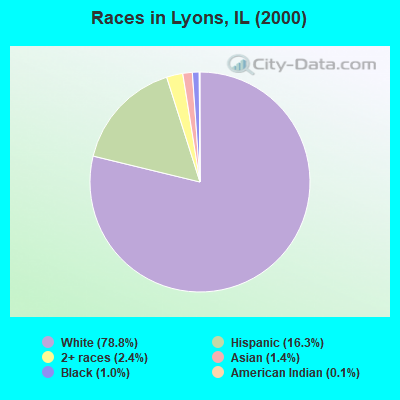
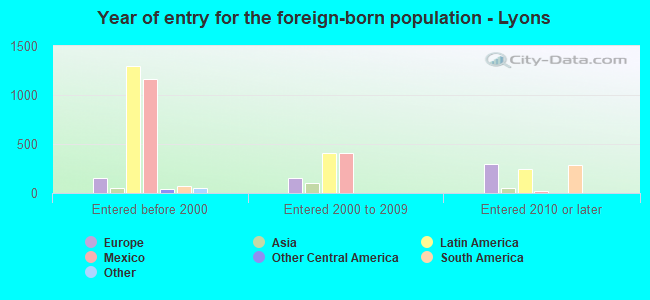
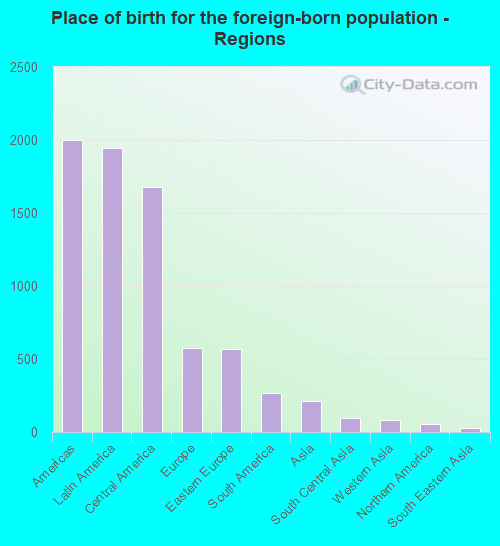
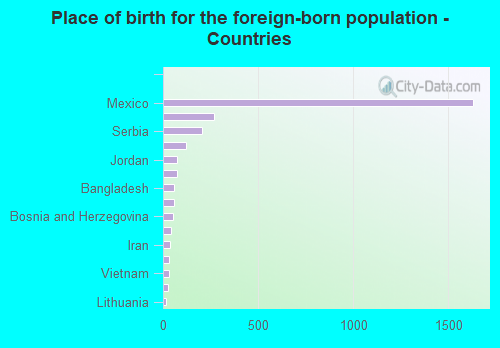
According to 2022 data, the most numerous races in Lyons, IL are White alone (4,115 residents), Hispanic (5,819 residents), and Black alone (313 residents). 49.5% of Lyons residents speak English at home. 26.7% of Lyons, IL residents are foreign-born (18.3% born in Latin America, 5.4% born in Europe), which is 47.6% greater than the foreign-born rate of 14.0% across the entire state of Illinois.
Race distribution in Lyons
2000 2022
8,424,140 67.8% White alone 1,856,152 14.9% Black alone 1,530,262 12.3% Hispanic 419,916 3.4% Asian alone 153,996 1.2% Two or more races 13,479 0.1% Other race alone 18,232 0.1% American Indian alone 3,116 0.03% Native Hawaiian and Other
7,356,301 58.5% White alone 2,299,726 18.3% Hispanic 1,660,423 13.2% Black alone 747,296 5.9% Asian alone 458,599 3.6% Two or more races 45,386 0.4% Other race alone 10,405 0.08% American Indian alone 3,896 0.03% Native Hawaiian and Other
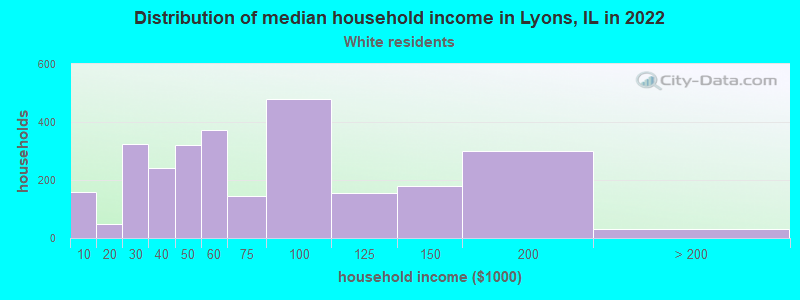
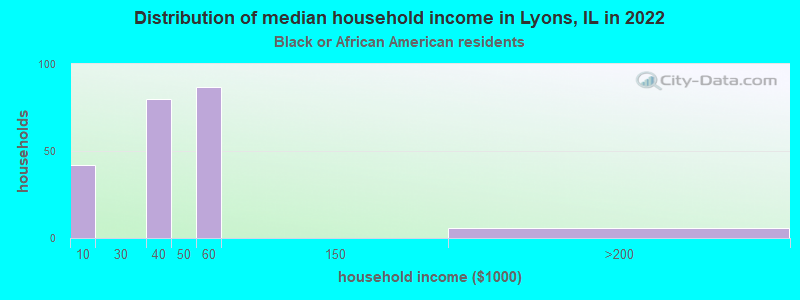
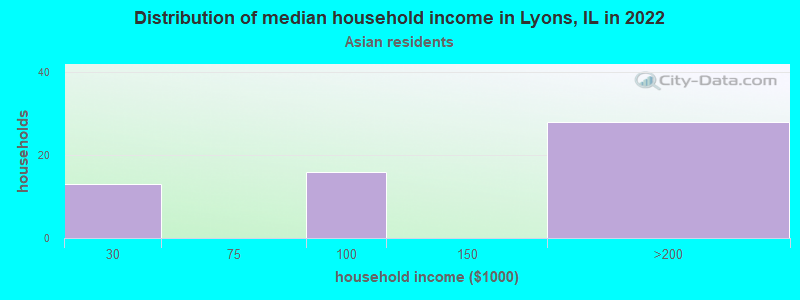
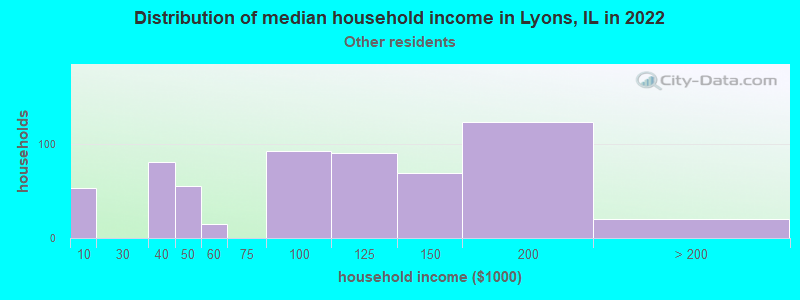
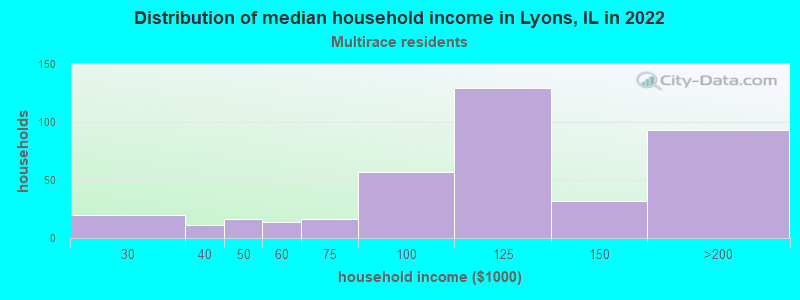
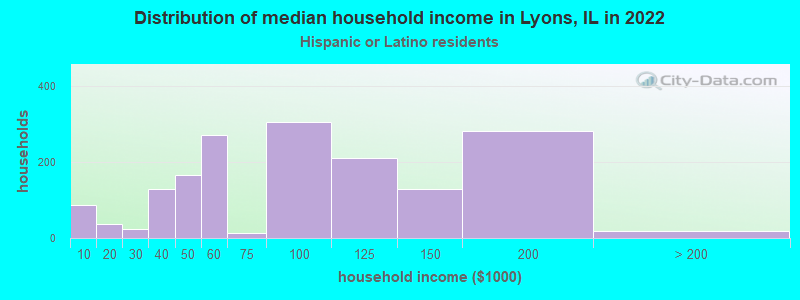
Income and house value in Lyons Median household income in 2022 $55,618 White non-Hispanic householders$37,675 Black householders$101,595 Some other race householders$99,717 Two or more races householders$84,113 Hispanic or Latino race householdersMedian 2022 house value $220,809 White Non-Hispanic householders$285,453 American Indian or Alaska Native householders$241,537 Some other race householders$289,493 Two or more races householders$248,388 Hispanic or Latino householders
Median age by race in Lyons
45.8 Median age for White residents44.5 46.7 37.3 Median age for Black or African American residents52.8 25.9 -680,473,372.1 Median age for American Indian / Alaska Native residents-736,736,736.0 -641,399,416.3 13.1 Median age for Asian residents12.9 32.4 -687,999,999.3 Median age for Native Hawaiian / Pacific Islander residents-918,721,460.3 -610,229,276.3 32.5 Median age for Other race residents35.5 32.2 39.3 Median age for Two or more races residents29.9 48.8 53.8 Median age for White alone residents52.3 57.6 30.8 Median age for Hispanic or Latino residents29.7 32.4
Owner/renter occupied households by race in Lyons
House owners and renters - White residents 1,757 62.8% Owner occupied1,039 37.2% Renter occupiedHouse owners and renters - Black or African American residents 34 15.5% Owner occupied188 84.5% Renter occupiedHouse owners and renters - Asian residents 46 79.8% Owner occupied12 20.2% Renter occupiedHouse owners and renters - Other race residents 517 86.1% Owner occupied83 13.9% Renter occupiedHouse owners and renters - Two or more races residents 335 82.9% Owner occupied69 17.1% Renter occupiedHouse owners and renters - White alone residents 1,389 63.3% Owner occupied806 36.7% Renter occupiedHouse owners and renters - Hispanic or Latino residents 1,182 72.0% Owner occupied459 28.0% Renter occupied
Language usage in Lyons
English speakers - Total 49.5% of residents of Lyons speak English at home.
40.7% of residents speak Spanish at home 2,289 58.4% Speak English very well1,629 41.6% Speak English less than very well9.9% of residents speak other language at home 448 47.0% Speak English very well506 53.0% Speak English less than very well
English speakers - Born in the United States 79.7% of residents of Lyons speak English at home.
17.7% of residents speak Spanish at home 157 100.0% Speak English very well1.5% of residents speak other language at home 13 100.0% Speak English very well
English speakers - Native, born elsewhere 76.0% of residents of Lyons speak English at home.
23.1% of residents speak Spanish at home 10 35.7% Speak English very well18 64.3% Speak English less than very well
English speakers - Foreign-born 4.9% of residents of Lyons speak English at home.
69.1% of residents speak Spanish at home 556 28.8% Speak English very well1,373 71.2% Speak English less than very well26.7% of residents speak other language at home 243 32.6% Speak English very well503 67.4% Speak English less than very well
White (Caucasian) - Speak only English Native:
80.3% (3,413)Foreign-born:
9.5% (119)
White (Caucasian) - Speak another language Native:
17.2% (732)Foreign-born:
90.1% (1,125)
Asian - Speak another language Native:
21.2% (24)Foreign-born:
100.0% (93)
Other race - Speak another language Native:
71.9% (1,037)Foreign-born:
100.0% (997)
Two or more races - Speak another language Native:
40.2% (274)Foreign-born:
100.0% (254)
White alone - Speak only English Native:
93.1% (2,782)Foreign-born:
15.3% (114)
White alone - Speak another language Native:
6.7% (202)Foreign-born:
84.6% (628)
Hispanic or Latino - Speak only English Native:
43.3% (1,495)Foreign-born:
0.9% (18)
Hispanic or Latino - Speak another language Native:
57.3% (1,978)Foreign-born:
99.5% (1,956)
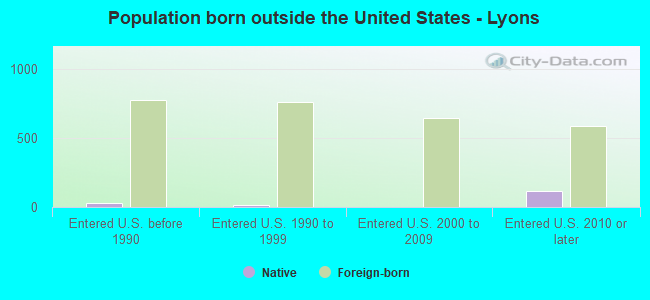
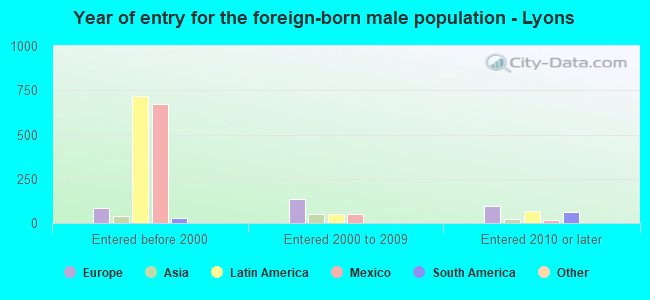
Foreign-born residents in Lyons 2,793 residents are foreign born (18.3% Latin America , 5.4% Europe ).
This city:
26.7%Illinois:
14.1%
Marital status for residents in Lyons Marital status - White (Caucasian) population 15 years and over
Males 37.8% Never married47.5% Now married3.1% Separated2.2% Widowed9.5% DivorcedFemales 36.9% Never married43.7% Now married0.0% Separated8.9% Widowed10.6% DivorcedWomen who gave birth in the past 12 months Now married:
100.0% (50)Unmarried:
0.0% (0)
Women who did not give birth in the past 12 months Now married:
43.8% (532)Unmarried:
56.2% (684)
Marital status - Black or African American population 15 years and over
Males 41.9% Never married26.4% Now married0.0% Separated24.0% Widowed7.7% DivorcedFemales 88.2% Never married7.5% Now married0.0% Separated0.0% Widowed4.3% DivorcedWomen who did not give birth in the past 12 months Now married:
8.6% (7)Unmarried:
91.4% (70)
Marital status - Asian population 15 years and over
Males 0.0% Never married100.0% Now married0.0% Separated0.0% Widowed0.0% DivorcedFemales 0.0% Never married100.0% Now married0.0% Separated0.0% Widowed0.0% DivorcedWomen who did not give birth in the past 12 months Now married:
100.0% (51)Unmarried:
0.0% (0)
Marital status - Other race population 15 years and over
Males 22.4% Never married70.3% Now married4.5% Separated0.0% Widowed2.8% DivorcedFemales 29.9% Never married44.3% Now married2.7% Separated23.2% Widowed0.0% DivorcedWomen who gave birth in the past 12 months Now married:
100.0% (15)Unmarried:
0.0% (0)
Women who did not give birth in the past 12 months Now married:
57.0% (434)Unmarried:
43.0% (328)
Marital status - Two or more races population 15 years and over
Males 29.5% Never married62.9% Now married0.0% Separated7.6% Widowed0.0% DivorcedFemales 20.7% Never married39.8% Now married4.2% Separated0.0% Widowed35.2% DivorcedWomen who gave birth in the past 12 months Now married:
0.0% (0)Unmarried:
100.0% (53)
Women who did not give birth in the past 12 months Now married:
65.4% (141)Unmarried:
34.6% (75)
Marital status - White alone, not Hispanic / Latino population 15 years and over
Males 37.5% Never married45.0% Now married3.1% Separated2.9% Widowed11.5% DivorcedFemales 22.0% Never married47.3% Now married0.0% Separated14.8% Widowed16.0% DivorcedWomen who gave birth in the past 12 months Now married:
100.0% (56)Unmarried:
0.0% (0)
Women who did not give birth in the past 12 months Now married:
47.8% (259)Unmarried:
52.2% (283)
Marital status - Hispanic or Latino population 15 years and over
Males 31.9% Never married61.2% Now married2.9% Separated1.4% Widowed2.6% DivorcedFemales 42.6% Never married41.3% Now married1.1% Separated9.8% Widowed5.2% DivorcedWomen who gave birth in the past 12 months Now married:
25.5% (13)Unmarried:
74.5% (38)
Women who did not give birth in the past 12 months Now married:
49.3% (830)Unmarried:
50.7% (853)
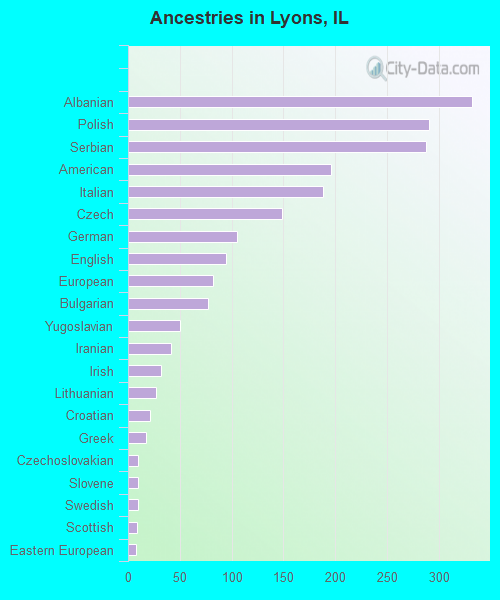
Ancestries in Lyons
332 5.9% Albanian291 5.2% Polish288 5.1% Serbian196 3.5% American188 3.4% Italian149 2.7% Czech105 1.9% German95 1.7% English82 1.5% European77 1.4% Bulgarian50 0.9% Yugoslavian42 0.7% Iranian32 0.6% Irish27 0.5% Lithuanian21 0.4% Croatian17 0.3% Greek10 0.2% Czechoslovakian10 0.2% Slovene10 0.2% Swedish9 0.2% Scottish8 0.1% Eastern European2 0.04% British1 0.02% Egyptian
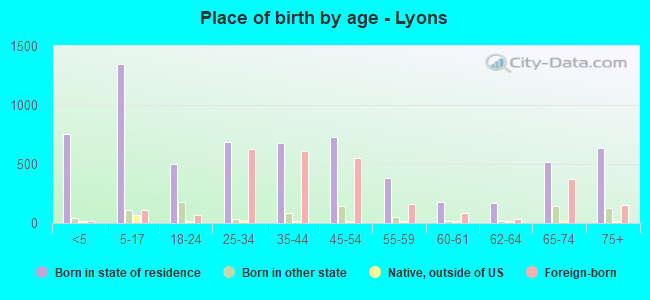
Children Nativity (place of birth) in Lyons
Children under 6 years - Living with two parents Both parents native 202 100.0% NativeBoth parents foreign-born 52 100.0% NativeOne native, one foreign-born parent 225 100.0% NativeChildren under 6 years - Living with one parent Native parent 542 100.0% NativeForeign-born parent 79 100.0% NativeChildren 6 to 17 years - Living with two parents Both parents native 104 100.0% NativeBoth parents foreign-born 260 86.5% Native41 13.5% Foreign-bornOne native, one foreign-born parent 352 100.0% NativeChildren 6 to 17 years - Living with one parent Native parent 136 100.0% NativeForeign-born parent 371 55.7% Native295 44.3% Foreign-born
Grandparents responsible for own grandchildren in Lyons
Grandparents (30 to 59 years) White / Caucasian 5 100.0% Responsible for grandchildrenBlack or African American 3 100.0% Not responsible for grandchildrenOther race 265 100.0% Not responsible for grandchildrenTwo or more races 37 100.0% Responsible for grandchildrenHispanic or Latino 40 15.6% Responsible for grandchildren217 84.4% Not responsible for grandchildrenGrandparents (60 years and over) White / Caucasian 4 2.7% Responsible for grandchildren133 97.3% Not responsible for grandchildrenOther race 4 100.0% Not responsible for grandchildrenHispanic or Latino 6 15.7% Responsible for grandchildren34 84.3% Not responsible for grandchildren