Races in Machesney Park, Illinois (IL) Detailed Stats
Data:
Races - White alone (%)
Races - White alone (% change since 2000)
Races - Black alone (%)
Races - Black alone (% change since 2000)
Races - American Indian alone (%)
Races - American Indian alone (% change since 2000)
Races - Asian alone (%)
Races - Asian alone (% change since 2000)
Races - Hispanic (%)
Races - Hispanic (% change since 2000)
Races - Native Hawaiian and Other Pacific Islander alone (%)
Races - Native Hawaiian and Other Pacific Islander alone (% change since 2000)
Races - Two or more races(%)
Races - Two or more races(% change since 2000)
Races - Other race alone (%)
Races - Other race alone (% change since 2000)
Racial diversity
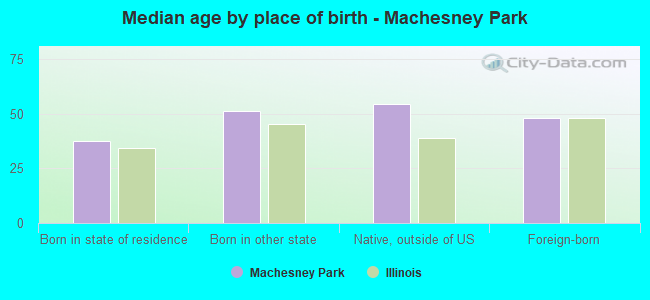
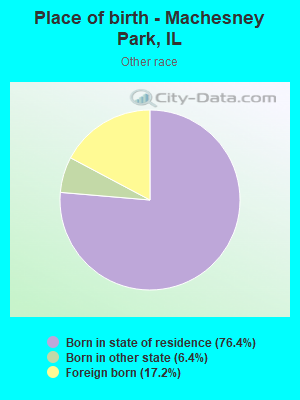
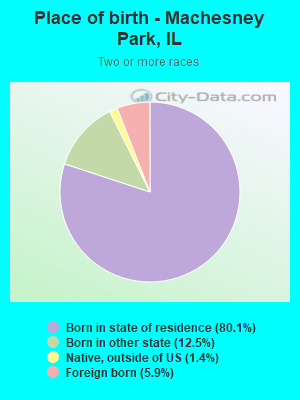
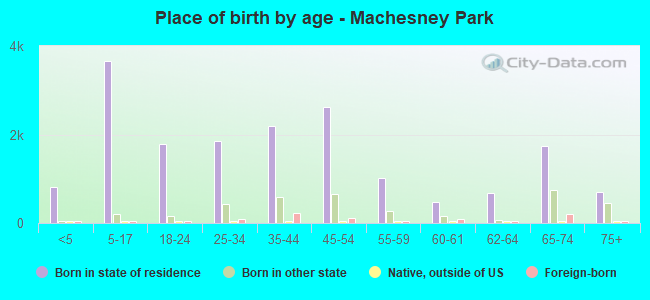
Place of birth - Born in state of residence (%)
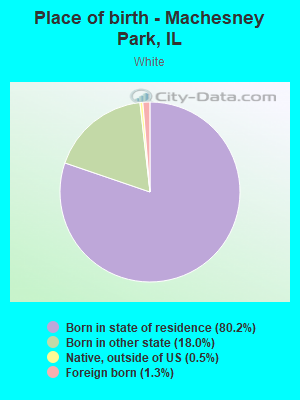
Place of birth - Born in state of residence (%) - White
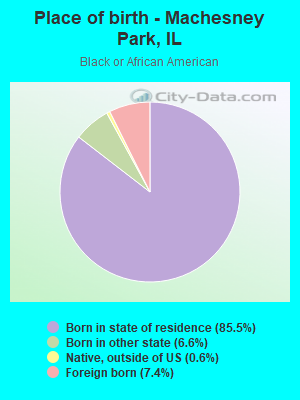
Place of birth - Born in state of residence (%) - Black or African American
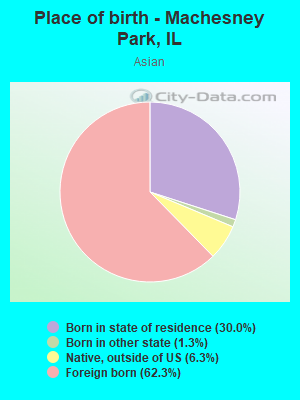
Place of birth - Born in state of residence (%) - Asian
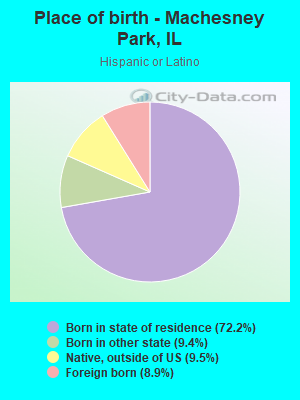
Place of birth - Born in state of residence (%) - Hispanic or Latino
Place of birth - Born in state of residence (%) - American Indian and Alaska Native
Place of birth - Born in state of residence (%) - Multirace
Place of birth - Born in state of residence (%) - Other Race
Place of birth - Born in other state (%)
Place of birth - Born in other state (%) - White
Place of birth - Born in other state (%) - Black or African American
Place of birth - Born in other state (%) - Asian
Place of birth - Born in other state (%) - Hispanic or Latino
Place of birth - Born in other state (%) - American Indian and Alaska Native
Place of birth - Born in other state (%) - Multirace
Place of birth - Born in other state (%) - Other Race
Place of birth - Native, outside of US (%)
Place of birth - Native, outside of US (%) - White
Place of birth - Native, outside of US (%) - Black or African American
Place of birth - Native, outside of US (%) - Asian
Place of birth - Native, outside of US (%) - Hispanic or Latino
Place of birth - Native, outside of US (%) - American Indian and Alaska Native
Place of birth - Native, outside of US (%) - Multirace
Place of birth - Native, outside of US (%) - Other Race
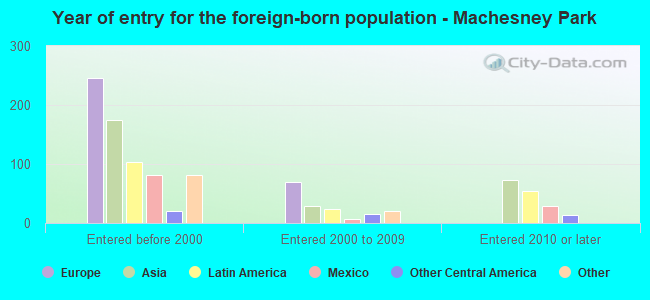
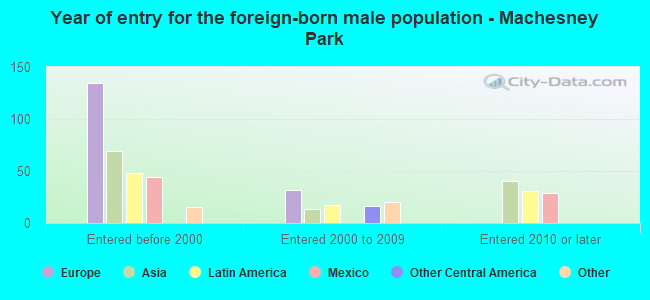
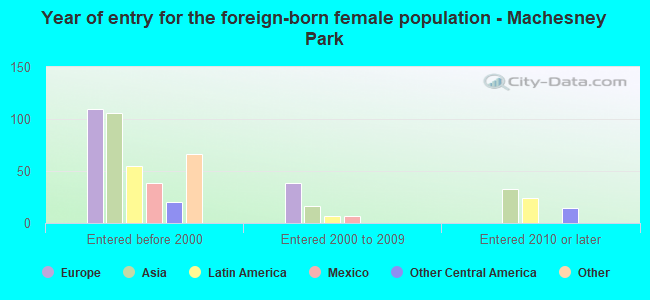
Place of birth - Foreign born (%)
Place of birth - Foreign born (%) - White
Place of birth - Foreign born (%) - Black or African American
Place of birth - Foreign born (%) - Asian
Place of birth - Foreign born (%) - Hispanic or Latino
Place of birth - Foreign born (%) - American Indian and Alaska Native
Place of birth - Foreign born (%) - Multirace
Place of birth - Foreign born (%) - Other Race
Residents speaking English at home (%)
Residents speaking English at home - Born in the United States (%)
Residents speaking English at home - Native, born elsewhere (%)
Residents speaking English at home - Foreign born (%)
Residents speaking Spanish at home (%)
Residents speaking Spanish at home - Born in the United States (%)
Residents speaking Spanish at home - Native, born elsewhere (%)
Residents speaking Spanish at home - Foreign born (%)
Residents speaking other language at home (%)
Residents speaking other language at home - Born in the United States (%)
Residents speaking other language at home - Native, born elsewhere (%)
Residents speaking other language at home - Foreign born (%)
Marital status - Never married (%)
Marital status - Now married (%)
Marital status - Separated (%)
Marital status - Widowed (%)
Marital status - Divorced (%)
Ancestries Reported - Arab (%)
Ancestries Reported - Czech (%)
Ancestries Reported - Danish (%)
Ancestries Reported - Dutch (%)
Ancestries Reported - English (%)
Ancestries Reported - French (%)
Ancestries Reported - French Canadian (%)
Ancestries Reported - German (%)
Ancestries Reported - Greek (%)
Ancestries Reported - Hungarian (%)
Ancestries Reported - Irish (%)
Ancestries Reported - Italian (%)
Ancestries Reported - Lithuanian (%)
Ancestries Reported - Norwegian (%)
Ancestries Reported - Polish (%)
Ancestries Reported - Portuguese (%)
Ancestries Reported - Russian (%)
Ancestries Reported - Scotch-Irish (%)
Ancestries Reported - Scottish (%)
Ancestries Reported - Slovak (%)
Ancestries Reported - Subsaharan African (%)
Ancestries Reported - Swedish (%)
Ancestries Reported - Swiss (%)
Ancestries Reported - Ukrainian (%)
Ancestries Reported - United States (%)
Ancestries Reported - Welsh (%)
Ancestries Reported - West Indian (%)
Ancestries Reported - Other (%)
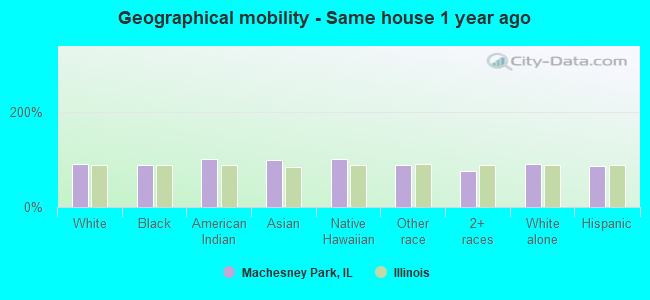
Geographical mobility - Same house 1 year ago (%)
Geographical mobility - Same house 1 year ago (%) - White
Geographical mobility - Same house 1 year ago (%) - Black or African American
Geographical mobility - Same house 1 year ago (%) - Asian
Geographical mobility - Same house 1 year ago (%) - Hispanic or Latino
Geographical mobility - Same house 1 year ago (%) - American Indian and Alaska Native
Geographical mobility - Same house 1 year ago (%) - Multirace
Geographical mobility - Same house 1 year ago (%) - Other Race
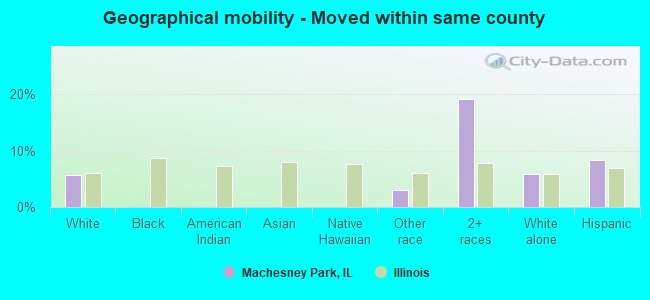
Geographical mobility - Moved within same county (%)
Geographical mobility - Moved within same county (%) - White
Geographical mobility - Moved within same county (%) - Black or African American
Geographical mobility - Moved within same county (%) - Asian
Geographical mobility - Moved within same county (%) - Hispanic or Latino
Geographical mobility - Moved within same county (%) - American Indian and Alaska Native
Geographical mobility - Moved within same county (%) - Multirace
Geographical mobility - Moved within same county (%) - Other Race
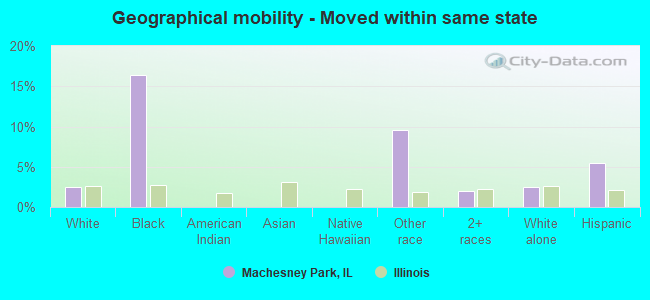
Geographical mobility - Moved from different county within same state (%)
Geographical mobility - Moved from different county within same state (%) - White
Geographical mobility - Moved from different county within same state (%) - Black or African American
Geographical mobility - Moved from different county within same state (%) - Asian
Geographical mobility - Moved from different county within same state (%) - Hispanic or Latino
Geographical mobility - Moved from different county within same state (%) - American Indian and Alaska Native
Geographical mobility - Moved from different county within same state (%) - Multirace
Geographical mobility - Moved from different county within same state (%) - Other Race
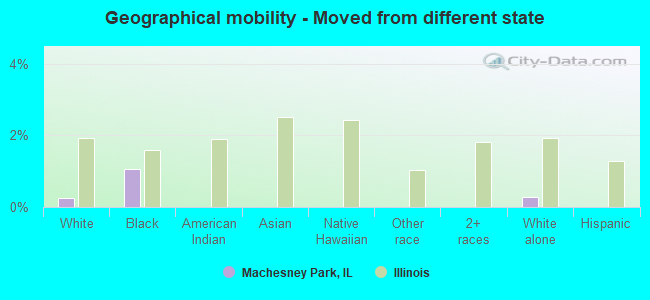
Geographical mobility - Moved from different state (%)
Geographical mobility - Moved from different state (%) - White
Geographical mobility - Moved from different state (%) - Black or African American
Geographical mobility - Moved from different state (%) - Asian
Geographical mobility - Moved from different state (%) - Hispanic or Latino
Geographical mobility - Moved from different state (%) - American Indian and Alaska Native
Geographical mobility - Moved from different state (%) - Multirace
Geographical mobility - Moved from different state (%) - Other Race
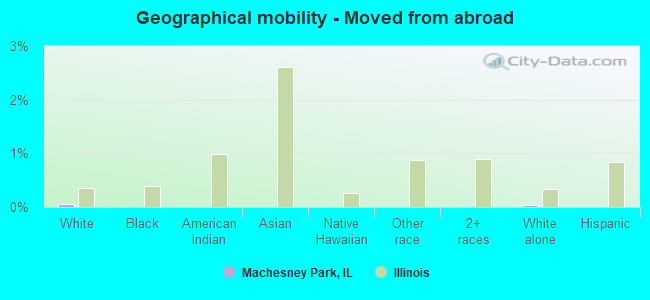
Geographical mobility - Moved from abroad (%)
Geographical mobility - Moved from abroad (%) - White
Geographical mobility - Moved from abroad (%) - Black or African American
Geographical mobility - Moved from abroad (%) - Asian
Geographical mobility - Moved from abroad (%) - Hispanic or Latino
Geographical mobility - Moved from abroad (%) - American Indian and Alaska Native
Geographical mobility - Moved from abroad (%) - Multirace
Geographical mobility - Moved from abroad (%) - Other Race
Place of birth for the foreign-born population - Ireland (%)
Place of birth for the foreign-born population - Denmark (%)
Place of birth for the foreign-born population - Norway (%)
Place of birth for the foreign-born population - Sweden (%)
Place of birth for the foreign-born population - United Kingdom (%)
Place of birth for the foreign-born population - England (%)
Place of birth for the foreign-born population - Scotland (%)
Place of birth for the foreign-born population - Other Northern Europe (%)
Place of birth for the foreign-born population - Austria (%)
Place of birth for the foreign-born population - Belgium (%)
Place of birth for the foreign-born population - France (%)
Place of birth for the foreign-born population - Germany (%)
Place of birth for the foreign-born population - Netherlands (%)
Place of birth for the foreign-born population - Switzerland (%)
Place of birth for the foreign-born population - Other Western Europe (%)
Place of birth for the foreign-born population - Greece (%)
Place of birth for the foreign-born population - Italy (%)
Place of birth for the foreign-born population - Portugal (%)
Place of birth for the foreign-born population - Spain (%)
Place of birth for the foreign-born population - Other Southern Europe (%)
Place of birth for the foreign-born population - Albania (%)
Place of birth for the foreign-born population - Belarus (%)
Place of birth for the foreign-born population - Bosnia and Herzegovina (%)
Place of birth for the foreign-born population - Bulgaria (%)
Place of birth for the foreign-born population - Croatia (%)
Place of birth for the foreign-born population - Czechoslovakia (%)
Place of birth for the foreign-born population - Hungary (%)
Place of birth for the foreign-born population - Latvia (%)
Place of birth for the foreign-born population - Lithuania (%)
Place of birth for the foreign-born population - North Macedonia (Macedonia) (%)
Place of birth for the foreign-born population - Moldova (%)
Place of birth for the foreign-born population - Poland (%)
Place of birth for the foreign-born population - Romania (%)
Place of birth for the foreign-born population - Russia (%)
Place of birth for the foreign-born population - Serbia (%)
Place of birth for the foreign-born population - Ukraine (%)
Place of birth for the foreign-born population - Other Eastern Europe (%)
Place of birth for the foreign-born population - China (%)
Place of birth for the foreign-born population - Hong Kong (%)
Place of birth for the foreign-born population - Taiwan (%)
Place of birth for the foreign-born population - Japan (%)
Place of birth for the foreign-born population - Korea (%)
Place of birth for the foreign-born population - Other Eastern Asia (%)
Place of birth for the foreign-born population - Afghanistan (%)
Place of birth for the foreign-born population - Bangladesh (%)
Place of birth for the foreign-born population - India (%)
Place of birth for the foreign-born population - Iran (%)
Place of birth for the foreign-born population - Kazakhstan (%)
Place of birth for the foreign-born population - Nepal (%)
Place of birth for the foreign-born population - Pakistan (%)
Place of birth for the foreign-born population - Sri Lanka (%)
Place of birth for the foreign-born population - Uzbekistan (%)
Place of birth for the foreign-born population - Other South Central Asia (%)
Place of birth for the foreign-born population - Burma (%)
Place of birth for the foreign-born population - Cambodia (%)
Place of birth for the foreign-born population - Indonesia (%)
Place of birth for the foreign-born population - Laos (%)
Place of birth for the foreign-born population - Malaysia (%)
Place of birth for the foreign-born population - Philippines (%)
Place of birth for the foreign-born population - Singapore (%)
Place of birth for the foreign-born population - Thailand (%)
Place of birth for the foreign-born population - Vietnam (%)
Place of birth for the foreign-born population - Other South Eastern Asia (%)
Place of birth for the foreign-born population - Armenia (%)
Place of birth for the foreign-born population - Iraq (%)
Place of birth for the foreign-born population - Israel (%)
Place of birth for the foreign-born population - Jordan (%)
Place of birth for the foreign-born population - Kuwait (%)
Place of birth for the foreign-born population - Lebanon (%)
Place of birth for the foreign-born population - Saudi Arabia (%)
Place of birth for the foreign-born population - Syria (%)
Place of birth for the foreign-born population - Turkey (%)
Place of birth for the foreign-born population - Yemen (%)
Place of birth for the foreign-born population - Other Western Asia (%)
Place of birth for the foreign-born population - Eritrea (%)
Place of birth for the foreign-born population - Ethiopia (%)
Place of birth for the foreign-born population - Kenya (%)
Place of birth for the foreign-born population - Somalia (%)
Place of birth for the foreign-born population - Uganda (%)
Place of birth for the foreign-born population - Zimbabwe (%)
Place of birth for the foreign-born population - Other Eastern Africa (%)
Place of birth for the foreign-born population - Cameroon (%)
Place of birth for the foreign-born population - Congo (%)
Place of birth for the foreign-born population - Democratic Republic of Congo (Zaire) (%)
Place of birth for the foreign-born population - Other Middle Africa (%)
Place of birth for the foreign-born population - Egypt (%)
Place of birth for the foreign-born population - Morocco (%)
Place of birth for the foreign-born population - Sudan (%)
Place of birth for the foreign-born population - Other Northern Africa (%)
Place of birth for the foreign-born population - South Africa (%)
Place of birth for the foreign-born population - Other Southern Africa (%)
Place of birth for the foreign-born population - Cabo Verde (%)
Place of birth for the foreign-born population - Ghana (%)
Place of birth for the foreign-born population - Liberia (%)
Place of birth for the foreign-born population - Nigeria (%)
Place of birth for the foreign-born population - Senegal (%)
Place of birth for the foreign-born population - Sierra Leone (%)
Place of birth for the foreign-born population - Other Western Africa (%)
Place of birth for the foreign-born population - Australia (%)
Place of birth for the foreign-born population - New Zealand (%)
Place of birth for the foreign-born population - Fiji (%)
Place of birth for the foreign-born population - Micronesia (%)
Place of birth for the foreign-born population - Bahamas (%)
Place of birth for the foreign-born population - Barbados (%)
Place of birth for the foreign-born population - Cuba (%)
Place of birth for the foreign-born population - Dominica (%)
Place of birth for the foreign-born population - Dominican Republic (%)
Place of birth for the foreign-born population - Grenada (%)
Place of birth for the foreign-born population - Haiti (%)
Place of birth for the foreign-born population - Jamaica (%)
Place of birth for the foreign-born population - St. Vincent and the Grenadines (%)
Place of birth for the foreign-born population - Trinidad and Tobago (%)
Place of birth for the foreign-born population - West Indies (%)
Place of birth for the foreign-born population - Other Caribbean (%)
Place of birth for the foreign-born population - Belize (%)
Place of birth for the foreign-born population - Costa Rica (%)
Place of birth for the foreign-born population - El Salvador (%)
Place of birth for the foreign-born population - Guatemala (%)
Place of birth for the foreign-born population - Honduras (%)
Place of birth for the foreign-born population - Mexico (%)
Place of birth for the foreign-born population - Nicaragua (%)
Place of birth for the foreign-born population - Panama (%)
Place of birth for the foreign-born population - Other Central America (%)
Place of birth for the foreign-born population - Argentina (%)
Place of birth for the foreign-born population - Bolivia (%)
Place of birth for the foreign-born population - Brazil (%)
Place of birth for the foreign-born population - Chile (%)
Place of birth for the foreign-born population - Colombia (%)
Place of birth for the foreign-born population - Ecuador (%)
Place of birth for the foreign-born population - Guyana (%)
Place of birth for the foreign-born population - Peru (%)
Place of birth for the foreign-born population - Uruguay (%)
Place of birth for the foreign-born population - Venezuela (%)
Place of birth for the foreign-born population - Other South America (%)
Place of birth for the foreign-born population - Canada (%)
Place of birth for the foreign-born population - Other Northern America (%)
Place of birth for the foreign-born population - Other (%)
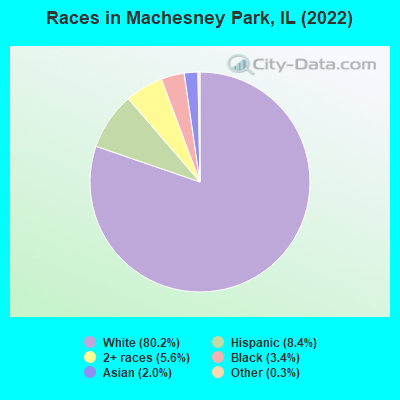
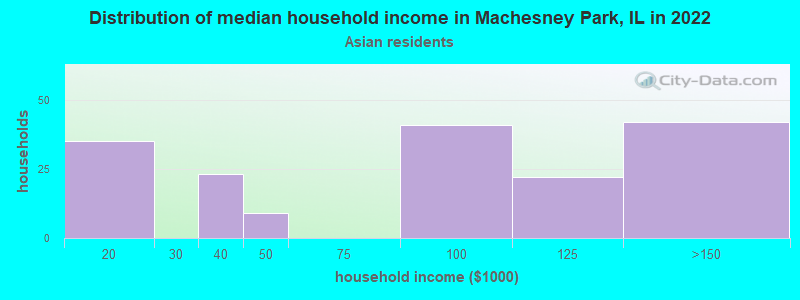
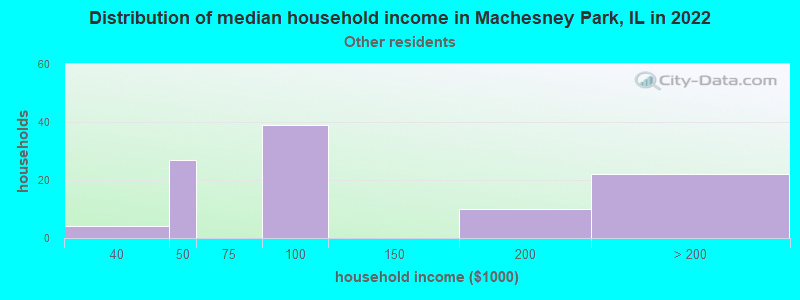
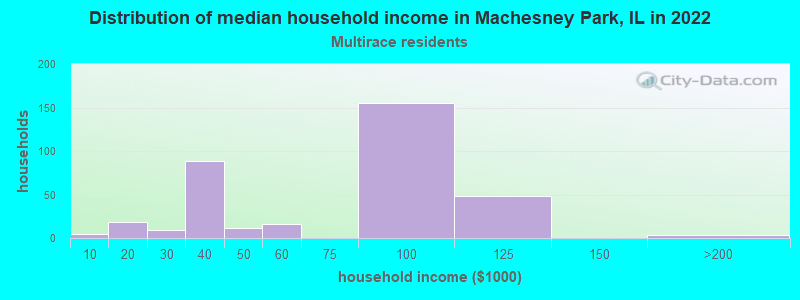
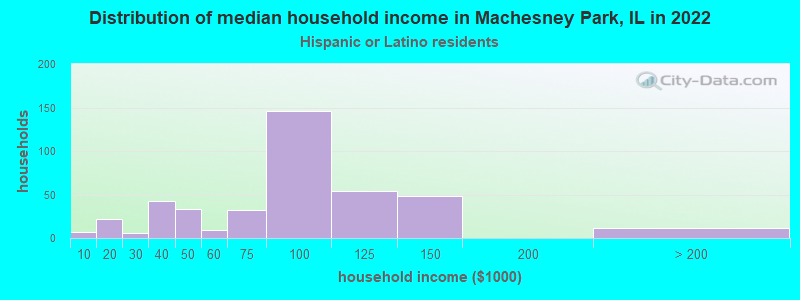
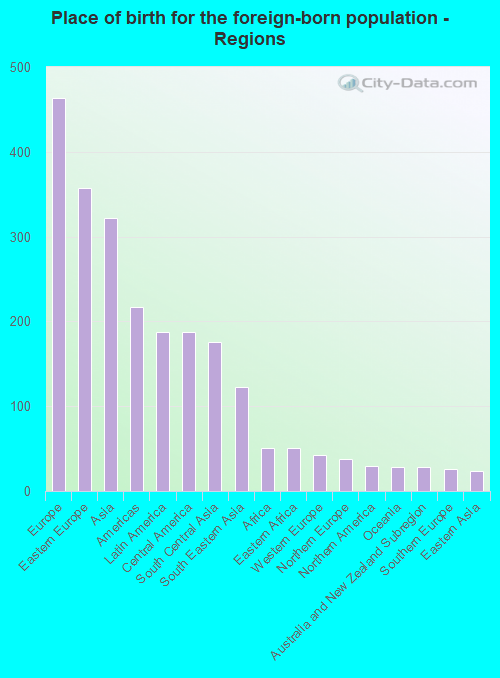
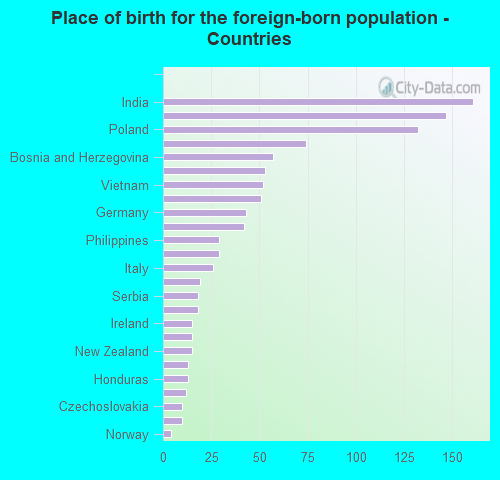
According to 2022 data, the most numerous races in Machesney Park, IL are White alone (18,152 residents), Hispanic (1,900 residents), and Black alone (773 residents). 93.6% of Machesney Park residents speak English at home. 4.8% of Machesney Park, IL residents are foreign-born (2.0% born in Europe, 1.4% born in Asia, 0.8% born in Latin America), which is 192.5% less than the foreign-born rate of 14.0% across the entire state of Illinois.
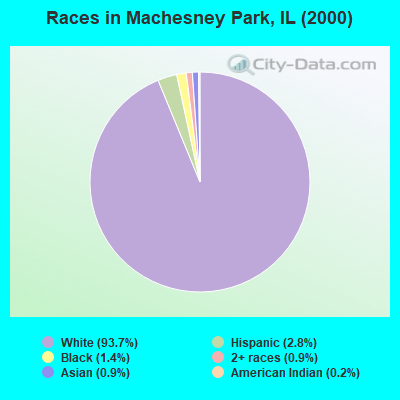
Race distribution in Machesney Park
2000 2022
8,424,140 67.8% White alone 1,856,152 14.9% Black alone 1,530,262 12.3% Hispanic 419,916 3.4% Asian alone 153,996 1.2% Two or more races 13,479 0.1% Other race alone 18,232 0.1% American Indian alone 3,116 0.03% Native Hawaiian and Other
7,356,301 58.5% White alone 2,299,726 18.3% Hispanic 1,660,423 13.2% Black alone 747,296 5.9% Asian alone 458,599 3.6% Two or more races 45,386 0.4% Other race alone 10,405 0.08% American Indian alone 3,896 0.03% Native Hawaiian and Other
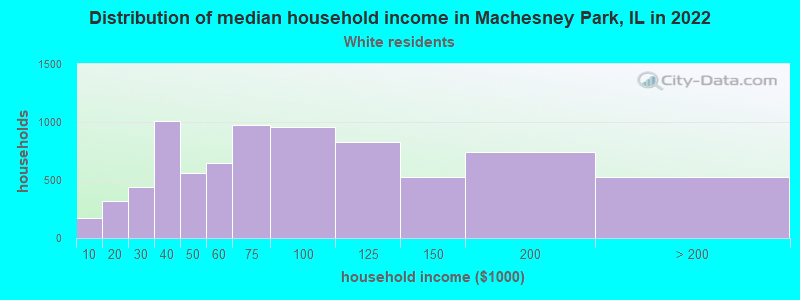
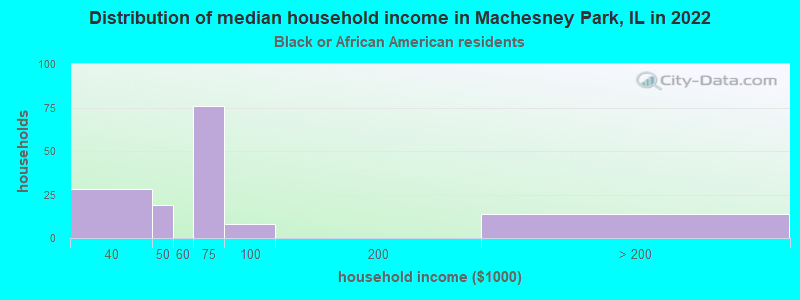
Income and house value in Machesney Park Median household income in 2022 $69,665 White non-Hispanic householders$62,889 Black householders$65,604 Asian householders$87,555 Two or more races householders$95,931 Hispanic or Latino race householdersMedian 2022 house value $167,584 White Non-Hispanic householders$182,751 Black or African American householders$83,237 American Indian or Alaska Native householders $150,381 Asian householders$128,185 Some other race householders$170,728 Two or more races householders$136,508 Hispanic or Latino householders
Median age by race in Machesney Park
45.0 Median age for White residents44.9 46.0 20.6 Median age for Black or African American residents21.6 20.3 -671,485,943.1 Median age for American Indian / Alaska Native residents-367,313,915.5 -798,727,127.3 45.1 Median age for Asian residents45.9 44.0 -410,158,729.7 Median age for Native Hawaiian / Pacific Islander residents-580,818,242.2 -576,015,108.0 24.4 Median age for Other race residents24.4 22.8 20.4 Median age for Two or more races residents19.9 20.6 45.7 Median age for White alone residents45.2 46.4 26.0 Median age for Hispanic or Latino residents26.5 25.3
Owner/renter occupied households by race in Machesney Park
House owners and renters - White residents 6,312 81.6% Owner occupied1,426 18.4% Renter occupiedHouse owners and renters - Black or African American residents 109 67.2% Owner occupied53 32.8% Renter occupiedHouse owners and renters - American Indian / Alaska Native residents 15 100.0% Renter occupiedHouse owners and renters - Asian residents 110 100.0% Owner occupiedHouse owners and renters - Other race residents 77 78.9% Owner occupied21 21.1% Renter occupiedHouse owners and renters - Two or more races residents 321 77.7% Owner occupied92 22.3% Renter occupiedHouse owners and renters - White alone residents 6,343 81.4% Owner occupied1,448 18.6% Renter occupiedHouse owners and renters - Hispanic or Latino residents 283 69.6% Owner occupied124 30.4% Renter occupied
Language usage in Machesney Park
English speakers - Total 93.6% of residents of Machesney Park speak English at home.
2.8% of residents speak Spanish at home 385 63.8% Speak English very well218 36.2% Speak English less than very well3.7% of residents speak other language at home 444 55.7% Speak English very well353 44.3% Speak English less than very well
English speakers - Born in the United States 97.8% of residents of Machesney Park speak English at home.
1.9% of residents speak Spanish at home 71 100.0% Speak English very well0.1% of residents speak other language at home 5 100.0% Speak English less than very well
English speakers - Native, born elsewhere 37.5% of residents of Machesney Park speak English at home.
22.1% of residents speak Spanish at home 24 38.7% Speak English very well38 61.3% Speak English less than very well4.6% of residents speak other language at home 13 100.0% Speak English very well
English speakers - Foreign-born 16.6% of residents of Machesney Park speak English at home.
14.8% of residents speak Spanish at home 123 87.2% Speak English very well18 12.8% Speak English less than very well67.7% of residents speak other language at home 284 44.0% Speak English very well361 56.0% Speak English less than very well
White (Caucasian) - Speak only English Native:
100.0% (17,565)Foreign-born:
37.3% (87)
White (Caucasian) - Speak another language Native:
0.8% (136)Foreign-born:
63.2% (146)
Asian - Speak only English Native:
53.2% (98)Foreign-born:
1.5% (4)
Asian - Speak another language Native:
35.5% (65)Foreign-born:
100.0% (293)
Other race - Speak another language Native:
24.5% (107)Foreign-born:
100.0% (107)
Two or more races - Speak only English Native:
80.3% (1,415)Foreign-born:
25.3% (30)
Two or more races - Speak another language Native:
17.8% (315)Foreign-born:
76.6% (91)
White alone - Speak only English Native:
99.5% (17,242)Foreign-born:
27.4% (89)
White alone - Speak another language Native:
0.7% (122)Foreign-born:
70.5% (229)
Hispanic or Latino - Speak only English Native:
73.5% (1,186)Foreign-born:
23.6% (41)
Hispanic or Latino - Speak another language Native:
24.6% (397)Foreign-born:
78.6% (137)
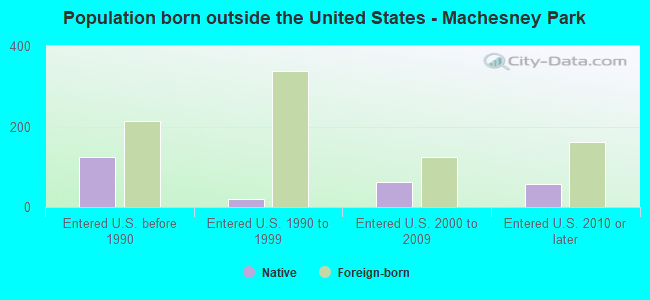
Foreign-born residents in Machesney Park 1,084 residents are foreign born (2.0% Europe , 1.4% Asia , 0.8% Latin America ).
This city:
4.8%Illinois:
14.1%
Marital status for residents in Machesney Park Marital status - White (Caucasian) population 15 years and over
Males 32.0% Never married52.1% Now married1.2% Separated2.0% Widowed12.7% DivorcedFemales 26.7% Never married50.0% Now married0.6% Separated10.6% Widowed12.1% DivorcedWomen who gave birth in the past 12 months Now married:
50.5% (93)Unmarried:
49.5% (91)
Women who did not give birth in the past 12 months Now married:
44.9% (1,792)Unmarried:
55.1% (2,198)
Marital status - Black or African American population 15 years and over
Males 44.6% Never married51.8% Now married0.0% Separated0.0% Widowed3.6% DivorcedFemales 66.4% Never married20.5% Now married0.0% Separated0.0% Widowed13.1% DivorcedWomen who did not give birth in the past 12 months Now married:
15.0% (50)Unmarried:
85.0% (284)
Marital status - Asian population 15 years and over
Males 36.9% Never married58.7% Now married4.4% Separated0.0% Widowed0.0% DivorcedFemales 17.6% Never married61.4% Now married18.0% Separated3.0% Widowed0.0% DivorcedWomen who gave birth in the past 12 months Now married:
100.0% (23)Unmarried:
0.0% (0)
Women who did not give birth in the past 12 months Now married:
62.7% (70)Unmarried:
37.3% (41)
Marital status - Other race population 15 years and over
Males 37.4% Never married62.6% Now married0.0% Separated0.0% Widowed0.0% DivorcedFemales 26.2% Never married59.3% Now married0.0% Separated0.0% Widowed14.5% DivorcedWomen who did not give birth in the past 12 months Now married:
54.6% (104)Unmarried:
45.4% (87)
Marital status - Two or more races population 15 years and over
Males 27.3% Never married53.8% Now married0.0% Separated8.4% Widowed10.5% DivorcedFemales 61.1% Never married28.7% Now married0.0% Separated4.3% Widowed5.9% DivorcedWomen who gave birth in the past 12 months Now married:
0.0% (0)Unmarried:
100.0% (66)
Women who did not give birth in the past 12 months Now married:
29.7% (161)Unmarried:
70.3% (381)
Marital status - White alone, not Hispanic / Latino population 15 years and over
Males 31.5% Never married52.6% Now married1.2% Separated2.1% Widowed12.5% DivorcedFemales 26.0% Never married50.6% Now married0.6% Separated10.7% Widowed12.0% DivorcedWomen who gave birth in the past 12 months Now married:
50.5% (99)Unmarried:
49.5% (97)
Women who did not give birth in the past 12 months Now married:
46.1% (1,834)Unmarried:
53.9% (2,144)
Marital status - Hispanic or Latino population 15 years and over
Males 38.1% Never married51.5% Now married0.0% Separated0.0% Widowed10.5% DivorcedFemales 44.8% Never married39.4% Now married0.4% Separated4.9% Widowed10.6% DivorcedWomen who did not give birth in the past 12 months Now married:
34.7% (214)Unmarried:
65.3% (403)
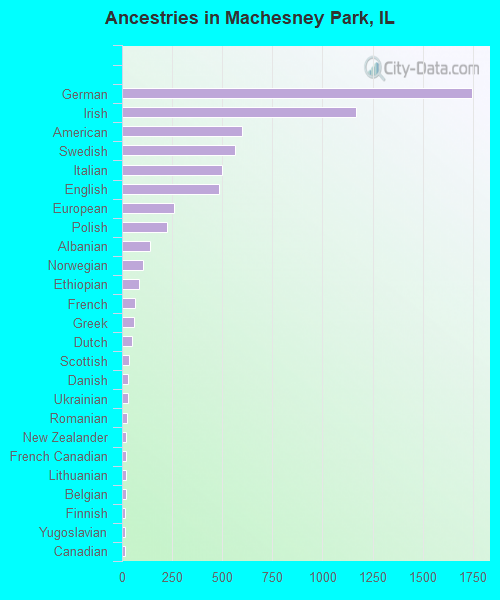
Ancestries in Machesney Park
1,744 20.6% German1,170 13.8% Irish599 7.1% American562 6.6% Swedish500 5.9% Italian484 5.7% English257 3.0% European225 2.7% Polish138 1.6% Albanian106 1.3% Norwegian83 1.0% Ethiopian65 0.8% French58 0.7% Greek50 0.6% Dutch33 0.4% Scottish31 0.4% Danish30 0.4% Ukrainian24 0.3% Romanian21 0.2% New Zealander20 0.2% French Canadian20 0.2% Lithuanian18 0.2% Belgian17 0.2% Finnish17 0.2% Yugoslavian16 0.2% Canadian16 0.2% Scotch-Irish12 0.1% Scandinavian9 0.1% British
Geographical mobility in Machesney Park Same house 1 year ago 16,467 90.8% White (Caucasian)652 86.6% Black or African American12 99.7% American Indian / Alaska Native513 99.4% Asian12 100.0% Native Hawaiian / Pacific Islander449 88.8% Other race1,514 76.2% Two or more races16,457 90.7% White alone, not Hispanic / Latino1,611 85.7% Hispanic or LatinoMoved within same county 1,033 5.7% White / Caucasian15 3.0% Other race379 19.1% Two or more races1,063 5.9% White alone, not Hispanic / Latino157 8.4% Hispanic or LatinoMoved within same state 458 2.5% White / Caucasian124 16.4% Black or African American48 9.6% Other race40 2.0% Two or more races460 2.5% White alone, not Hispanic / Latino104 5.5% Hispanic or LatinoMoved from different state 48 0.3% White / Caucasian8 1.1% Black or African American50 0.3% White alone, not Hispanic / LatinoMoved from abroad 9 0.1% White7 0.0% White alone, not Hispanic / Latino
Children Nativity (place of birth) in Machesney Park
Children under 6 years - Living with two parents Both parents native 550 100.0% NativeBoth parents foreign-born 23 100.0% NativeOne native, one foreign-born parent 143 100.0% NativeChildren under 6 years - Living with one parent Native parent 401 100.0% Native
Children 6 to 17 years - Living with two parents Both parents native 1,883 99.1% Native17 0.9% Foreign-bornBoth parents foreign-born 68 100.0% NativeOne native, one foreign-born parent 209 100.0% NativeChildren 6 to 17 years - Living with one parent Native parent 1,087 100.0% Native
Grandparents responsible for own grandchildren in Machesney Park
Grandparents (30 to 59 years) White / Caucasian 94 56.7% Responsible for grandchildren72 43.3% Not responsible for grandchildrenTwo or more races 7 41.5% Responsible for grandchildren9 58.5% Not responsible for grandchildrenWhite alone, not Hispanic / Latino 113 63.8% Responsible for grandchildren64 36.2% Not responsible for grandchildrenHispanic or Latino 21 100.0% Not responsible for grandchildrenGrandparents (60 years and over) White / Caucasian 102 72.9% Responsible for grandchildren38 27.1% Not responsible for grandchildrenTwo or more races 44 77.6% Responsible for grandchildren13 22.4% Not responsible for grandchildrenWhite alone, not Hispanic / Latino 105 71.3% Responsible for grandchildren42 28.7% Not responsible for grandchildrenHispanic or Latino 22 100.0% Responsible for grandchildren