Races in Machias, New York (NY) Detailed Stats
Ancestries, Foreign-born residents, place of birth

Data:
1.5% of Machias, NY residents are foreign-born , which is 1416.8% less than the foreign-born rate of 22.0% across the entire state of New York.
Race distribution in Machias

- 2,41697.3%White alone
- 281.1%Two or more races
- 251.0%Hispanic
- 40.2%Black alone
- 50.2%American Indian alone
- 20.08%Asian alone
- 20.08%Other race alone
2000
2022
-
- 11,760,98162.0%White alone
- 2,867,58315.1%Hispanic
- 2,812,62314.8%Black alone
- 1,035,9265.5%Asian alone
- 366,1161.9%Two or more races
- 75,4990.4%Other race alone
- 52,4990.3%American Indian alone
- 5,2300.03%Native Hawaiian and Other
Pacific Islander alone
-
- 10,408,93352.9%White alone
- 3,867,29919.7%Hispanic
- 2,633,84013.4%Black alone
- 1,776,2869.0%Asian alone
- 732,6703.7%Two or more races
- 216,1101.1%Other race alone
- 35,0820.2%American Indian alone
- 6,9310.04%Native Hawaiian and Other
Pacific Islander alone
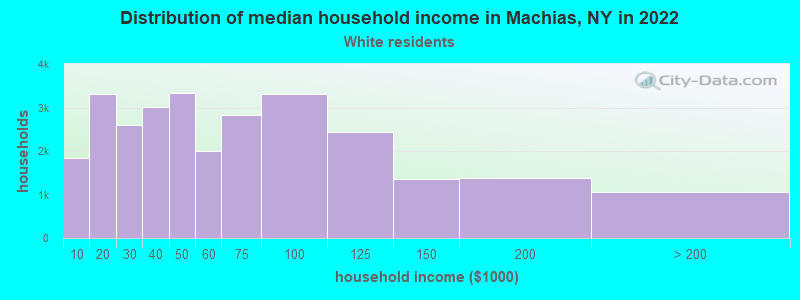
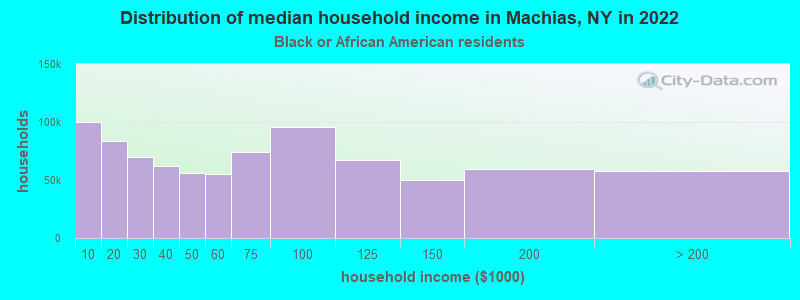
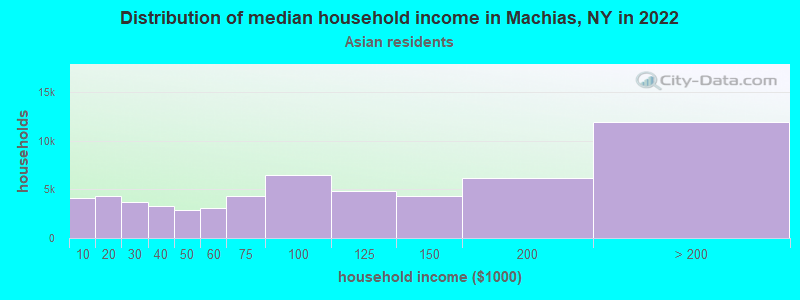
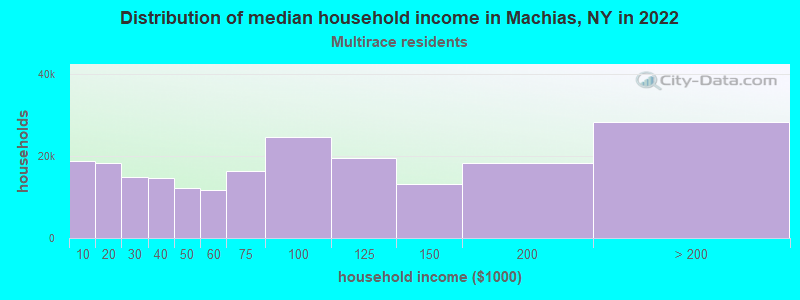
Income and house value in Machias
- Median household income in 2022
- $51,089White non-Hispanic householders
- $106,146Black householders
- $23,388Asian householders
- $43,011Two or more races householders
- Median 2022 house value
- $127,441White Non-Hispanic householders
Foreign-born residents in Machias
36 residents are foreign born
| This city: | 1.5% |
| New York: | 20.4% |
Ancestries in Machias

- 89032.9%German
- 31511.6%English
- 31511.6%Irish
- 27010.0%Polish
- 2037.5%United States
- 1605.9%Other
- 1324.9%French
- 1204.4%Italian
- 823.0%Dutch
- 431.6%Scottish
- 391.4%Welsh
- 301.1%French Canadian
- 250.9%Swedish
- 210.8%Scotch-Irish
- 190.7%Swiss
- 180.7%Danish
- 100.4%Ukrainian
- 80.3%Czech
- 80.3%Hungarian