Races in Magna, Utah (UT) Detailed Stats
Data:
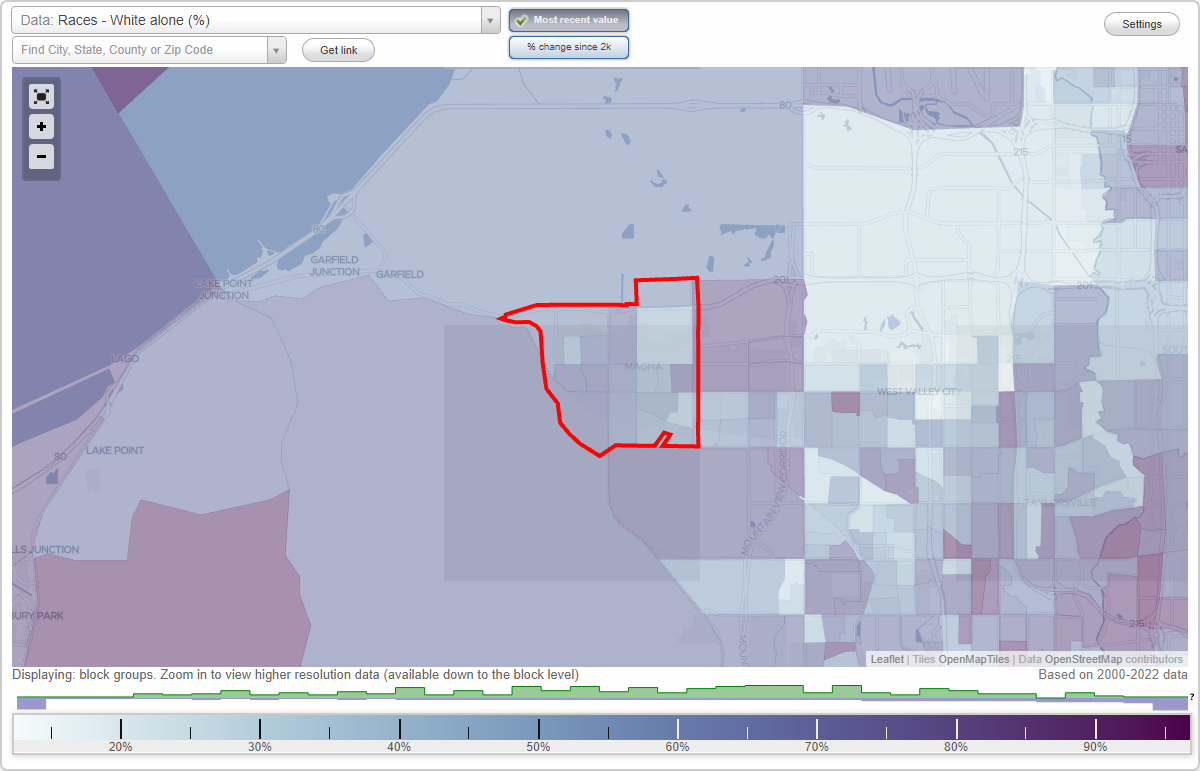
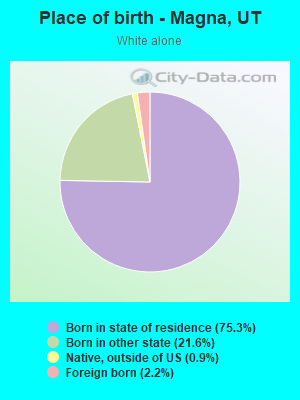
Races - White alone (%)
Races - White alone (% change since 2000)
Races - Black alone (%)
Races - Black alone (% change since 2000)
Races - American Indian alone (%)
Races - American Indian alone (% change since 2000)
Races - Asian alone (%)
Races - Asian alone (% change since 2000)
Races - Hispanic (%)
Races - Hispanic (% change since 2000)
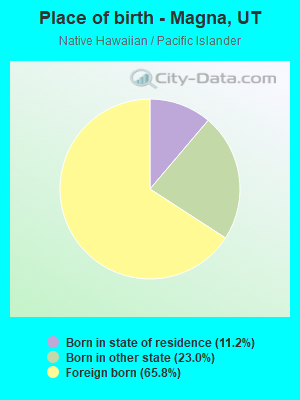
Races - Native Hawaiian and Other Pacific Islander alone (%)
Races - Native Hawaiian and Other Pacific Islander alone (% change since 2000)
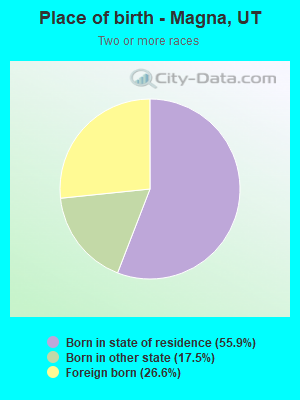
Races - Two or more races(%)
Races - Two or more races(% change since 2000)
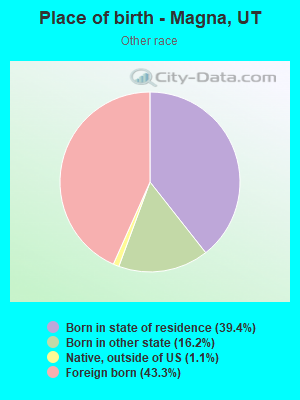
Races - Other race alone (%)
Races - Other race alone (% change since 2000)
Racial diversity
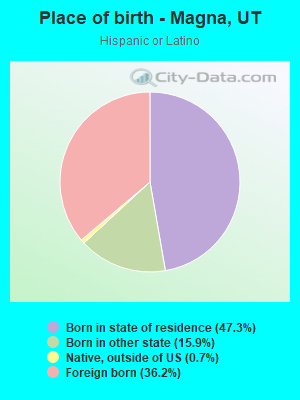
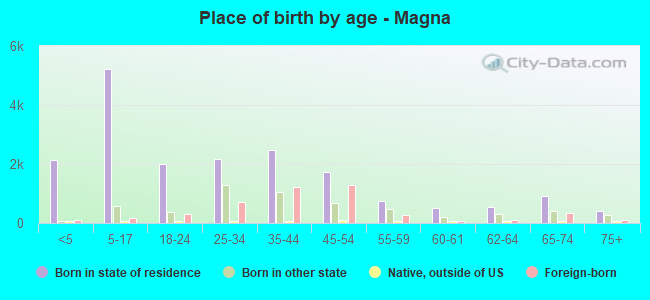
Place of birth - Born in state of residence (%)
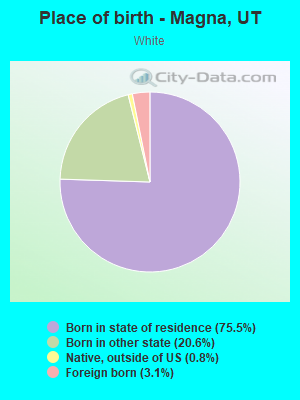
Place of birth - Born in state of residence (%) - White
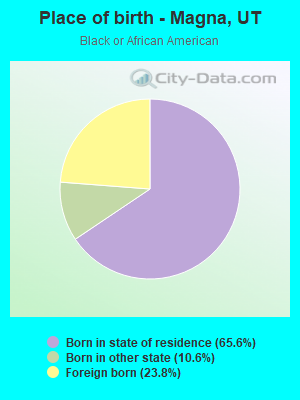
Place of birth - Born in state of residence (%) - Black or African American
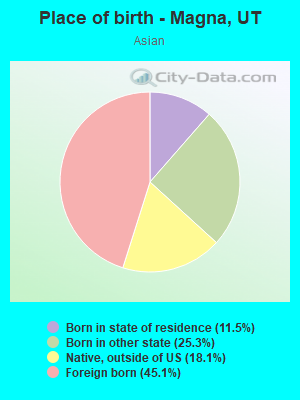
Place of birth - Born in state of residence (%) - Asian
Place of birth - Born in state of residence (%) - Hispanic or Latino
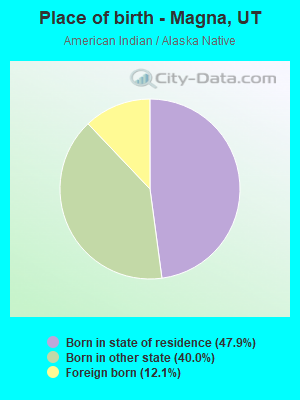
Place of birth - Born in state of residence (%) - American Indian and Alaska Native
Place of birth - Born in state of residence (%) - Multirace
Place of birth - Born in state of residence (%) - Other Race
Place of birth - Born in other state (%)
Place of birth - Born in other state (%) - White
Place of birth - Born in other state (%) - Black or African American
Place of birth - Born in other state (%) - Asian
Place of birth - Born in other state (%) - Hispanic or Latino
Place of birth - Born in other state (%) - American Indian and Alaska Native
Place of birth - Born in other state (%) - Multirace
Place of birth - Born in other state (%) - Other Race
Place of birth - Native, outside of US (%)
Place of birth - Native, outside of US (%) - White
Place of birth - Native, outside of US (%) - Black or African American
Place of birth - Native, outside of US (%) - Asian
Place of birth - Native, outside of US (%) - Hispanic or Latino
Place of birth - Native, outside of US (%) - American Indian and Alaska Native
Place of birth - Native, outside of US (%) - Multirace
Place of birth - Native, outside of US (%) - Other Race
Place of birth - Foreign born (%)
Place of birth - Foreign born (%) - White
Place of birth - Foreign born (%) - Black or African American
Place of birth - Foreign born (%) - Asian
Place of birth - Foreign born (%) - Hispanic or Latino
Place of birth - Foreign born (%) - American Indian and Alaska Native
Place of birth - Foreign born (%) - Multirace
Place of birth - Foreign born (%) - Other Race
Residents speaking English at home (%)
Residents speaking English at home - Born in the United States (%)
Residents speaking English at home - Native, born elsewhere (%)
Residents speaking English at home - Foreign born (%)
Residents speaking Spanish at home (%)
Residents speaking Spanish at home - Born in the United States (%)
Residents speaking Spanish at home - Native, born elsewhere (%)
Residents speaking Spanish at home - Foreign born (%)
Residents speaking other language at home (%)
Residents speaking other language at home - Born in the United States (%)
Residents speaking other language at home - Native, born elsewhere (%)
Residents speaking other language at home - Foreign born (%)
Marital status - Never married (%)
Marital status - Now married (%)
Marital status - Separated (%)
Marital status - Widowed (%)
Marital status - Divorced (%)
Ancestries Reported - Arab (%)
Ancestries Reported - Czech (%)
Ancestries Reported - Danish (%)
Ancestries Reported - Dutch (%)
Ancestries Reported - English (%)
Ancestries Reported - French (%)
Ancestries Reported - French Canadian (%)
Ancestries Reported - German (%)
Ancestries Reported - Greek (%)
Ancestries Reported - Hungarian (%)
Ancestries Reported - Irish (%)
Ancestries Reported - Italian (%)
Ancestries Reported - Lithuanian (%)
Ancestries Reported - Norwegian (%)
Ancestries Reported - Polish (%)
Ancestries Reported - Portuguese (%)
Ancestries Reported - Russian (%)
Ancestries Reported - Scotch-Irish (%)
Ancestries Reported - Scottish (%)
Ancestries Reported - Slovak (%)
Ancestries Reported - Subsaharan African (%)
Ancestries Reported - Swedish (%)
Ancestries Reported - Swiss (%)
Ancestries Reported - Ukrainian (%)
Ancestries Reported - United States (%)
Ancestries Reported - Welsh (%)
Ancestries Reported - West Indian (%)
Ancestries Reported - Other (%)
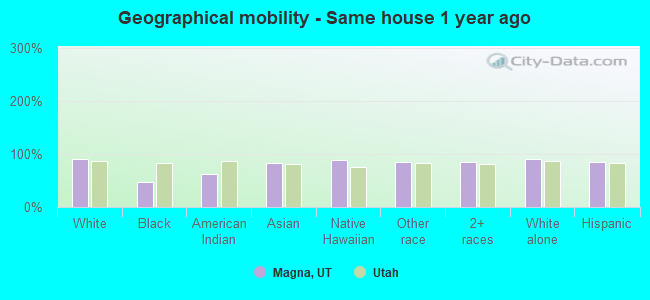
Geographical mobility - Same house 1 year ago (%)
Geographical mobility - Same house 1 year ago (%) - White
Geographical mobility - Same house 1 year ago (%) - Black or African American
Geographical mobility - Same house 1 year ago (%) - Asian
Geographical mobility - Same house 1 year ago (%) - Hispanic or Latino
Geographical mobility - Same house 1 year ago (%) - American Indian and Alaska Native
Geographical mobility - Same house 1 year ago (%) - Multirace
Geographical mobility - Same house 1 year ago (%) - Other Race
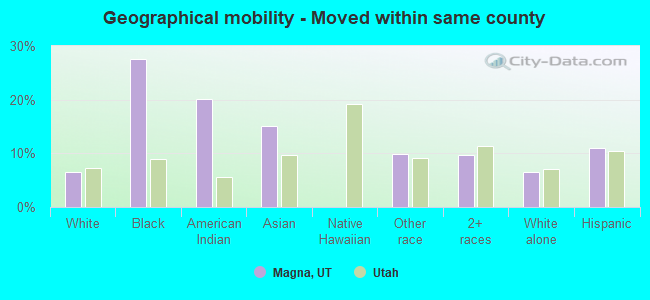
Geographical mobility - Moved within same county (%)
Geographical mobility - Moved within same county (%) - White
Geographical mobility - Moved within same county (%) - Black or African American
Geographical mobility - Moved within same county (%) - Asian
Geographical mobility - Moved within same county (%) - Hispanic or Latino
Geographical mobility - Moved within same county (%) - American Indian and Alaska Native
Geographical mobility - Moved within same county (%) - Multirace
Geographical mobility - Moved within same county (%) - Other Race
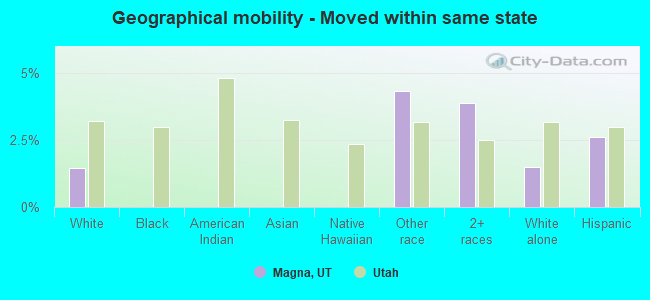
Geographical mobility - Moved from different county within same state (%)
Geographical mobility - Moved from different county within same state (%) - White
Geographical mobility - Moved from different county within same state (%) - Black or African American
Geographical mobility - Moved from different county within same state (%) - Asian
Geographical mobility - Moved from different county within same state (%) - Hispanic or Latino
Geographical mobility - Moved from different county within same state (%) - American Indian and Alaska Native
Geographical mobility - Moved from different county within same state (%) - Multirace
Geographical mobility - Moved from different county within same state (%) - Other Race
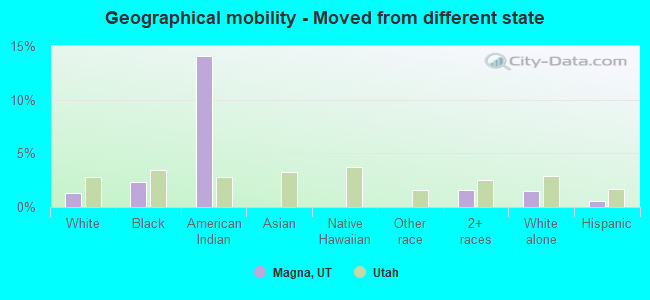
Geographical mobility - Moved from different state (%)
Geographical mobility - Moved from different state (%) - White
Geographical mobility - Moved from different state (%) - Black or African American
Geographical mobility - Moved from different state (%) - Asian
Geographical mobility - Moved from different state (%) - Hispanic or Latino
Geographical mobility - Moved from different state (%) - American Indian and Alaska Native
Geographical mobility - Moved from different state (%) - Multirace
Geographical mobility - Moved from different state (%) - Other Race
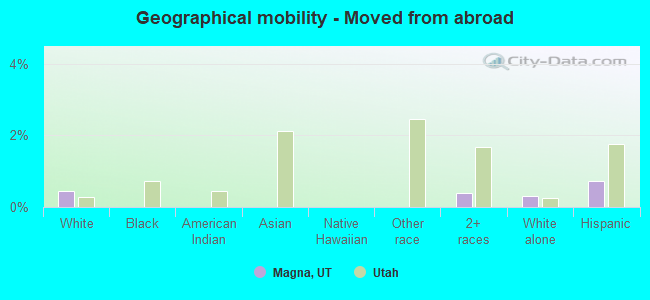
Geographical mobility - Moved from abroad (%)
Geographical mobility - Moved from abroad (%) - White
Geographical mobility - Moved from abroad (%) - Black or African American
Geographical mobility - Moved from abroad (%) - Asian
Geographical mobility - Moved from abroad (%) - Hispanic or Latino
Geographical mobility - Moved from abroad (%) - American Indian and Alaska Native
Geographical mobility - Moved from abroad (%) - Multirace
Geographical mobility - Moved from abroad (%) - Other Race
Place of birth for the foreign-born population - Ireland (%)
Place of birth for the foreign-born population - Denmark (%)
Place of birth for the foreign-born population - Norway (%)
Place of birth for the foreign-born population - Sweden (%)
Place of birth for the foreign-born population - United Kingdom (%)
Place of birth for the foreign-born population - England (%)
Place of birth for the foreign-born population - Scotland (%)
Place of birth for the foreign-born population - Other Northern Europe (%)
Place of birth for the foreign-born population - Austria (%)
Place of birth for the foreign-born population - Belgium (%)
Place of birth for the foreign-born population - France (%)
Place of birth for the foreign-born population - Germany (%)
Place of birth for the foreign-born population - Netherlands (%)
Place of birth for the foreign-born population - Switzerland (%)
Place of birth for the foreign-born population - Other Western Europe (%)
Place of birth for the foreign-born population - Greece (%)
Place of birth for the foreign-born population - Italy (%)
Place of birth for the foreign-born population - Portugal (%)
Place of birth for the foreign-born population - Spain (%)
Place of birth for the foreign-born population - Other Southern Europe (%)
Place of birth for the foreign-born population - Albania (%)
Place of birth for the foreign-born population - Belarus (%)
Place of birth for the foreign-born population - Bosnia and Herzegovina (%)
Place of birth for the foreign-born population - Bulgaria (%)
Place of birth for the foreign-born population - Croatia (%)
Place of birth for the foreign-born population - Czechoslovakia (%)
Place of birth for the foreign-born population - Hungary (%)
Place of birth for the foreign-born population - Latvia (%)
Place of birth for the foreign-born population - Lithuania (%)
Place of birth for the foreign-born population - North Macedonia (Macedonia) (%)
Place of birth for the foreign-born population - Moldova (%)
Place of birth for the foreign-born population - Poland (%)
Place of birth for the foreign-born population - Romania (%)
Place of birth for the foreign-born population - Russia (%)
Place of birth for the foreign-born population - Serbia (%)
Place of birth for the foreign-born population - Ukraine (%)
Place of birth for the foreign-born population - Other Eastern Europe (%)
Place of birth for the foreign-born population - China (%)
Place of birth for the foreign-born population - Hong Kong (%)
Place of birth for the foreign-born population - Taiwan (%)
Place of birth for the foreign-born population - Japan (%)
Place of birth for the foreign-born population - Korea (%)
Place of birth for the foreign-born population - Other Eastern Asia (%)
Place of birth for the foreign-born population - Afghanistan (%)
Place of birth for the foreign-born population - Bangladesh (%)
Place of birth for the foreign-born population - India (%)
Place of birth for the foreign-born population - Iran (%)
Place of birth for the foreign-born population - Kazakhstan (%)
Place of birth for the foreign-born population - Nepal (%)
Place of birth for the foreign-born population - Pakistan (%)
Place of birth for the foreign-born population - Sri Lanka (%)
Place of birth for the foreign-born population - Uzbekistan (%)
Place of birth for the foreign-born population - Other South Central Asia (%)
Place of birth for the foreign-born population - Burma (%)
Place of birth for the foreign-born population - Cambodia (%)
Place of birth for the foreign-born population - Indonesia (%)
Place of birth for the foreign-born population - Laos (%)
Place of birth for the foreign-born population - Malaysia (%)
Place of birth for the foreign-born population - Philippines (%)
Place of birth for the foreign-born population - Singapore (%)
Place of birth for the foreign-born population - Thailand (%)
Place of birth for the foreign-born population - Vietnam (%)
Place of birth for the foreign-born population - Other South Eastern Asia (%)
Place of birth for the foreign-born population - Armenia (%)
Place of birth for the foreign-born population - Iraq (%)
Place of birth for the foreign-born population - Israel (%)
Place of birth for the foreign-born population - Jordan (%)
Place of birth for the foreign-born population - Kuwait (%)
Place of birth for the foreign-born population - Lebanon (%)
Place of birth for the foreign-born population - Saudi Arabia (%)
Place of birth for the foreign-born population - Syria (%)
Place of birth for the foreign-born population - Turkey (%)
Place of birth for the foreign-born population - Yemen (%)
Place of birth for the foreign-born population - Other Western Asia (%)
Place of birth for the foreign-born population - Eritrea (%)
Place of birth for the foreign-born population - Ethiopia (%)
Place of birth for the foreign-born population - Kenya (%)
Place of birth for the foreign-born population - Somalia (%)
Place of birth for the foreign-born population - Uganda (%)
Place of birth for the foreign-born population - Zimbabwe (%)
Place of birth for the foreign-born population - Other Eastern Africa (%)
Place of birth for the foreign-born population - Cameroon (%)
Place of birth for the foreign-born population - Congo (%)
Place of birth for the foreign-born population - Democratic Republic of Congo (Zaire) (%)
Place of birth for the foreign-born population - Other Middle Africa (%)
Place of birth for the foreign-born population - Egypt (%)
Place of birth for the foreign-born population - Morocco (%)
Place of birth for the foreign-born population - Sudan (%)
Place of birth for the foreign-born population - Other Northern Africa (%)
Place of birth for the foreign-born population - South Africa (%)
Place of birth for the foreign-born population - Other Southern Africa (%)
Place of birth for the foreign-born population - Cabo Verde (%)
Place of birth for the foreign-born population - Ghana (%)
Place of birth for the foreign-born population - Liberia (%)
Place of birth for the foreign-born population - Nigeria (%)
Place of birth for the foreign-born population - Senegal (%)
Place of birth for the foreign-born population - Sierra Leone (%)
Place of birth for the foreign-born population - Other Western Africa (%)
Place of birth for the foreign-born population - Australia (%)
Place of birth for the foreign-born population - New Zealand (%)
Place of birth for the foreign-born population - Fiji (%)
Place of birth for the foreign-born population - Micronesia (%)
Place of birth for the foreign-born population - Bahamas (%)
Place of birth for the foreign-born population - Barbados (%)
Place of birth for the foreign-born population - Cuba (%)
Place of birth for the foreign-born population - Dominica (%)
Place of birth for the foreign-born population - Dominican Republic (%)
Place of birth for the foreign-born population - Grenada (%)
Place of birth for the foreign-born population - Haiti (%)
Place of birth for the foreign-born population - Jamaica (%)
Place of birth for the foreign-born population - St. Vincent and the Grenadines (%)
Place of birth for the foreign-born population - Trinidad and Tobago (%)
Place of birth for the foreign-born population - West Indies (%)
Place of birth for the foreign-born population - Other Caribbean (%)
Place of birth for the foreign-born population - Belize (%)
Place of birth for the foreign-born population - Costa Rica (%)
Place of birth for the foreign-born population - El Salvador (%)
Place of birth for the foreign-born population - Guatemala (%)
Place of birth for the foreign-born population - Honduras (%)
Place of birth for the foreign-born population - Mexico (%)
Place of birth for the foreign-born population - Nicaragua (%)
Place of birth for the foreign-born population - Panama (%)
Place of birth for the foreign-born population - Other Central America (%)
Place of birth for the foreign-born population - Argentina (%)
Place of birth for the foreign-born population - Bolivia (%)
Place of birth for the foreign-born population - Brazil (%)
Place of birth for the foreign-born population - Chile (%)
Place of birth for the foreign-born population - Colombia (%)
Place of birth for the foreign-born population - Ecuador (%)
Place of birth for the foreign-born population - Guyana (%)
Place of birth for the foreign-born population - Peru (%)
Place of birth for the foreign-born population - Uruguay (%)
Place of birth for the foreign-born population - Venezuela (%)
Place of birth for the foreign-born population - Other South America (%)
Place of birth for the foreign-born population - Canada (%)
Place of birth for the foreign-born population - Other Northern America (%)
Place of birth for the foreign-born population - Other (%)
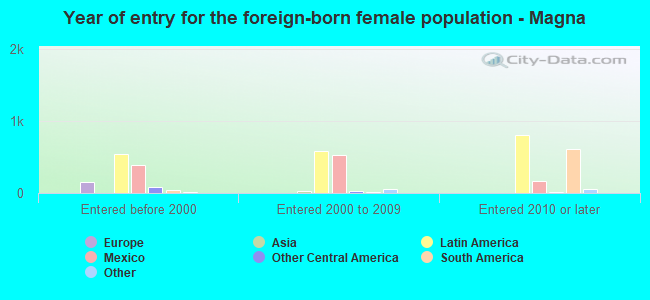
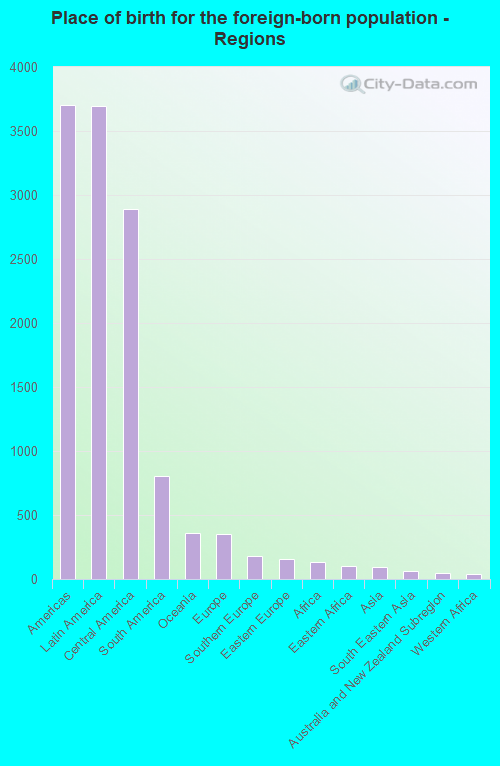
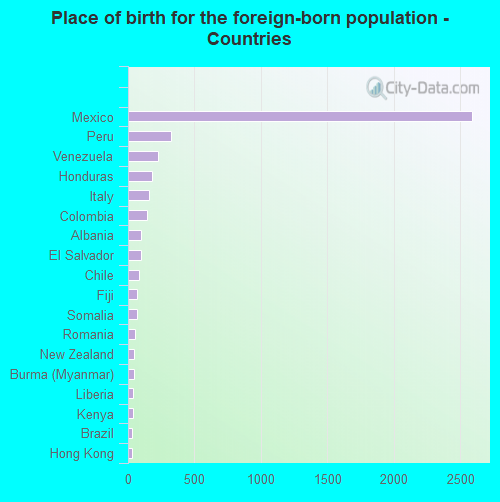
According to 2022 data, the most numerous races in Magna, UT are White alone (16,732 residents), Hispanic (10,068 residents), and Two or more races (1,534 residents). 72.4% of Magna residents speak English at home. 15.8% of Magna, UT residents are foreign-born (11.9% born in Latin America), which is 49.4% greater than the foreign-born rate of 8.0% across the entire state of Utah.
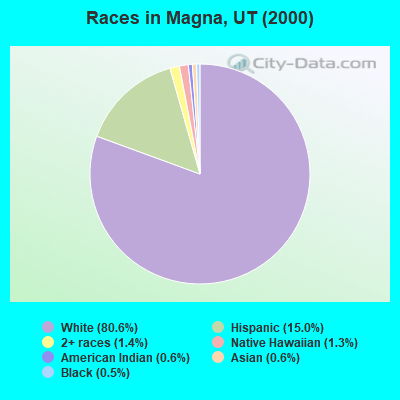
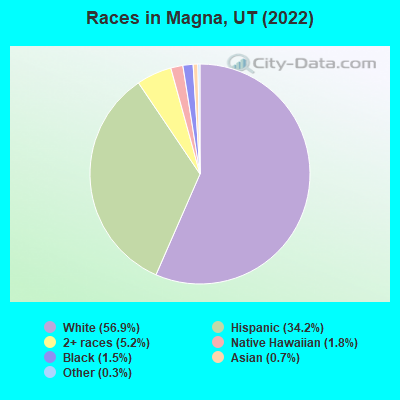
Race distribution in Magna
2000 2022
1,904,265 85.3% White alone 201,559 9.0% Hispanic 36,483 1.6% Asian alone 31,308 1.4% Two or more races 26,663 1.2% American Indian alone 14,806 0.7% Native Hawaiian and Other 16,137 0.7% Black alone 1,948 0.09% Other race alone
2,557,466 75.6% White alone 512,086 15.1% Hispanic 119,308 3.5% Two or more races 82,388 2.4% Asian alone 36,978 1.1% Native Hawaiian and Other 34,873 1.0% Black alone 22,803 0.7% American Indian alone 14,898 0.4% Other race alone
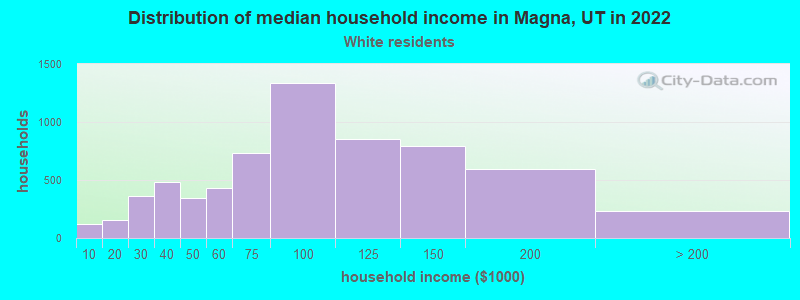
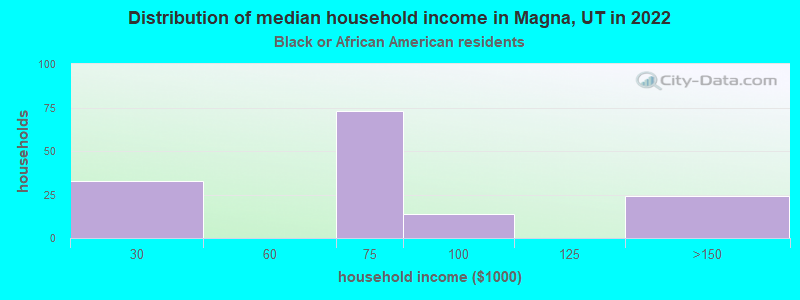
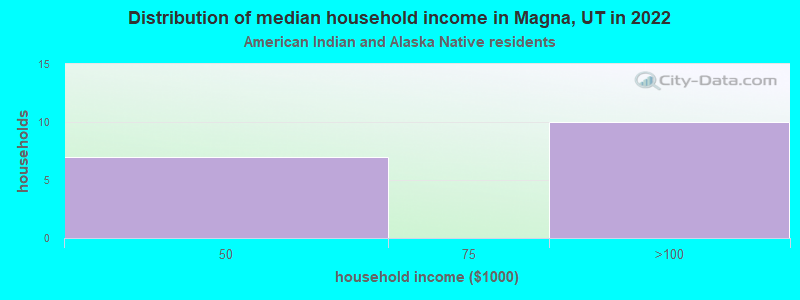
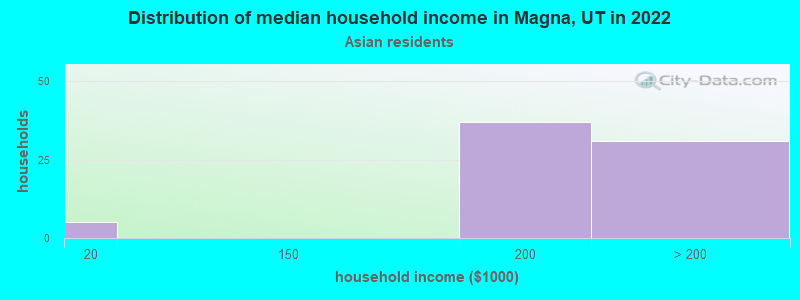
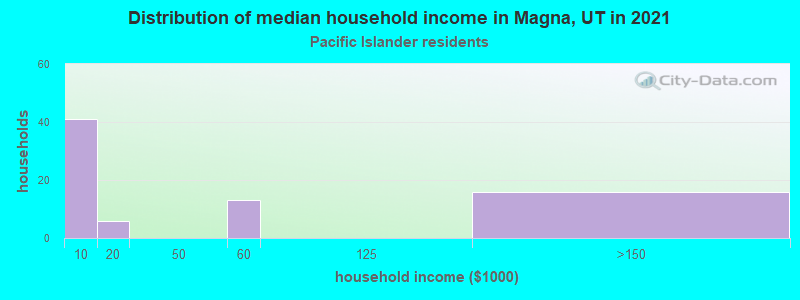
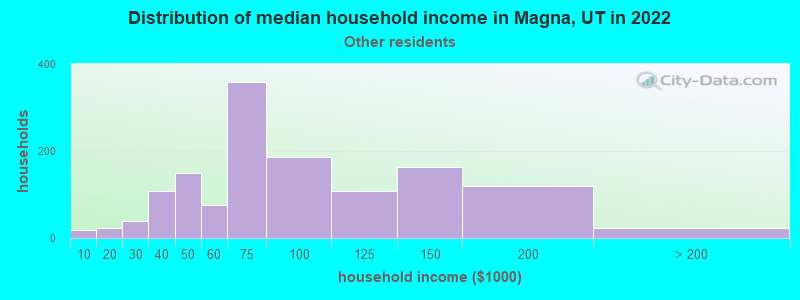
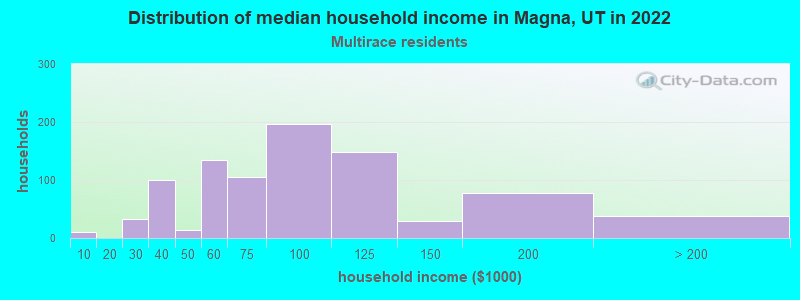
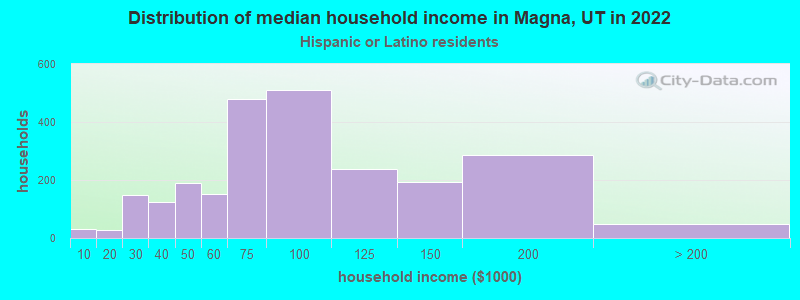
Income and house value in Magna Median household income in 2022 $83,741 White non-Hispanic householders$91,130 Black householders$188,399 Asian householders$86,036 Native Hawaiian and other Pacific Islander householders$70,149 Some other race householders$78,857 Two or more races householders$77,828 Hispanic or Latino race householdersMedian 2022 house value $365,304 White Non-Hispanic householders$525,792 Black or African American householders $394,425 Asian householders$337,154 Native Hawaiian and other Pacific Islander householders$383,100 Some other race householders$378,894 Two or more races householders$382,777 Hispanic or Latino householders
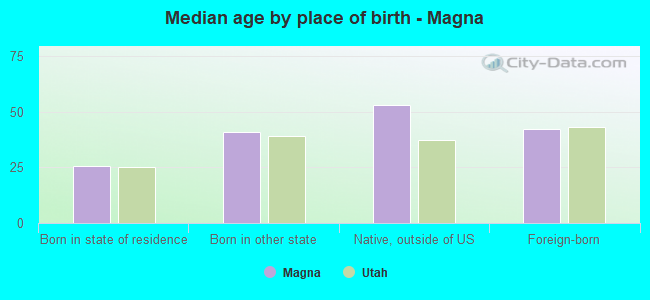
Median age by race in Magna
38.1 Median age for White residents38.1 38.2 12.8 Median age for Black or African American residents26.2 9.9 22.3 Median age for American Indian / Alaska Native residents21.8 26.0 37.8 Median age for Asian residents45.5 37.8 32.3 Median age for Native Hawaiian / Pacific Islander residents31.2 28.2 29.1 Median age for Other race residents25.6 32.8 21.3 Median age for Two or more races residents21.6 18.9 38.9 Median age for White alone residents38.8 39.0 26.5 Median age for Hispanic or Latino residents24.7 29.2
Owner/renter occupied households by race in Magna
House owners and renters - White residents 5,483 83.4% Owner occupied1,089 16.6% Renter occupiedHouse owners and renters - Black or African American residents 44 43.8% Owner occupied56 56.2% Renter occupiedHouse owners and renters - American Indian / Alaska Native residents 26 100.0% Owner occupiedHouse owners and renters - Asian residents 67 100.0% Owner occupiedHouse owners and renters - Native Hawaiian / Pacific Islander residents 32 34.0% Owner occupied63 66.0% Renter occupiedHouse owners and renters - Other race residents 1,144 77.6% Owner occupied330 22.4% Renter occupiedHouse owners and renters - Two or more races residents 585 66.6% Owner occupied293 33.4% Renter occupiedHouse owners and renters - White alone residents 5,190 83.9% Owner occupied996 16.1% Renter occupiedHouse owners and renters - Hispanic or Latino residents 1,816 75.2% Owner occupied598 24.8% Renter occupied
Language usage in Magna
English speakers - Total 72.4% of residents of Magna speak English at home.
23.1% of residents speak Spanish at home 3,537 56.4% Speak English very well2,733 43.6% Speak English less than very well4.5% of residents speak other language at home 1,002 81.1% Speak English very well234 18.9% Speak English less than very well
English speakers - Born in the United States 81.0% of residents of Magna speak English at home.
18.5% of residents speak Spanish at home 931 88.8% Speak English very well118 11.2% Speak English less than very well1.3% of residents speak other language at home 76 100.0% Speak English very well
English speakers - Native, born elsewhere 67.0% of residents of Magna speak English at home.
27.7% of residents speak Spanish at home 79 100.0% Speak English very well
English speakers - Foreign-born 5.9% of residents of Magna speak English at home.
77.2% of residents speak Spanish at home 1,042 29.9% Speak English very well2,446 70.1% Speak English less than very well16.4% of residents speak other language at home 517 69.6% Speak English very well226 30.4% Speak English less than very well
White (Caucasian) - Speak only English Native:
97.2% (16,029)Foreign-born:
9.0% (51)
White (Caucasian) - Speak another language Native:
3.1% (514)Foreign-born:
85.2% (486)
Black or African American - Speak only English Native:
44.6% (95)Foreign-born:
35.4% (40)
Black or African American - Speak another language Native:
77.4% (164)Foreign-born:
67.6% (76)
American Indian / Alaska Native - Speak only English Native:
71.7% (70)Foreign-born:
100.0% (13)
Asian - Speak only English Native:
90.3% (117)Foreign-born:
100.0% (96)
Native Hawaiian / Pacific Islander - Speak only English Native:
49.2% (77)Foreign-born:
12.1% (39)
Native Hawaiian / Pacific Islander - Speak another language Native:
55.2% (87)Foreign-born:
90.6% (289)
Other race - Speak only English Native:
19.4% (534)Foreign-born:
0.7% (17)
Other race - Speak another language Native:
82.4% (2,274)Foreign-born:
95.7% (2,385)
Two or more races - Speak another language Native:
11.5% (352)Foreign-born:
100.0% (1,147)
White alone - Speak only English Native:
97.8% (15,171)Foreign-born:
10.8% (40)
White alone - Speak another language Native:
2.2% (345)Foreign-born:
92.7% (347)
Hispanic or Latino - Speak only English Native:
52.9% (2,910)Foreign-born:
1.2% (43)
Hispanic or Latino - Speak another language Native:
47.2% (2,595)Foreign-born:
97.2% (3,437)
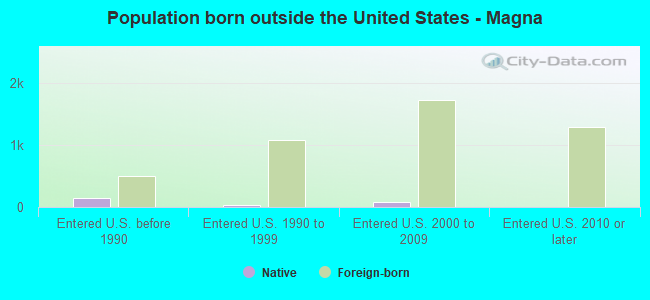
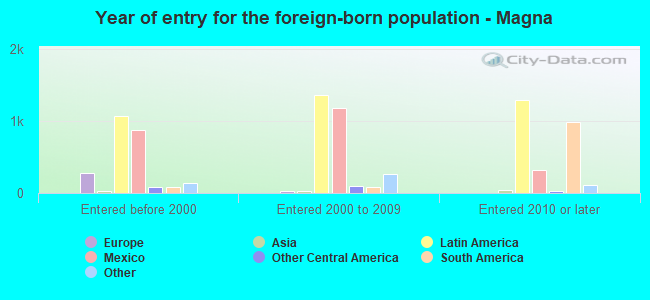
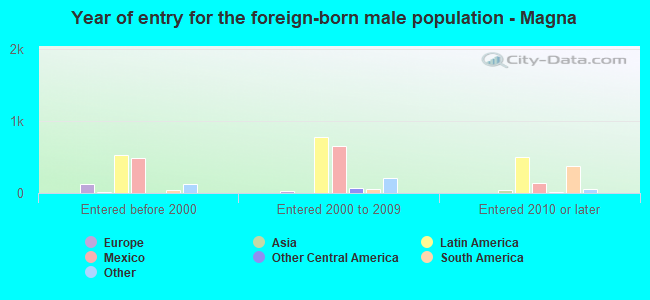
Foreign-born residents in Magna 4,654 residents are foreign born (11.9% Latin America ).
Marital status for residents in Magna Marital status - White (Caucasian) population 15 years and over
Males 32.4% Never married48.8% Now married1.1% Separated3.1% Widowed14.6% DivorcedFemales 27.6% Never married49.9% Now married2.0% Separated6.4% Widowed14.1% DivorcedWomen who gave birth in the past 12 months Now married:
60.0% (160)Unmarried:
40.0% (107)
Women who did not give birth in the past 12 months Now married:
45.8% (2,031)Unmarried:
54.2% (2,406)
Marital status - Black or African American population 15 years and over
Males 27.0% Never married56.0% Now married0.0% Separated0.0% Widowed17.0% DivorcedFemales 50.0% Never married50.0% Now married0.0% Separated0.0% Widowed0.0% DivorcedWomen who gave birth in the past 12 months Now married:
100.0% (28)Unmarried:
0.0% (0)
Women who did not give birth in the past 12 months Now married:
0.0% (0)Unmarried:
100.0% (28)
Marital status - American Indian / Alaska Native population 15 years and over
Males 57.5% Never married42.5% Now married0.0% Separated0.0% Widowed0.0% DivorcedFemales 60.0% Never married0.0% Now married0.0% Separated0.0% Widowed40.0% DivorcedWomen who did not give birth in the past 12 months Now married:
0.0% (0)Unmarried:
100.0% (40)
Marital status - Asian population 15 years and over
Males 13.8% Never married86.2% Now married0.0% Separated0.0% Widowed0.0% DivorcedFemales 16.1% Never married74.7% Now married0.0% Separated0.0% Widowed9.2% DivorcedWomen who did not give birth in the past 12 months Now married:
66.2% (44)Unmarried:
33.8% (23)
Marital status - Native Hawaiian / Pacific Islander population 15 years and over
Males 14.7% Never married74.7% Now married0.0% Separated0.0% Widowed10.7% DivorcedFemales 12.9% Never married62.2% Now married17.9% Separated0.0% Widowed7.0% DivorcedWomen who gave birth in the past 12 months Now married:
100.0% (29)Unmarried:
0.0% (0)
Women who did not give birth in the past 12 months Now married:
79.8% (118)Unmarried:
20.2% (30)
Marital status - Other race population 15 years and over
Males 40.4% Never married52.4% Now married4.1% Separated0.6% Widowed2.4% DivorcedFemales 34.7% Never married59.5% Now married3.0% Separated0.4% Widowed2.3% DivorcedWomen who gave birth in the past 12 months Now married:
100.0% (25)Unmarried:
0.0% (0)
Women who did not give birth in the past 12 months Now married:
57.7% (1,020)Unmarried:
42.3% (747)
Marital status - Two or more races population 15 years and over
Males 36.7% Never married53.8% Now married0.0% Separated3.0% Widowed6.5% DivorcedFemales 44.1% Never married44.9% Now married1.7% Separated1.5% Widowed7.8% DivorcedWomen who gave birth in the past 12 months Now married:
47.2% (22)Unmarried:
52.8% (25)
Women who did not give birth in the past 12 months Now married:
53.8% (477)Unmarried:
46.2% (410)
Marital status - White alone, not Hispanic / Latino population 15 years and over
Males 30.2% Never married50.4% Now married0.6% Separated3.3% Widowed15.4% DivorcedFemales 25.8% Never married50.6% Now married2.0% Separated6.8% Widowed14.8% DivorcedWomen who gave birth in the past 12 months Now married:
69.6% (164)Unmarried:
30.4% (72)
Women who did not give birth in the past 12 months Now married:
47.0% (1,963)Unmarried:
53.0% (2,217)
Marital status - Hispanic or Latino population 15 years and over
Males 43.3% Never married47.9% Now married3.5% Separated1.6% Widowed3.7% DivorcedFemales 38.3% Never married53.7% Now married2.6% Separated0.8% Widowed4.6% DivorcedWomen who gave birth in the past 12 months Now married:
45.7% (33)Unmarried:
54.3% (40)
Women who did not give birth in the past 12 months Now married:
54.3% (1,436)Unmarried:
45.7% (1,210)
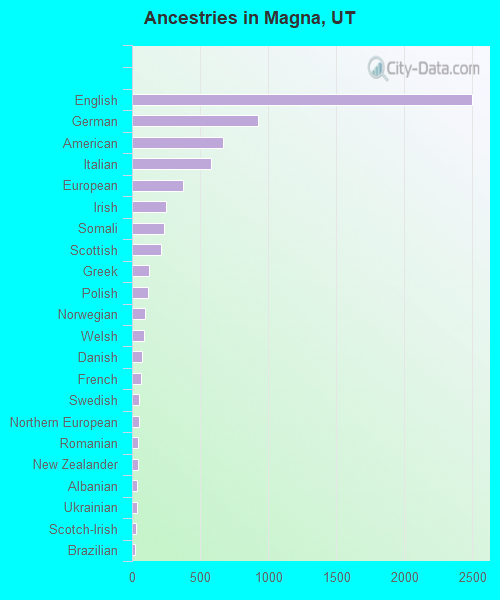
Ancestries in Magna
2,500 15.7% English925 5.8% German667 4.2% American582 3.7% Italian377 2.4% European249 1.6% Irish233 1.5% Somali212 1.3% Scottish125 0.8% Greek119 0.7% Polish93 0.6% Norwegian86 0.5% Welsh75 0.5% Danish69 0.4% French55 0.3% Swedish51 0.3% Northern European45 0.3% Romanian42 0.3% New Zealander39 0.2% Albanian38 0.2% Ukrainian28 0.2% Scotch-Irish25 0.2% Brazilian22 0.1% Finnish19 0.1% Eastern European19 0.1% Iranian17 0.1% Dutch17 0.1% Swiss16 0.1% Russian16 0.1% Scandinavian9 0.06% British9 0.06% Armenian7 0.04% Yugoslavian5 0.03% French Canadian
Geographical mobility in Magna Same house 1 year ago 16,168 90.1% White (Caucasian)194 46.3% Black or African American61 62.5% American Indian / Alaska Native184 83.2% Asian422 87.9% Native Hawaiian / Pacific Islander4,894 85.2% Other race4,038 84.0% Two or more races15,002 90.4% White alone, not Hispanic / Latino8,437 84.6% Hispanic or LatinoMoved within same county 1,185 6.6% White / Caucasian116 27.6% Black or African American20 20.1% American Indian / Alaska Native34 15.2% Asian568 9.9% Other race470 9.8% Two or more races1,070 6.4% White alone, not Hispanic / Latino1,097 11.0% Hispanic or LatinoMoved within same state 262 1.5% White / Caucasian248 4.3% Other race186 3.9% Two or more races250 1.5% White alone, not Hispanic / Latino261 2.6% Hispanic or LatinoMoved from different state 239 1.3% White / Caucasian10 2.3% Black or African American14 14.1% American Indian / Alaska Native2 0.0% Other race77 1.6% Two or more races242 1.5% White alone, not Hispanic / Latino56 0.6% Hispanic or LatinoMoved from abroad 78 0.4% White19 0.4% Two or more races51 0.3% White alone, not Hispanic / Latino72 0.7% Hispanic or Latino
Children Nativity (place of birth) in Magna
Children under 6 years - Living with two parents Both parents native 1,100 100.0% NativeBoth parents foreign-born 173 71.6% Native69 28.4% Foreign-bornOne native, one foreign-born parent 152 100.0% NativeChildren under 6 years - Living with one parent Native parent 769 100.0% NativeForeign-born parent 252 100.0% NativeChildren 6 to 17 years - Living with two parents Both parents native 1,902 100.0% NativeBoth parents foreign-born 833 94.0% Native53 6.0% Foreign-bornOne native, one foreign-born parent 583 100.0% NativeChildren 6 to 17 years - Living with one parent Native parent 1,439 100.0% NativeForeign-born parent 388 58.3% Native277 41.7% Foreign-born
Grandparents responsible for own grandchildren in Magna
Grandparents (30 to 59 years) White / Caucasian 22 10.9% Responsible for grandchildren183 89.1% Not responsible for grandchildrenNative Hawaiian / Pacific Islander 45 100.0% Not responsible for grandchildrenOther race 43 100.0% Not responsible for grandchildrenTwo or more races 101 100.0% Not responsible for grandchildrenWhite alone, not Hispanic / Latino 16 7.6% Responsible for grandchildren200 92.4% Not responsible for grandchildrenHispanic or Latino 9 9.0% Responsible for grandchildren90 91.0% Not responsible for grandchildrenGrandparents (60 years and over) White / Caucasian 70 34.9% Responsible for grandchildren131 65.1% Not responsible for grandchildrenNative Hawaiian / Pacific Islander 32 100.0% Not responsible for grandchildrenOther race 66 100.0% Not responsible for grandchildrenTwo or more races 3 5.4% Responsible for grandchildren52 94.6% Not responsible for grandchildrenWhite alone, not Hispanic / Latino 71 36.3% Responsible for grandchildren124 63.7% Not responsible for grandchildrenHispanic or Latino 4 3.6% Responsible for grandchildren102 96.4% Not responsible for grandchildren