Races in Maitland, Florida (FL) Detailed Stats
Data:
Races - White alone (%)
Races - White alone (% change since 2000)
Races - Black alone (%)
Races - Black alone (% change since 2000)
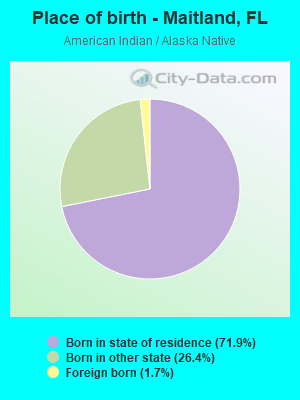
Races - American Indian alone (%)
Races - American Indian alone (% change since 2000)
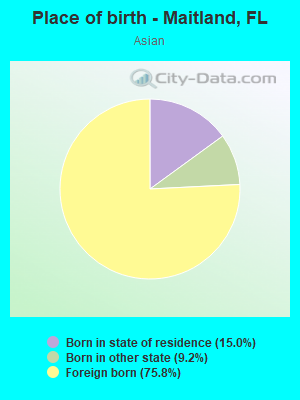
Races - Asian alone (%)
Races - Asian alone (% change since 2000)
Races - Hispanic (%)
Races - Hispanic (% change since 2000)
Races - Native Hawaiian and Other Pacific Islander alone (%)
Races - Native Hawaiian and Other Pacific Islander alone (% change since 2000)
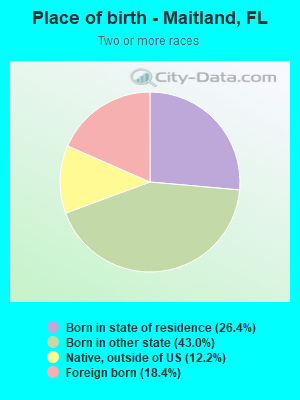
Races - Two or more races(%)
Races - Two or more races(% change since 2000)
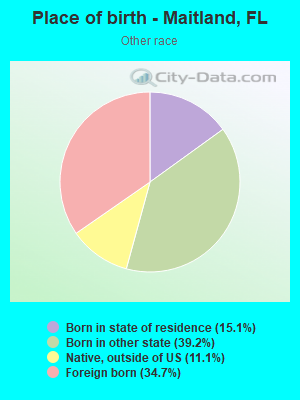
Races - Other race alone (%)
Races - Other race alone (% change since 2000)
Racial diversity
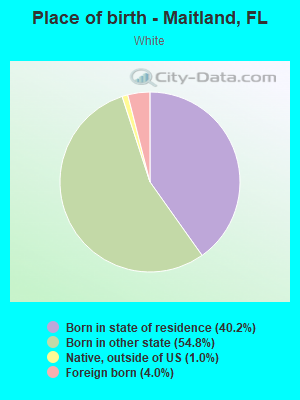
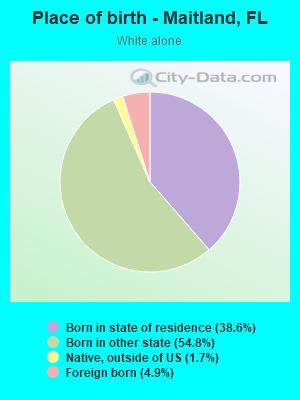
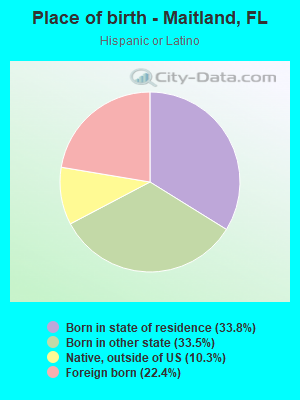
Place of birth - Born in state of residence (%)
Place of birth - Born in state of residence (%) - White
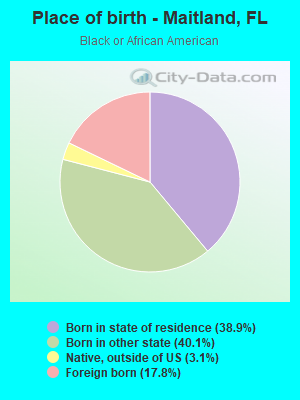
Place of birth - Born in state of residence (%) - Black or African American
Place of birth - Born in state of residence (%) - Asian
Place of birth - Born in state of residence (%) - Hispanic or Latino
Place of birth - Born in state of residence (%) - American Indian and Alaska Native
Place of birth - Born in state of residence (%) - Multirace
Place of birth - Born in state of residence (%) - Other Race
Place of birth - Born in other state (%)
Place of birth - Born in other state (%) - White
Place of birth - Born in other state (%) - Black or African American
Place of birth - Born in other state (%) - Asian
Place of birth - Born in other state (%) - Hispanic or Latino
Place of birth - Born in other state (%) - American Indian and Alaska Native
Place of birth - Born in other state (%) - Multirace
Place of birth - Born in other state (%) - Other Race
Place of birth - Native, outside of US (%)
Place of birth - Native, outside of US (%) - White
Place of birth - Native, outside of US (%) - Black or African American
Place of birth - Native, outside of US (%) - Asian
Place of birth - Native, outside of US (%) - Hispanic or Latino
Place of birth - Native, outside of US (%) - American Indian and Alaska Native
Place of birth - Native, outside of US (%) - Multirace
Place of birth - Native, outside of US (%) - Other Race
Place of birth - Foreign born (%)
Place of birth - Foreign born (%) - White
Place of birth - Foreign born (%) - Black or African American
Place of birth - Foreign born (%) - Asian
Place of birth - Foreign born (%) - Hispanic or Latino
Place of birth - Foreign born (%) - American Indian and Alaska Native
Place of birth - Foreign born (%) - Multirace
Place of birth - Foreign born (%) - Other Race
Residents speaking English at home (%)
Residents speaking English at home - Born in the United States (%)
Residents speaking English at home - Native, born elsewhere (%)
Residents speaking English at home - Foreign born (%)
Residents speaking Spanish at home (%)
Residents speaking Spanish at home - Born in the United States (%)
Residents speaking Spanish at home - Native, born elsewhere (%)
Residents speaking Spanish at home - Foreign born (%)
Residents speaking other language at home (%)
Residents speaking other language at home - Born in the United States (%)
Residents speaking other language at home - Native, born elsewhere (%)
Residents speaking other language at home - Foreign born (%)
Marital status - Never married (%)
Marital status - Now married (%)
Marital status - Separated (%)
Marital status - Widowed (%)
Marital status - Divorced (%)
Ancestries Reported - Arab (%)
Ancestries Reported - Czech (%)
Ancestries Reported - Danish (%)
Ancestries Reported - Dutch (%)
Ancestries Reported - English (%)
Ancestries Reported - French (%)
Ancestries Reported - French Canadian (%)
Ancestries Reported - German (%)
Ancestries Reported - Greek (%)
Ancestries Reported - Hungarian (%)
Ancestries Reported - Irish (%)
Ancestries Reported - Italian (%)
Ancestries Reported - Lithuanian (%)
Ancestries Reported - Norwegian (%)
Ancestries Reported - Polish (%)
Ancestries Reported - Portuguese (%)
Ancestries Reported - Russian (%)
Ancestries Reported - Scotch-Irish (%)
Ancestries Reported - Scottish (%)
Ancestries Reported - Slovak (%)
Ancestries Reported - Subsaharan African (%)
Ancestries Reported - Swedish (%)
Ancestries Reported - Swiss (%)
Ancestries Reported - Ukrainian (%)
Ancestries Reported - United States (%)
Ancestries Reported - Welsh (%)
Ancestries Reported - West Indian (%)
Ancestries Reported - Other (%)
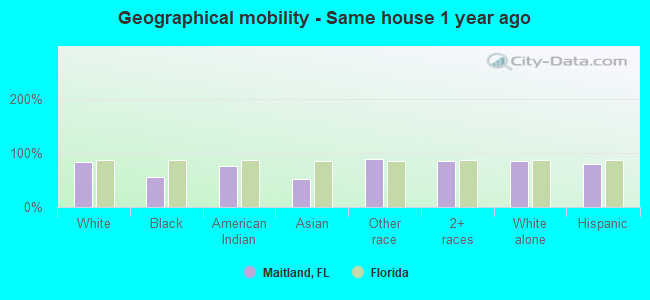
Geographical mobility - Same house 1 year ago (%)
Geographical mobility - Same house 1 year ago (%) - White
Geographical mobility - Same house 1 year ago (%) - Black or African American
Geographical mobility - Same house 1 year ago (%) - Asian
Geographical mobility - Same house 1 year ago (%) - Hispanic or Latino
Geographical mobility - Same house 1 year ago (%) - American Indian and Alaska Native
Geographical mobility - Same house 1 year ago (%) - Multirace
Geographical mobility - Same house 1 year ago (%) - Other Race
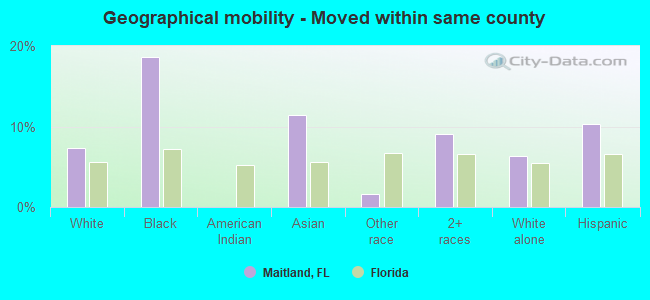
Geographical mobility - Moved within same county (%)
Geographical mobility - Moved within same county (%) - White
Geographical mobility - Moved within same county (%) - Black or African American
Geographical mobility - Moved within same county (%) - Asian
Geographical mobility - Moved within same county (%) - Hispanic or Latino
Geographical mobility - Moved within same county (%) - American Indian and Alaska Native
Geographical mobility - Moved within same county (%) - Multirace
Geographical mobility - Moved within same county (%) - Other Race
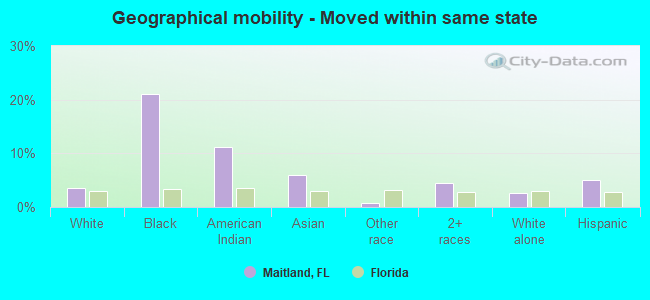
Geographical mobility - Moved from different county within same state (%)
Geographical mobility - Moved from different county within same state (%) - White
Geographical mobility - Moved from different county within same state (%) - Black or African American
Geographical mobility - Moved from different county within same state (%) - Asian
Geographical mobility - Moved from different county within same state (%) - Hispanic or Latino
Geographical mobility - Moved from different county within same state (%) - American Indian and Alaska Native
Geographical mobility - Moved from different county within same state (%) - Multirace
Geographical mobility - Moved from different county within same state (%) - Other Race
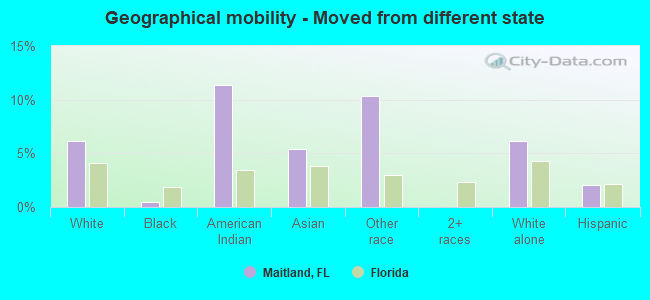
Geographical mobility - Moved from different state (%)
Geographical mobility - Moved from different state (%) - White
Geographical mobility - Moved from different state (%) - Black or African American
Geographical mobility - Moved from different state (%) - Asian
Geographical mobility - Moved from different state (%) - Hispanic or Latino
Geographical mobility - Moved from different state (%) - American Indian and Alaska Native
Geographical mobility - Moved from different state (%) - Multirace
Geographical mobility - Moved from different state (%) - Other Race
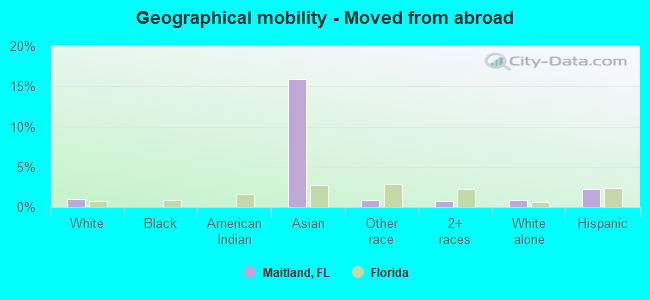
Geographical mobility - Moved from abroad (%)
Geographical mobility - Moved from abroad (%) - White
Geographical mobility - Moved from abroad (%) - Black or African American
Geographical mobility - Moved from abroad (%) - Asian
Geographical mobility - Moved from abroad (%) - Hispanic or Latino
Geographical mobility - Moved from abroad (%) - American Indian and Alaska Native
Geographical mobility - Moved from abroad (%) - Multirace
Geographical mobility - Moved from abroad (%) - Other Race
Place of birth for the foreign-born population - Ireland (%)
Place of birth for the foreign-born population - Denmark (%)
Place of birth for the foreign-born population - Norway (%)
Place of birth for the foreign-born population - Sweden (%)
Place of birth for the foreign-born population - United Kingdom (%)
Place of birth for the foreign-born population - England (%)
Place of birth for the foreign-born population - Scotland (%)
Place of birth for the foreign-born population - Other Northern Europe (%)
Place of birth for the foreign-born population - Austria (%)
Place of birth for the foreign-born population - Belgium (%)
Place of birth for the foreign-born population - France (%)
Place of birth for the foreign-born population - Germany (%)
Place of birth for the foreign-born population - Netherlands (%)
Place of birth for the foreign-born population - Switzerland (%)
Place of birth for the foreign-born population - Other Western Europe (%)
Place of birth for the foreign-born population - Greece (%)
Place of birth for the foreign-born population - Italy (%)
Place of birth for the foreign-born population - Portugal (%)
Place of birth for the foreign-born population - Spain (%)
Place of birth for the foreign-born population - Other Southern Europe (%)
Place of birth for the foreign-born population - Albania (%)
Place of birth for the foreign-born population - Belarus (%)
Place of birth for the foreign-born population - Bosnia and Herzegovina (%)
Place of birth for the foreign-born population - Bulgaria (%)
Place of birth for the foreign-born population - Croatia (%)
Place of birth for the foreign-born population - Czechoslovakia (%)
Place of birth for the foreign-born population - Hungary (%)
Place of birth for the foreign-born population - Latvia (%)
Place of birth for the foreign-born population - Lithuania (%)
Place of birth for the foreign-born population - North Macedonia (Macedonia) (%)
Place of birth for the foreign-born population - Moldova (%)
Place of birth for the foreign-born population - Poland (%)
Place of birth for the foreign-born population - Romania (%)
Place of birth for the foreign-born population - Russia (%)
Place of birth for the foreign-born population - Serbia (%)
Place of birth for the foreign-born population - Ukraine (%)
Place of birth for the foreign-born population - Other Eastern Europe (%)
Place of birth for the foreign-born population - China (%)
Place of birth for the foreign-born population - Hong Kong (%)
Place of birth for the foreign-born population - Taiwan (%)
Place of birth for the foreign-born population - Japan (%)
Place of birth for the foreign-born population - Korea (%)
Place of birth for the foreign-born population - Other Eastern Asia (%)
Place of birth for the foreign-born population - Afghanistan (%)
Place of birth for the foreign-born population - Bangladesh (%)
Place of birth for the foreign-born population - India (%)
Place of birth for the foreign-born population - Iran (%)
Place of birth for the foreign-born population - Kazakhstan (%)
Place of birth for the foreign-born population - Nepal (%)
Place of birth for the foreign-born population - Pakistan (%)
Place of birth for the foreign-born population - Sri Lanka (%)
Place of birth for the foreign-born population - Uzbekistan (%)
Place of birth for the foreign-born population - Other South Central Asia (%)
Place of birth for the foreign-born population - Burma (%)
Place of birth for the foreign-born population - Cambodia (%)
Place of birth for the foreign-born population - Indonesia (%)
Place of birth for the foreign-born population - Laos (%)
Place of birth for the foreign-born population - Malaysia (%)
Place of birth for the foreign-born population - Philippines (%)
Place of birth for the foreign-born population - Singapore (%)
Place of birth for the foreign-born population - Thailand (%)
Place of birth for the foreign-born population - Vietnam (%)
Place of birth for the foreign-born population - Other South Eastern Asia (%)
Place of birth for the foreign-born population - Armenia (%)
Place of birth for the foreign-born population - Iraq (%)
Place of birth for the foreign-born population - Israel (%)
Place of birth for the foreign-born population - Jordan (%)
Place of birth for the foreign-born population - Kuwait (%)
Place of birth for the foreign-born population - Lebanon (%)
Place of birth for the foreign-born population - Saudi Arabia (%)
Place of birth for the foreign-born population - Syria (%)
Place of birth for the foreign-born population - Turkey (%)
Place of birth for the foreign-born population - Yemen (%)
Place of birth for the foreign-born population - Other Western Asia (%)
Place of birth for the foreign-born population - Eritrea (%)
Place of birth for the foreign-born population - Ethiopia (%)
Place of birth for the foreign-born population - Kenya (%)
Place of birth for the foreign-born population - Somalia (%)
Place of birth for the foreign-born population - Uganda (%)
Place of birth for the foreign-born population - Zimbabwe (%)
Place of birth for the foreign-born population - Other Eastern Africa (%)
Place of birth for the foreign-born population - Cameroon (%)
Place of birth for the foreign-born population - Congo (%)
Place of birth for the foreign-born population - Democratic Republic of Congo (Zaire) (%)
Place of birth for the foreign-born population - Other Middle Africa (%)
Place of birth for the foreign-born population - Egypt (%)
Place of birth for the foreign-born population - Morocco (%)
Place of birth for the foreign-born population - Sudan (%)
Place of birth for the foreign-born population - Other Northern Africa (%)
Place of birth for the foreign-born population - South Africa (%)
Place of birth for the foreign-born population - Other Southern Africa (%)
Place of birth for the foreign-born population - Cabo Verde (%)
Place of birth for the foreign-born population - Ghana (%)
Place of birth for the foreign-born population - Liberia (%)
Place of birth for the foreign-born population - Nigeria (%)
Place of birth for the foreign-born population - Senegal (%)
Place of birth for the foreign-born population - Sierra Leone (%)
Place of birth for the foreign-born population - Other Western Africa (%)
Place of birth for the foreign-born population - Australia (%)
Place of birth for the foreign-born population - New Zealand (%)
Place of birth for the foreign-born population - Fiji (%)
Place of birth for the foreign-born population - Micronesia (%)
Place of birth for the foreign-born population - Bahamas (%)
Place of birth for the foreign-born population - Barbados (%)
Place of birth for the foreign-born population - Cuba (%)
Place of birth for the foreign-born population - Dominica (%)
Place of birth for the foreign-born population - Dominican Republic (%)
Place of birth for the foreign-born population - Grenada (%)
Place of birth for the foreign-born population - Haiti (%)
Place of birth for the foreign-born population - Jamaica (%)
Place of birth for the foreign-born population - St. Vincent and the Grenadines (%)
Place of birth for the foreign-born population - Trinidad and Tobago (%)
Place of birth for the foreign-born population - West Indies (%)
Place of birth for the foreign-born population - Other Caribbean (%)
Place of birth for the foreign-born population - Belize (%)
Place of birth for the foreign-born population - Costa Rica (%)
Place of birth for the foreign-born population - El Salvador (%)
Place of birth for the foreign-born population - Guatemala (%)
Place of birth for the foreign-born population - Honduras (%)
Place of birth for the foreign-born population - Mexico (%)
Place of birth for the foreign-born population - Nicaragua (%)
Place of birth for the foreign-born population - Panama (%)
Place of birth for the foreign-born population - Other Central America (%)
Place of birth for the foreign-born population - Argentina (%)
Place of birth for the foreign-born population - Bolivia (%)
Place of birth for the foreign-born population - Brazil (%)
Place of birth for the foreign-born population - Chile (%)
Place of birth for the foreign-born population - Colombia (%)
Place of birth for the foreign-born population - Ecuador (%)
Place of birth for the foreign-born population - Guyana (%)
Place of birth for the foreign-born population - Peru (%)
Place of birth for the foreign-born population - Uruguay (%)
Place of birth for the foreign-born population - Venezuela (%)
Place of birth for the foreign-born population - Other South America (%)
Place of birth for the foreign-born population - Canada (%)
Place of birth for the foreign-born population - Other Northern America (%)
Place of birth for the foreign-born population - Other (%)
Latest news about races in Maitland, FL collected exclusively by city-data.com from local newspapers, TV, and radio stations
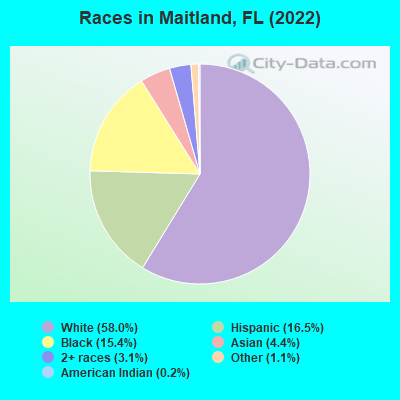
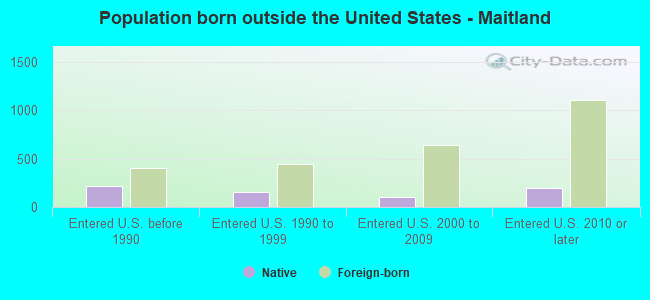
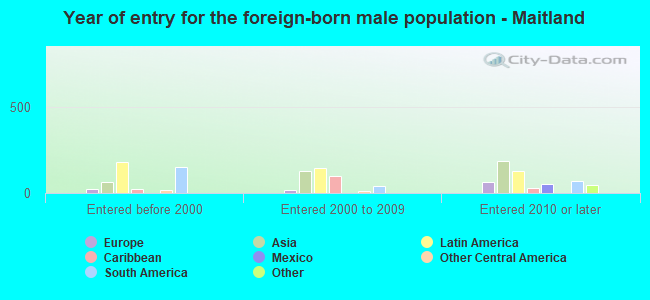
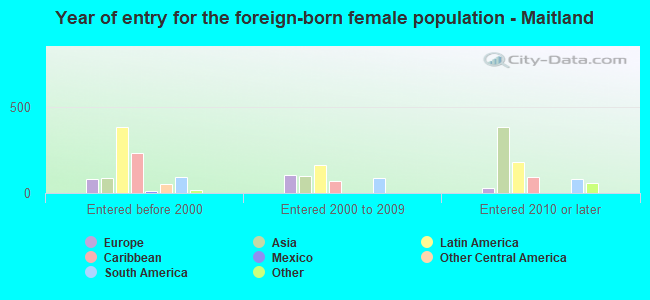
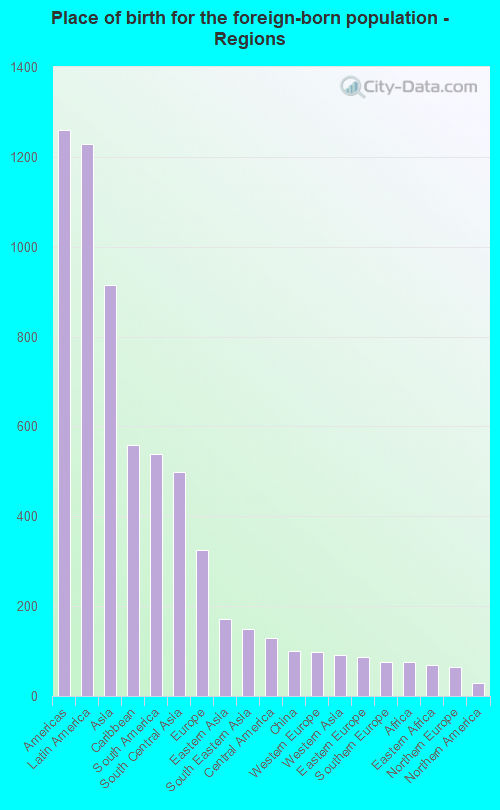
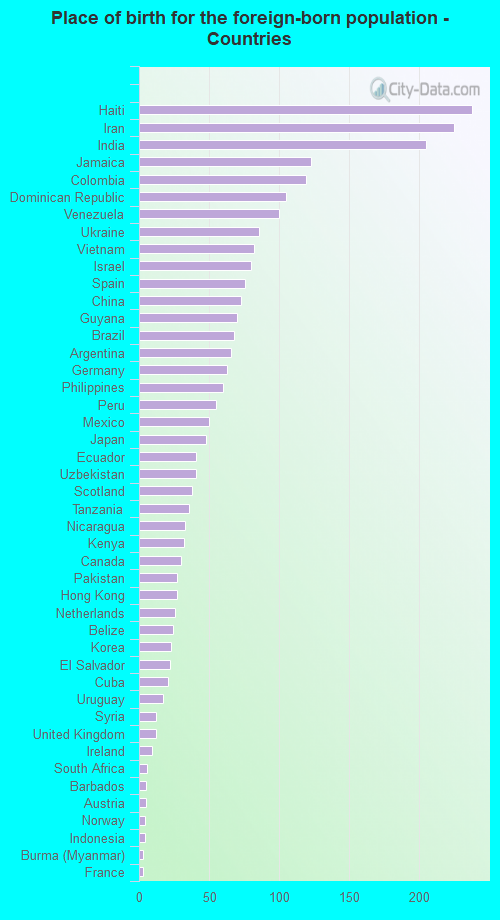
According to 2022 data, the most numerous races in Maitland, FL are White alone (11,372 residents), Hispanic (3,238 residents), and Black alone (3,015 residents). 81.0% of Maitland residents speak English at home. 13.1% of Maitland, FL residents are foreign-born (6.1% born in Latin America, 4.5% born in Asia, 1.6% born in Europe), which is 59.9% less than the foreign-born rate of 21.0% across the entire state of Florida.
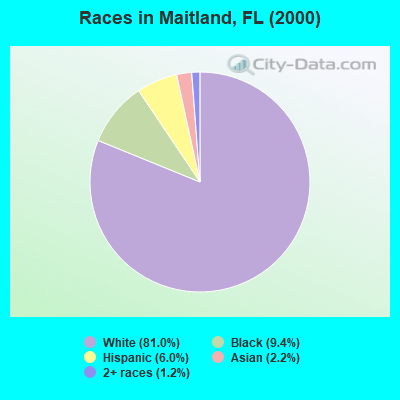
Race distribution in Maitland
2000 2022
10,458,509 65.4% White alone 2,682,715 16.8% Hispanic 2,264,268 14.2% Black alone 261,693 1.6% Asian alone 236,954 1.5% Two or more races 42,358 0.3% American Indian alone 28,994 0.2% Other race alone 6,887 0.04% Native Hawaiian and Other
11,309,403 50.8% White alone 6,025,039 27.1% Hispanic 3,241,015 14.6% Black alone 861,630 3.9% Two or more races 623,692 2.8% Asian alone 152,054 0.7% Other race alone 22,504 0.1% American Indian alone 9,486 0.04% Native Hawaiian and Other
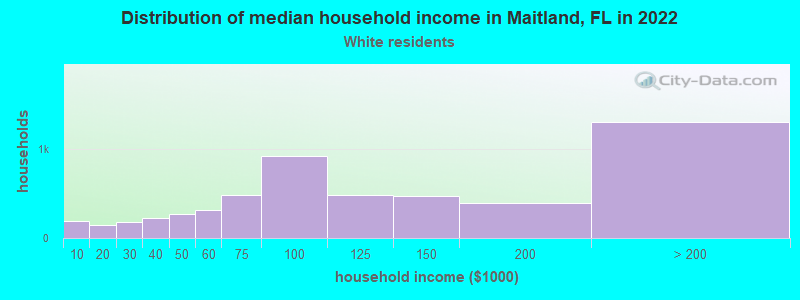
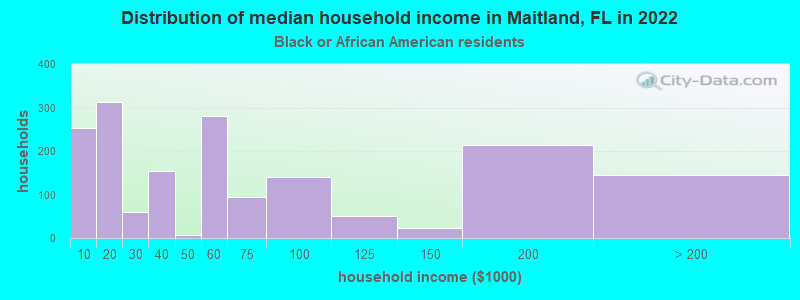
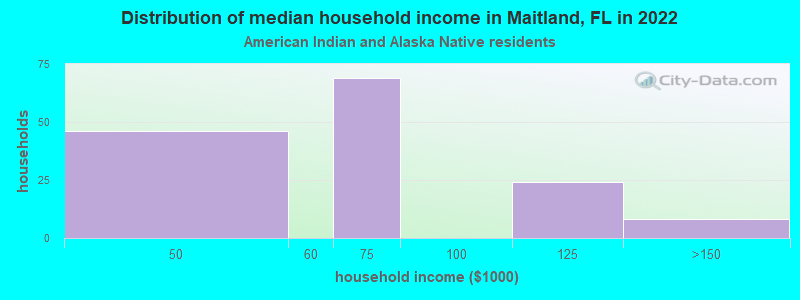
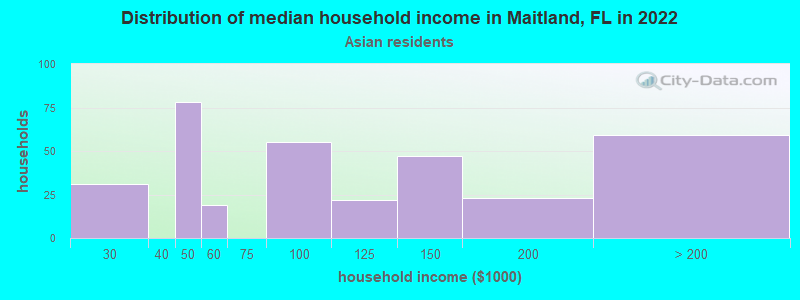
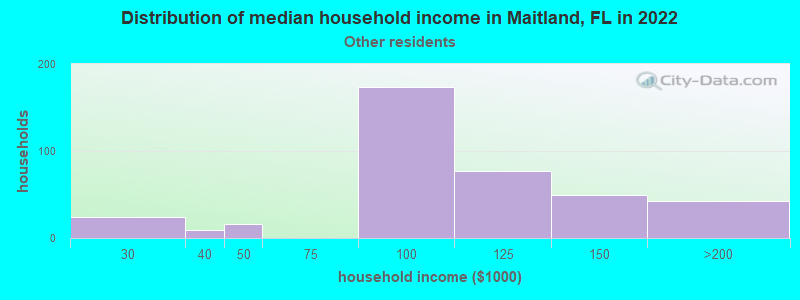
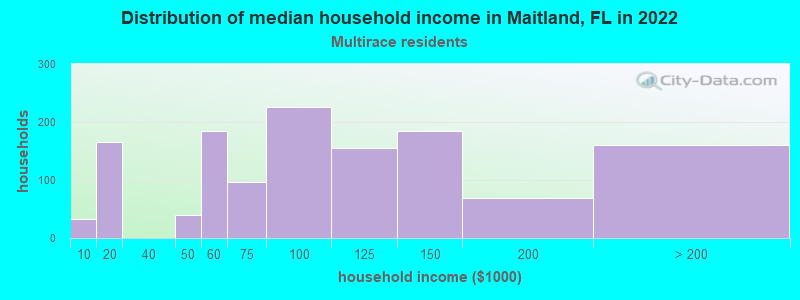
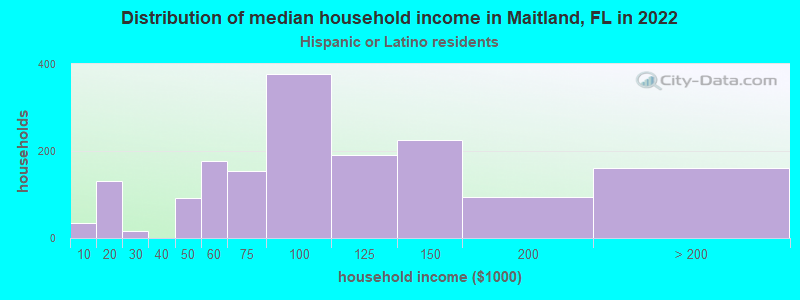
Income and house value in Maitland Median household income in 2022 $92,046 White non-Hispanic householders$56,165 Black householders$86,725 American Indian and Alaska Native householders$82,643 Asian householders$100,146 Some other race householders$90,210 Two or more races householders$97,888 Hispanic or Latino race householdersMedian 2022 house value $647,511 White Non-Hispanic householders$224,039 Black or African American householders $469,122 Asian householders$288,790 Some other race householders$256,090 Two or more races householders$407,608 Hispanic or Latino householders
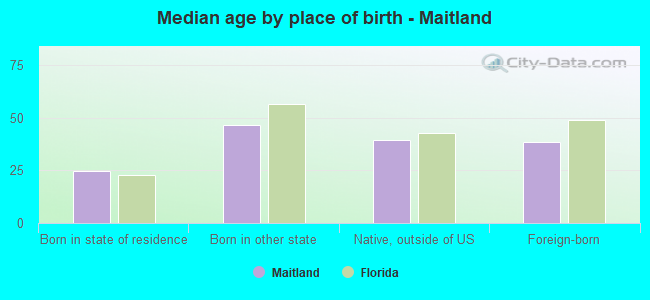
Median age by race in Maitland
43.6 Median age for White residents42.2 44.2 27.8 Median age for Black or African American residents27.6 28.0 19.7 Median age for American Indian / Alaska Native residents29.5 12.7 35.5 Median age for Asian residents33.9 37.3 -679,790,025.6 Median age for Native Hawaiian / Pacific Islander residents-1,327,635,326.3 -611,111,110.5 35.9 Median age for Other race residents35.9 36.3 33.3 Median age for Two or more races residents35.2 32.1 44.3 Median age for White alone residents42.6 45.9 33.6 Median age for Hispanic or Latino residents36.1 32.0
Owner/renter occupied households by race in Maitland
House owners and renters - White residents 2,997 56.7% Owner occupied2,290 43.3% Renter occupiedHouse owners and renters - Black or African American residents 161 9.8% Owner occupied1,486 90.2% Renter occupiedHouse owners and renters - American Indian / Alaska Native residents 130 100.0% Renter occupiedHouse owners and renters - Asian residents 141 38.5% Owner occupied225 61.5% Renter occupiedHouse owners and renters - Other race residents 228 57.2% Owner occupied171 42.8% Renter occupiedHouse owners and renters - Two or more races residents 534 41.4% Owner occupied758 58.6% Renter occupiedHouse owners and renters - White alone residents 3,200 57.0% Owner occupied2,410 43.0% Renter occupiedHouse owners and renters - Hispanic or Latino residents 582 36.4% Owner occupied1,017 63.6% Renter occupied
Language usage in Maitland
English speakers - Total 81.0% of residents of Maitland speak English at home.
10.4% of residents speak Spanish at home 1,742 88.5% Speak English very well226 11.5% Speak English less than very well8.8% of residents speak other language at home 1,218 73.2% Speak English very well446 26.8% Speak English less than very well
English speakers - Born in the United States 90.0% of residents of Maitland speak English at home.
8.1% of residents speak Spanish at home 733 100.0% Speak English very well1.7% of residents speak other language at home 157 100.0% Speak English very well
English speakers - Native, born elsewhere 45.2% of residents of Maitland speak English at home.
49.2% of residents speak Spanish at home 271 84.7% Speak English very well49 15.3% Speak English less than very well7.8% of residents speak other language at home 51 100.0% Speak English very well
English speakers - Foreign-born 25.7% of residents of Maitland speak English at home.
25.6% of residents speak Spanish at home 529 79.0% Speak English very well141 21.0% Speak English less than very well48.2% of residents speak other language at home 828 65.7% Speak English very well433 34.3% Speak English less than very well
White (Caucasian) - Speak only English Native:
100.0% (9,918)Foreign-born:
29.5% (129)
White (Caucasian) - Speak another language Native:
2.7% (265)Foreign-born:
72.5% (317)
Black or African American - Speak only English Native:
90.9% (2,165)Foreign-born:
57.0% (310)
Black or African American - Speak another language Native:
8.8% (210)Foreign-born:
44.5% (242)
American Indian / Alaska Native - Speak only English Native:
59.7% (321)Foreign-born:
100.0% (6)
Asian - Speak only English Native:
100.0% (171)Foreign-born:
18.5% (120)
Asian - Speak another language Native:
1.7% (3)Foreign-born:
80.8% (524)
Other race - Speak only English Native:
27.6% (160)Foreign-born:
12.4% (47)
Other race - Speak another language Native:
71.8% (416)Foreign-born:
85.6% (326)
Two or more races - Speak only English Native:
59.9% (1,196)Foreign-born:
5.9% (28)
Two or more races - Speak another language Native:
39.3% (785)Foreign-born:
94.2% (440)
White alone - Speak only English Native:
97.2% (10,204)Foreign-born:
24.0% (133)
White alone - Speak another language Native:
2.9% (307)Foreign-born:
76.1% (421)
Hispanic or Latino - Speak only English Native:
59.5% (1,418)Foreign-born:
11.5% (86)
Hispanic or Latino - Speak another language Native:
44.9% (1,070)Foreign-born:
87.5% (653)
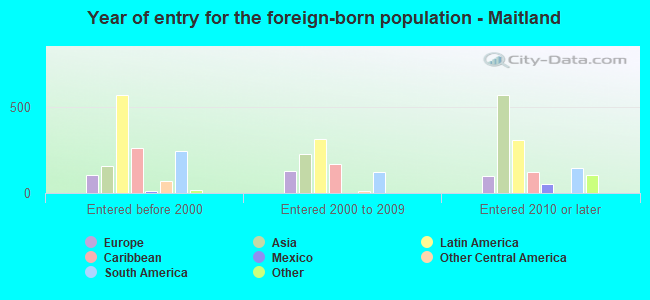
Foreign-born residents in Maitland 2,575 residents are foreign born (6.1% Latin America , 4.5% Asia , 1.6% Europe ).
This city:
13.1%Florida:
21.1%
Marital status for residents in Maitland Marital status - White (Caucasian) population 15 years and over
Males 36.1% Never married54.1% Now married1.9% Separated0.2% Widowed7.7% DivorcedFemales 32.1% Never married45.6% Now married0.7% Separated6.1% Widowed15.5% DivorcedWomen who gave birth in the past 12 months Now married:
85.3% (94)Unmarried:
14.7% (16)
Women who did not give birth in the past 12 months Now married:
37.0% (921)Unmarried:
63.0% (1,569)
Marital status - Black or African American population 15 years and over
Males 76.8% Never married13.9% Now married0.9% Separated1.8% Widowed6.6% DivorcedFemales 59.4% Never married12.7% Now married1.7% Separated8.8% Widowed17.3% DivorcedWomen who did not give birth in the past 12 months Now married:
9.7% (99)Unmarried:
90.3% (924)
Marital status - American Indian / Alaska Native population 15 years and over
Males 57.4% Never married42.6% Now married0.0% Separated0.0% Widowed0.0% DivorcedFemales 71.7% Never married28.3% Now married0.0% Separated0.0% Widowed0.0% DivorcedWomen who did not give birth in the past 12 months Now married:
7.3% (10)Unmarried:
92.7% (124)
Marital status - Asian population 15 years and over
Males 33.8% Never married57.5% Now married0.0% Separated3.3% Widowed5.4% DivorcedFemales 14.9% Never married76.8% Now married0.0% Separated5.2% Widowed3.0% DivorcedWomen who gave birth in the past 12 months Now married:
100.0% (35)Unmarried:
0.0% (0)
Women who did not give birth in the past 12 months Now married:
85.1% (203)Unmarried:
14.9% (35)
Marital status - Other race population 15 years and over
Males 35.7% Never married58.4% Now married0.0% Separated0.0% Widowed5.9% DivorcedFemales 22.0% Never married61.9% Now married11.0% Separated0.0% Widowed5.1% DivorcedWomen who did not give birth in the past 12 months Now married:
69.9% (237)Unmarried:
30.1% (102)
Marital status - Two or more races population 15 years and over
Males 41.2% Never married58.1% Now married0.0% Separated0.0% Widowed0.7% DivorcedFemales 42.0% Never married41.6% Now married1.6% Separated3.8% Widowed10.9% DivorcedWomen who gave birth in the past 12 months Now married:
73.5% (103)Unmarried:
26.5% (37)
Women who did not give birth in the past 12 months Now married:
31.5% (218)Unmarried:
68.5% (473)
Marital status - White alone, not Hispanic / Latino population 15 years and over
Males 35.1% Never married55.3% Now married2.1% Separated0.2% Widowed7.3% DivorcedFemales 31.5% Never married45.6% Now married0.3% Separated6.4% Widowed16.1% DivorcedWomen who gave birth in the past 12 months Now married:
85.3% (112)Unmarried:
14.7% (19)
Women who did not give birth in the past 12 months Now married:
36.2% (991)Unmarried:
63.8% (1,744)
Marital status - Hispanic or Latino population 15 years and over
Males 41.5% Never married52.9% Now married0.0% Separated0.0% Widowed5.6% DivorcedFemales 37.8% Never married45.6% Now married5.8% Separated2.3% Widowed8.6% DivorcedWomen who gave birth in the past 12 months Now married:
65.3% (50)Unmarried:
34.7% (26)
Women who did not give birth in the past 12 months Now married:
46.3% (427)Unmarried:
53.7% (496)
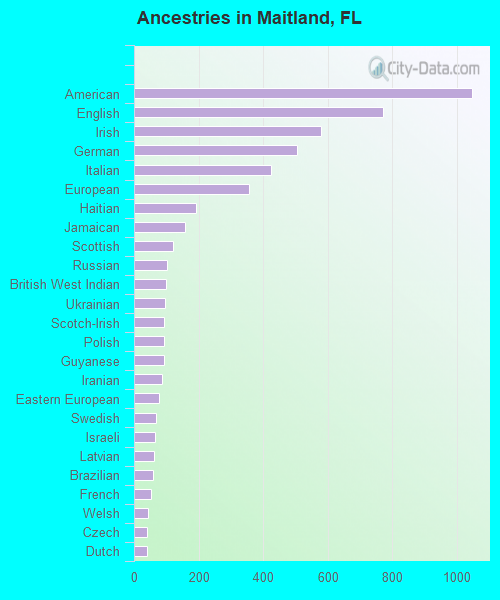
Ancestries in Maitland
1,047 10.6% American770 7.8% English578 5.8% Irish504 5.1% German423 4.3% Italian355 3.6% European192 1.9% Haitian157 1.6% Jamaican121 1.2% Scottish102 1.0% Russian99 1.0% British West Indian96 1.0% Ukrainian93 0.9% Scotch-Irish92 0.9% Polish92 0.9% Guyanese87 0.9% Iranian77 0.8% Eastern European68 0.7% Swedish64 0.6% Israeli61 0.6% Latvian58 0.6% Brazilian52 0.5% French44 0.4% Welsh40 0.4% Czech39 0.4% Dutch25 0.3% Swiss23 0.2% Belizean21 0.2% Northern European18 0.2% British13 0.1% Portuguese12 0.1% Scandinavian12 0.1% Czechoslovakian10 0.1% Austrian9 0.09% Barbadian9 0.09% Norwegian8 0.08% Lebanese6 0.06% Romanian4 0.04% Danish4 0.04% Canadian3 0.03% Finnish1 0.01% French Canadian
Geographical mobility in Maitland Same house 1 year ago 8,451 82.3% White (Caucasian)1,698 55.9% Black or African American365 75.0% American Indian / Alaska Native437 52.2% Asian869 88.8% Other race2,162 84.8% Two or more races9,481 84.2% White alone, not Hispanic / Latino2,513 79.5% Hispanic or LatinoMoved within same county 748 7.3% White / Caucasian568 18.7% Black or African American96 11.4% Asian16 1.6% Other race231 9.1% Two or more races716 6.4% White alone, not Hispanic / Latino326 10.3% Hispanic or LatinoMoved within same state 356 3.5% White / Caucasian640 21.1% Black or African American54 11.1% American Indian / Alaska Native49 5.9% Asian8 0.8% Other race115 4.5% Two or more races290 2.6% White alone, not Hispanic / Latino160 5.0% Hispanic or LatinoMoved from different state 633 6.2% White / Caucasian14 0.5% Black or African American55 11.3% American Indian / Alaska Native45 5.4% Asian101 10.3% Other race694 6.2% White alone, not Hispanic / Latino65 2.1% Hispanic or LatinoMoved from abroad 101 1.0% White133 15.9% Asian9 0.9% Other race20 0.8% Two or more races102 0.9% White alone, not Hispanic / Latino69 2.2% Hispanic or Latino
Children Nativity (place of birth) in Maitland
Children under 6 years - Living with two parents Both parents native 430 100.0% NativeBoth parents foreign-born 45 81.8% Native10 18.2% Foreign-bornOne native, one foreign-born parent 137 100.0% NativeChildren under 6 years - Living with one parent Native parent 162 100.0% NativeForeign-born parent 32 100.0% NativeChildren 6 to 17 years - Living with two parents Both parents native 1,401 99.5% Native7 0.5% Foreign-bornBoth parents foreign-born 129 80.1% Native32 19.9% Foreign-bornOne native, one foreign-born parent 148 100.0% NativeChildren 6 to 17 years - Living with one parent Native parent 606 100.0% NativeForeign-born parent 142 63.0% Native84 37.0% Foreign-born