Races in Maltby, Washington (WA) Detailed Stats
Data:
Races - White alone (%)
Races - White alone (% change since 2000)
Races - Black alone (%)
Races - Black alone (% change since 2000)
Races - American Indian alone (%)
Races - American Indian alone (% change since 2000)
Races - Asian alone (%)
Races - Asian alone (% change since 2000)
Races - Hispanic (%)
Races - Hispanic (% change since 2000)
Races - Native Hawaiian and Other Pacific Islander alone (%)
Races - Native Hawaiian and Other Pacific Islander alone (% change since 2000)
Races - Two or more races(%)
Races - Two or more races(% change since 2000)
Races - Other race alone (%)
Races - Other race alone (% change since 2000)
Racial diversity
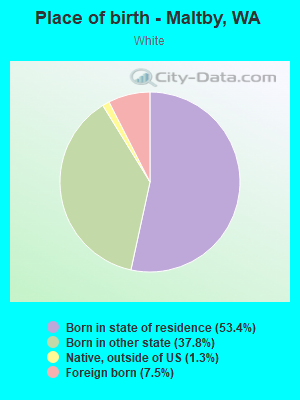
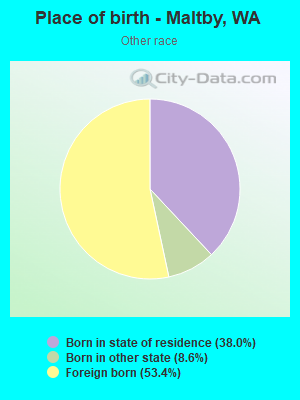
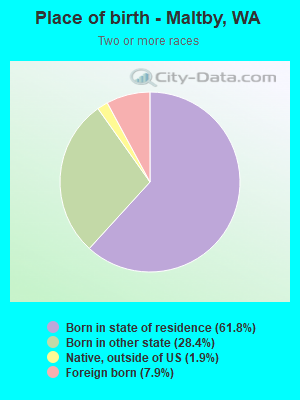
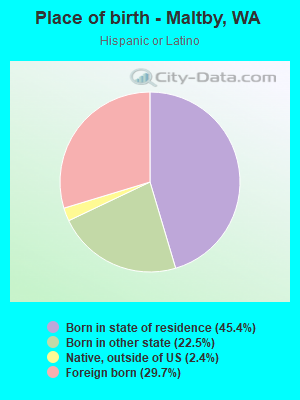
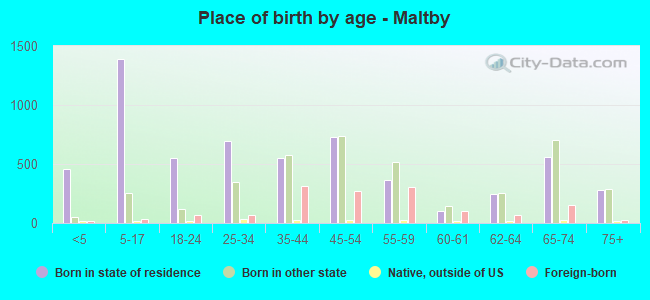
Place of birth - Born in state of residence (%)
Place of birth - Born in state of residence (%) - White
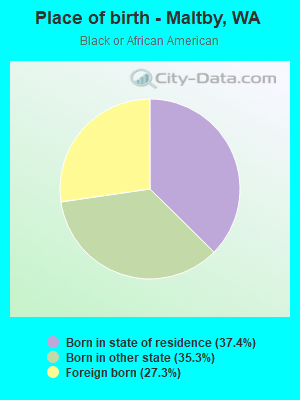
Place of birth - Born in state of residence (%) - Black or African American
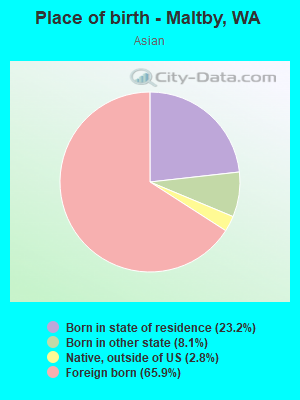
Place of birth - Born in state of residence (%) - Asian
Place of birth - Born in state of residence (%) - Hispanic or Latino
Place of birth - Born in state of residence (%) - American Indian and Alaska Native
Place of birth - Born in state of residence (%) - Multirace
Place of birth - Born in state of residence (%) - Other Race
Place of birth - Born in other state (%)
Place of birth - Born in other state (%) - White
Place of birth - Born in other state (%) - Black or African American
Place of birth - Born in other state (%) - Asian
Place of birth - Born in other state (%) - Hispanic or Latino
Place of birth - Born in other state (%) - American Indian and Alaska Native
Place of birth - Born in other state (%) - Multirace
Place of birth - Born in other state (%) - Other Race
Place of birth - Native, outside of US (%)
Place of birth - Native, outside of US (%) - White
Place of birth - Native, outside of US (%) - Black or African American
Place of birth - Native, outside of US (%) - Asian
Place of birth - Native, outside of US (%) - Hispanic or Latino
Place of birth - Native, outside of US (%) - American Indian and Alaska Native
Place of birth - Native, outside of US (%) - Multirace
Place of birth - Native, outside of US (%) - Other Race
Place of birth - Foreign born (%)
Place of birth - Foreign born (%) - White
Place of birth - Foreign born (%) - Black or African American
Place of birth - Foreign born (%) - Asian
Place of birth - Foreign born (%) - Hispanic or Latino
Place of birth - Foreign born (%) - American Indian and Alaska Native
Place of birth - Foreign born (%) - Multirace
Place of birth - Foreign born (%) - Other Race
Residents speaking English at home (%)
Residents speaking English at home - Born in the United States (%)
Residents speaking English at home - Native, born elsewhere (%)
Residents speaking English at home - Foreign born (%)
Residents speaking Spanish at home (%)
Residents speaking Spanish at home - Born in the United States (%)
Residents speaking Spanish at home - Native, born elsewhere (%)
Residents speaking Spanish at home - Foreign born (%)
Residents speaking other language at home (%)
Residents speaking other language at home - Born in the United States (%)
Residents speaking other language at home - Native, born elsewhere (%)
Residents speaking other language at home - Foreign born (%)
Marital status - Never married (%)
Marital status - Now married (%)
Marital status - Separated (%)
Marital status - Widowed (%)
Marital status - Divorced (%)
Ancestries Reported - Arab (%)
Ancestries Reported - Czech (%)
Ancestries Reported - Danish (%)
Ancestries Reported - Dutch (%)
Ancestries Reported - English (%)
Ancestries Reported - French (%)
Ancestries Reported - French Canadian (%)
Ancestries Reported - German (%)
Ancestries Reported - Greek (%)
Ancestries Reported - Hungarian (%)
Ancestries Reported - Irish (%)
Ancestries Reported - Italian (%)
Ancestries Reported - Lithuanian (%)
Ancestries Reported - Norwegian (%)
Ancestries Reported - Polish (%)
Ancestries Reported - Portuguese (%)
Ancestries Reported - Russian (%)
Ancestries Reported - Scotch-Irish (%)
Ancestries Reported - Scottish (%)
Ancestries Reported - Slovak (%)
Ancestries Reported - Subsaharan African (%)
Ancestries Reported - Swedish (%)
Ancestries Reported - Swiss (%)
Ancestries Reported - Ukrainian (%)
Ancestries Reported - United States (%)
Ancestries Reported - Welsh (%)
Ancestries Reported - West Indian (%)
Ancestries Reported - Other (%)
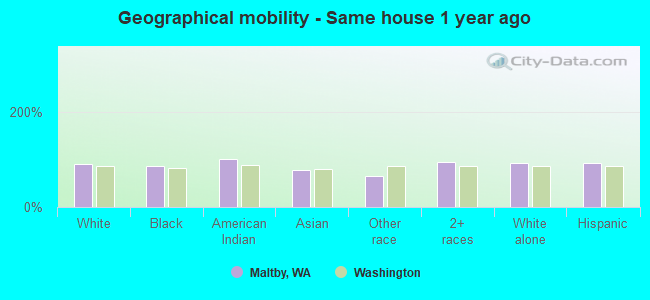
Geographical mobility - Same house 1 year ago (%)
Geographical mobility - Same house 1 year ago (%) - White
Geographical mobility - Same house 1 year ago (%) - Black or African American
Geographical mobility - Same house 1 year ago (%) - Asian
Geographical mobility - Same house 1 year ago (%) - Hispanic or Latino
Geographical mobility - Same house 1 year ago (%) - American Indian and Alaska Native
Geographical mobility - Same house 1 year ago (%) - Multirace
Geographical mobility - Same house 1 year ago (%) - Other Race
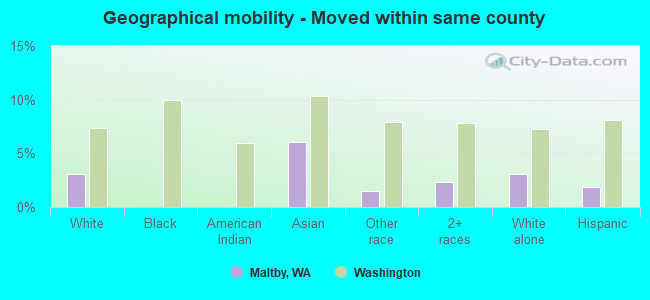
Geographical mobility - Moved within same county (%)
Geographical mobility - Moved within same county (%) - White
Geographical mobility - Moved within same county (%) - Black or African American
Geographical mobility - Moved within same county (%) - Asian
Geographical mobility - Moved within same county (%) - Hispanic or Latino
Geographical mobility - Moved within same county (%) - American Indian and Alaska Native
Geographical mobility - Moved within same county (%) - Multirace
Geographical mobility - Moved within same county (%) - Other Race
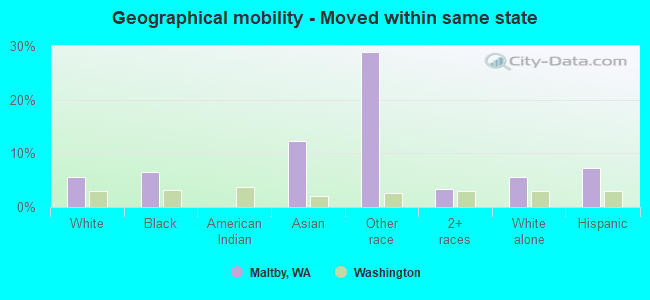
Geographical mobility - Moved from different county within same state (%)
Geographical mobility - Moved from different county within same state (%) - White
Geographical mobility - Moved from different county within same state (%) - Black or African American
Geographical mobility - Moved from different county within same state (%) - Asian
Geographical mobility - Moved from different county within same state (%) - Hispanic or Latino
Geographical mobility - Moved from different county within same state (%) - American Indian and Alaska Native
Geographical mobility - Moved from different county within same state (%) - Multirace
Geographical mobility - Moved from different county within same state (%) - Other Race
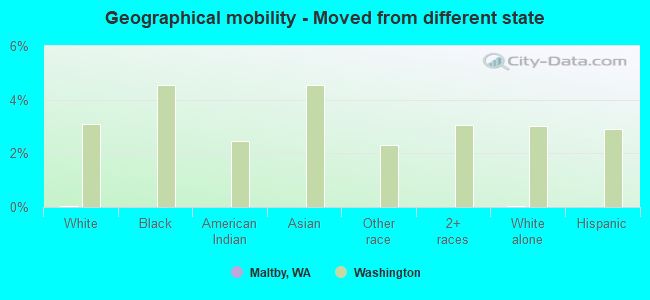
Geographical mobility - Moved from different state (%)
Geographical mobility - Moved from different state (%) - White
Geographical mobility - Moved from different state (%) - Black or African American
Geographical mobility - Moved from different state (%) - Asian
Geographical mobility - Moved from different state (%) - Hispanic or Latino
Geographical mobility - Moved from different state (%) - American Indian and Alaska Native
Geographical mobility - Moved from different state (%) - Multirace
Geographical mobility - Moved from different state (%) - Other Race
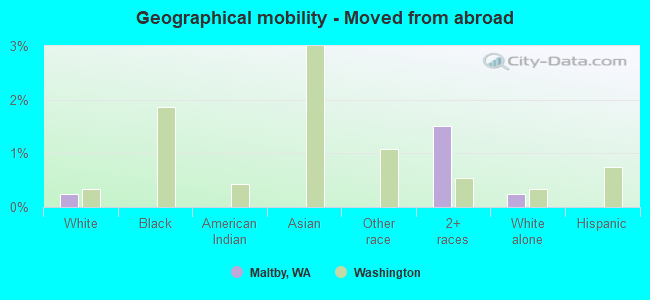
Geographical mobility - Moved from abroad (%)
Geographical mobility - Moved from abroad (%) - White
Geographical mobility - Moved from abroad (%) - Black or African American
Geographical mobility - Moved from abroad (%) - Asian
Geographical mobility - Moved from abroad (%) - Hispanic or Latino
Geographical mobility - Moved from abroad (%) - American Indian and Alaska Native
Geographical mobility - Moved from abroad (%) - Multirace
Geographical mobility - Moved from abroad (%) - Other Race
Place of birth for the foreign-born population - Ireland (%)
Place of birth for the foreign-born population - Denmark (%)
Place of birth for the foreign-born population - Norway (%)
Place of birth for the foreign-born population - Sweden (%)
Place of birth for the foreign-born population - United Kingdom (%)
Place of birth for the foreign-born population - England (%)
Place of birth for the foreign-born population - Scotland (%)
Place of birth for the foreign-born population - Other Northern Europe (%)
Place of birth for the foreign-born population - Austria (%)
Place of birth for the foreign-born population - Belgium (%)
Place of birth for the foreign-born population - France (%)
Place of birth for the foreign-born population - Germany (%)
Place of birth for the foreign-born population - Netherlands (%)
Place of birth for the foreign-born population - Switzerland (%)
Place of birth for the foreign-born population - Other Western Europe (%)
Place of birth for the foreign-born population - Greece (%)
Place of birth for the foreign-born population - Italy (%)
Place of birth for the foreign-born population - Portugal (%)
Place of birth for the foreign-born population - Spain (%)
Place of birth for the foreign-born population - Other Southern Europe (%)
Place of birth for the foreign-born population - Albania (%)
Place of birth for the foreign-born population - Belarus (%)
Place of birth for the foreign-born population - Bosnia and Herzegovina (%)
Place of birth for the foreign-born population - Bulgaria (%)
Place of birth for the foreign-born population - Croatia (%)
Place of birth for the foreign-born population - Czechoslovakia (%)
Place of birth for the foreign-born population - Hungary (%)
Place of birth for the foreign-born population - Latvia (%)
Place of birth for the foreign-born population - Lithuania (%)
Place of birth for the foreign-born population - North Macedonia (Macedonia) (%)
Place of birth for the foreign-born population - Moldova (%)
Place of birth for the foreign-born population - Poland (%)
Place of birth for the foreign-born population - Romania (%)
Place of birth for the foreign-born population - Russia (%)
Place of birth for the foreign-born population - Serbia (%)
Place of birth for the foreign-born population - Ukraine (%)
Place of birth for the foreign-born population - Other Eastern Europe (%)
Place of birth for the foreign-born population - China (%)
Place of birth for the foreign-born population - Hong Kong (%)
Place of birth for the foreign-born population - Taiwan (%)
Place of birth for the foreign-born population - Japan (%)
Place of birth for the foreign-born population - Korea (%)
Place of birth for the foreign-born population - Other Eastern Asia (%)
Place of birth for the foreign-born population - Afghanistan (%)
Place of birth for the foreign-born population - Bangladesh (%)
Place of birth for the foreign-born population - India (%)
Place of birth for the foreign-born population - Iran (%)
Place of birth for the foreign-born population - Kazakhstan (%)
Place of birth for the foreign-born population - Nepal (%)
Place of birth for the foreign-born population - Pakistan (%)
Place of birth for the foreign-born population - Sri Lanka (%)
Place of birth for the foreign-born population - Uzbekistan (%)
Place of birth for the foreign-born population - Other South Central Asia (%)
Place of birth for the foreign-born population - Burma (%)
Place of birth for the foreign-born population - Cambodia (%)
Place of birth for the foreign-born population - Indonesia (%)
Place of birth for the foreign-born population - Laos (%)
Place of birth for the foreign-born population - Malaysia (%)
Place of birth for the foreign-born population - Philippines (%)
Place of birth for the foreign-born population - Singapore (%)
Place of birth for the foreign-born population - Thailand (%)
Place of birth for the foreign-born population - Vietnam (%)
Place of birth for the foreign-born population - Other South Eastern Asia (%)
Place of birth for the foreign-born population - Armenia (%)
Place of birth for the foreign-born population - Iraq (%)
Place of birth for the foreign-born population - Israel (%)
Place of birth for the foreign-born population - Jordan (%)
Place of birth for the foreign-born population - Kuwait (%)
Place of birth for the foreign-born population - Lebanon (%)
Place of birth for the foreign-born population - Saudi Arabia (%)
Place of birth for the foreign-born population - Syria (%)
Place of birth for the foreign-born population - Turkey (%)
Place of birth for the foreign-born population - Yemen (%)
Place of birth for the foreign-born population - Other Western Asia (%)
Place of birth for the foreign-born population - Eritrea (%)
Place of birth for the foreign-born population - Ethiopia (%)
Place of birth for the foreign-born population - Kenya (%)
Place of birth for the foreign-born population - Somalia (%)
Place of birth for the foreign-born population - Uganda (%)
Place of birth for the foreign-born population - Zimbabwe (%)
Place of birth for the foreign-born population - Other Eastern Africa (%)
Place of birth for the foreign-born population - Cameroon (%)
Place of birth for the foreign-born population - Congo (%)
Place of birth for the foreign-born population - Democratic Republic of Congo (Zaire) (%)
Place of birth for the foreign-born population - Other Middle Africa (%)
Place of birth for the foreign-born population - Egypt (%)
Place of birth for the foreign-born population - Morocco (%)
Place of birth for the foreign-born population - Sudan (%)
Place of birth for the foreign-born population - Other Northern Africa (%)
Place of birth for the foreign-born population - South Africa (%)
Place of birth for the foreign-born population - Other Southern Africa (%)
Place of birth for the foreign-born population - Cabo Verde (%)
Place of birth for the foreign-born population - Ghana (%)
Place of birth for the foreign-born population - Liberia (%)
Place of birth for the foreign-born population - Nigeria (%)
Place of birth for the foreign-born population - Senegal (%)
Place of birth for the foreign-born population - Sierra Leone (%)
Place of birth for the foreign-born population - Other Western Africa (%)
Place of birth for the foreign-born population - Australia (%)
Place of birth for the foreign-born population - New Zealand (%)
Place of birth for the foreign-born population - Fiji (%)
Place of birth for the foreign-born population - Micronesia (%)
Place of birth for the foreign-born population - Bahamas (%)
Place of birth for the foreign-born population - Barbados (%)
Place of birth for the foreign-born population - Cuba (%)
Place of birth for the foreign-born population - Dominica (%)
Place of birth for the foreign-born population - Dominican Republic (%)
Place of birth for the foreign-born population - Grenada (%)
Place of birth for the foreign-born population - Haiti (%)
Place of birth for the foreign-born population - Jamaica (%)
Place of birth for the foreign-born population - St. Vincent and the Grenadines (%)
Place of birth for the foreign-born population - Trinidad and Tobago (%)
Place of birth for the foreign-born population - West Indies (%)
Place of birth for the foreign-born population - Other Caribbean (%)
Place of birth for the foreign-born population - Belize (%)
Place of birth for the foreign-born population - Costa Rica (%)
Place of birth for the foreign-born population - El Salvador (%)
Place of birth for the foreign-born population - Guatemala (%)
Place of birth for the foreign-born population - Honduras (%)
Place of birth for the foreign-born population - Mexico (%)
Place of birth for the foreign-born population - Nicaragua (%)
Place of birth for the foreign-born population - Panama (%)
Place of birth for the foreign-born population - Other Central America (%)
Place of birth for the foreign-born population - Argentina (%)
Place of birth for the foreign-born population - Bolivia (%)
Place of birth for the foreign-born population - Brazil (%)
Place of birth for the foreign-born population - Chile (%)
Place of birth for the foreign-born population - Colombia (%)
Place of birth for the foreign-born population - Ecuador (%)
Place of birth for the foreign-born population - Guyana (%)
Place of birth for the foreign-born population - Peru (%)
Place of birth for the foreign-born population - Uruguay (%)
Place of birth for the foreign-born population - Venezuela (%)
Place of birth for the foreign-born population - Other South America (%)
Place of birth for the foreign-born population - Canada (%)
Place of birth for the foreign-born population - Other Northern America (%)
Place of birth for the foreign-born population - Other (%)
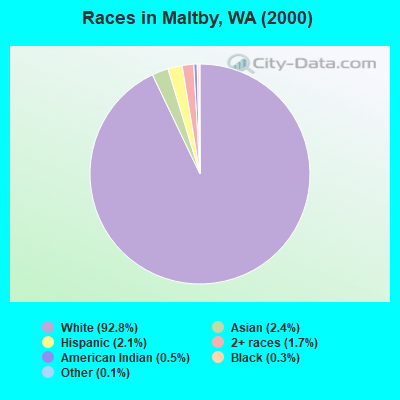
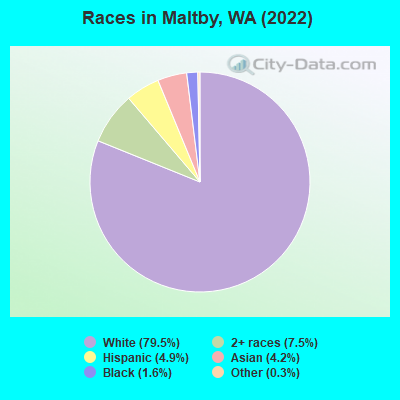
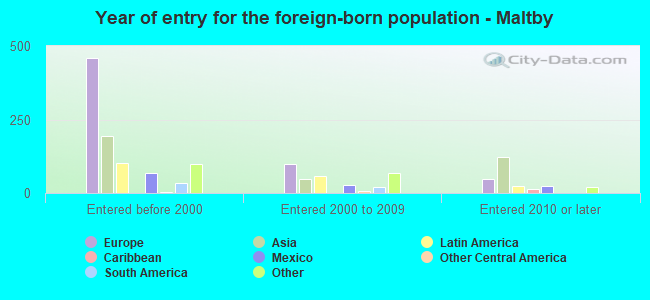
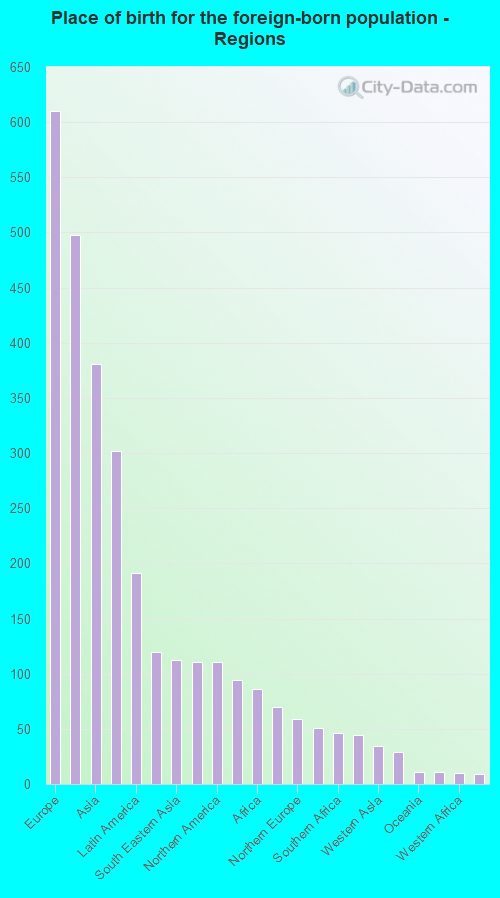
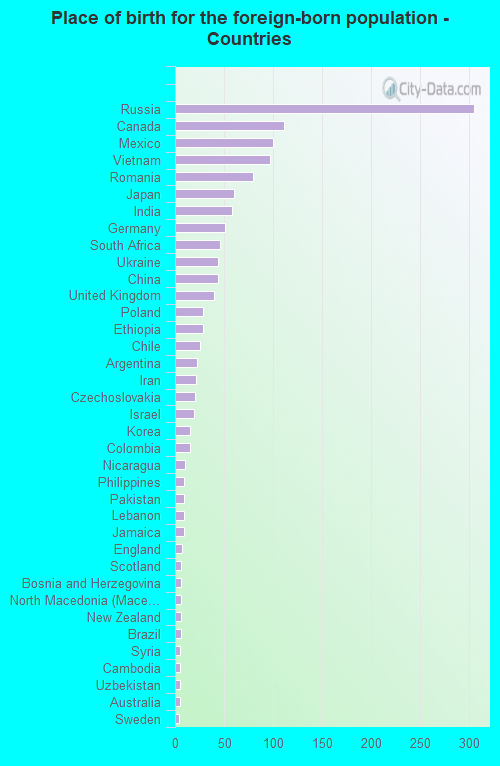
According to 2022 data, the most numerous races in Maltby, WA are White alone (9,147 residents), Hispanic (569 residents), and Asian alone (489 residents). 87.2% of Maltby residents speak English at home. 12.1% of Maltby, WA residents are foreign-born (5.2% born in Europe, 3.2% born in Asia, 1.6% born in Latin America), which is 24.1% less than the foreign-born rate of 15.0% across the entire state of Washington.
Race distribution in Maltby
2000 2022
4,652,490 78.9% White alone 441,509 7.5% Hispanic 319,401 5.4% Asian alone 184,631 3.1% Black alone 175,926 3.0% Two or more races 85,396 1.4% American Indian alone 22,779 0.4% Native Hawaiian and Other 11,989 0.2% Other race alone
4,941,456 63.5% White alone 1,093,313 14.0% Hispanic 755,832 9.7% Asian alone 523,448 6.7% Two or more races 299,537 3.8% Black alone 69,024 0.9% American Indian alone 52,231 0.7% Native Hawaiian and Other 50,945 0.7% Other race alone
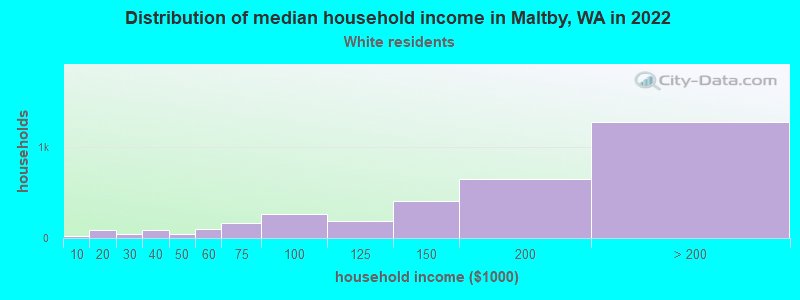
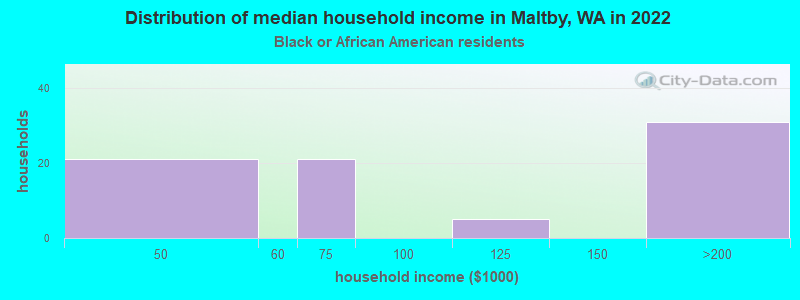
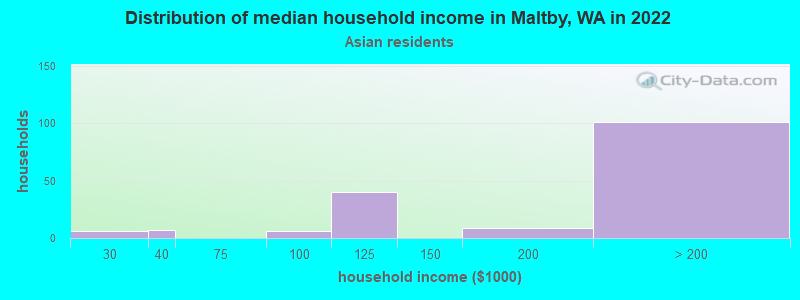
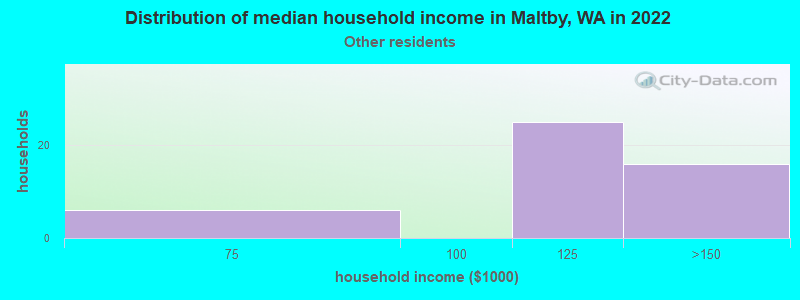
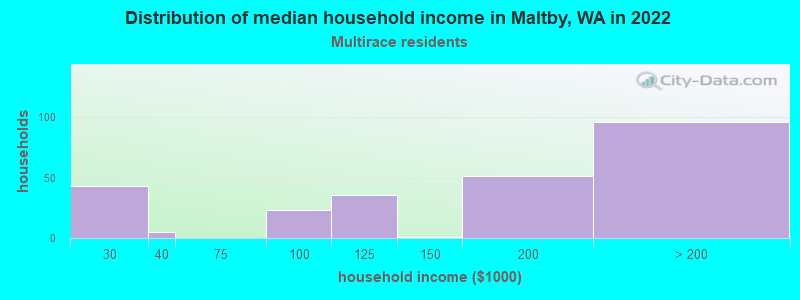
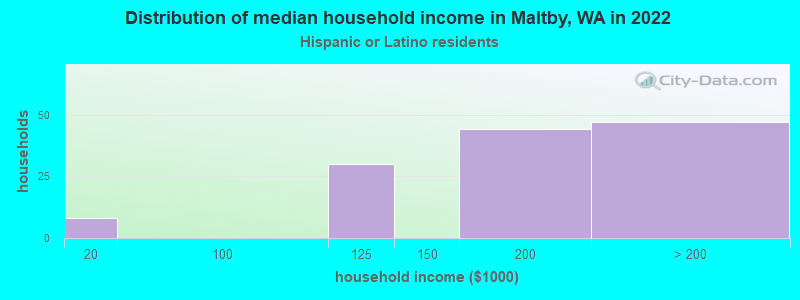
Income and house value in Maltby Median household income in 2022 $162,009 White non-Hispanic householdersover $200,000 Asian householders$114,217 Some other race householders$180,547 Two or more races householders$159,383 Hispanic or Latino race householdersMedian 2022 house value over $1,000,000 White Non-Hispanic householdersover $1,000,000 Black or African American householders $910,895 Asian householdersover $1,000,000 Two or more races householders$880,654 Hispanic or Latino householders
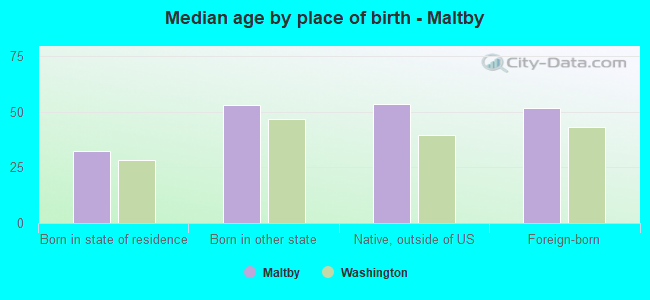
Median age by race in Maltby
48.8 Median age for White residents48.8 49.3 26.8 Median age for Black or African American residents43.3 28.4 -644,308,942.4 Median age for American Indian / Alaska Native residents-736,637,511.4 -589,658,965.3 44.2 Median age for Asian residents40.9 50.9 -677,839,850.3 Median age for Native Hawaiian / Pacific Islander residents-661,202,185.1 -844,317,095.6 45.7 Median age for Other race residents54.3 39.1 29.3 Median age for Two or more races residents24.6 34.5 48.5 Median age for White alone residents48.5 48.3 32.6 Median age for Hispanic or Latino residents22.2 45.5
Owner/renter occupied households by race in Maltby
House owners and renters - White residents 3,108 93.7% Owner occupied208 6.3% Renter occupiedHouse owners and renters - Black or African American residents 44 63.7% Owner occupied25 36.3% Renter occupiedHouse owners and renters - Asian residents 166 100.0% Owner occupiedHouse owners and renters - Other race residents 54 100.0% Owner occupiedHouse owners and renters - Two or more races residents 259 95.0% Owner occupied14 5.0% Renter occupiedHouse owners and renters - White alone residents 3,070 93.6% Owner occupied211 6.4% Renter occupiedHouse owners and renters - Hispanic or Latino residents 151 100.0% Owner occupied
Language usage in Maltby
English speakers - Total 87.2% of residents of Maltby speak English at home.
2.2% of residents speak Spanish at home 209 86.0% Speak English very well34 14.0% Speak English less than very well10.7% of residents speak other language at home 841 71.7% Speak English very well332 28.3% Speak English less than very well
English speakers - Born in the United States 96.8% of residents of Maltby speak English at home.
1.6% of residents speak Spanish at home 56 88.9% Speak English very well7 11.1% Speak English less than very well1.5% of residents speak other language at home 22 36.7% Speak English very well38 63.3% Speak English less than very well
English speakers - Native, born elsewhere 99.4% of residents of Maltby speak English at home.
English speakers - Foreign-born 29.5% of residents of Maltby speak English at home.
7.9% of residents speak Spanish at home 102 91.9% Speak English very well9 8.1% Speak English less than very well64.6% of residents speak other language at home 642 70.9% Speak English very well263 29.1% Speak English less than very well
White (Caucasian) - Speak only English Native:
97.7% (7,987)Foreign-born:
32.8% (225)
White (Caucasian) - Speak another language Native:
2.6% (209)Foreign-born:
67.3% (461)
Black or African American - Speak only English Native:
100.0% (122)Foreign-born:
100.0% (49)
Asian - Speak only English Native:
71.1% (80)Foreign-born:
17.7% (57)
Asian - Speak another language Native:
28.6% (32)Foreign-born:
83.0% (268)
Other race - Speak only English Native:
63.8% (40)Foreign-born:
7.7% (6)
Other race - Speak another language Native:
31.5% (20)Foreign-born:
91.4% (70)
Two or more races - Speak another language Native:
12.3% (117)Foreign-born:
95.9% (87)
White alone - Speak only English Native:
97.0% (7,878)Foreign-born:
24.8% (178)
White alone - Speak another language Native:
3.0% (247)Foreign-born:
75.9% (543)
Hispanic or Latino - Speak only English Native:
84.0% (294)Foreign-born:
37.1% (63)
Hispanic or Latino - Speak another language Native:
19.7% (69)Foreign-born:
65.2% (110)
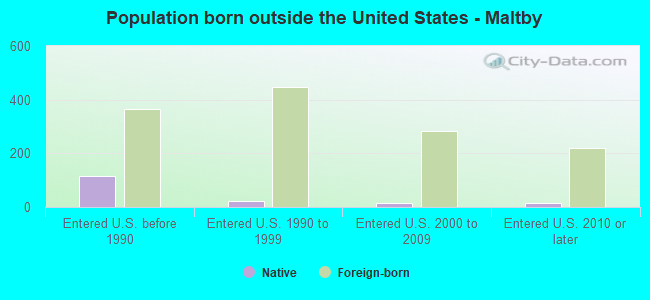
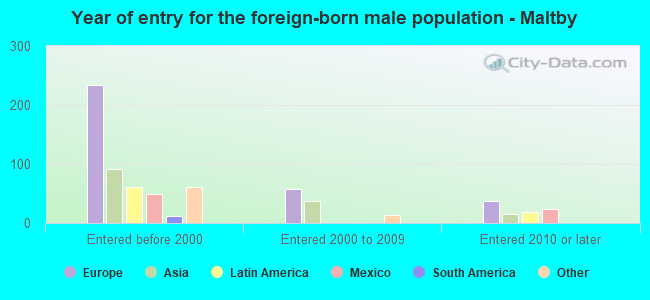
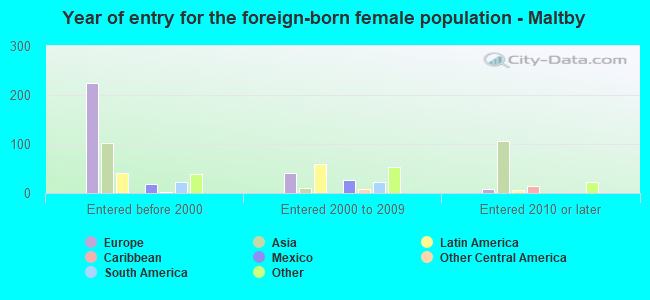
Foreign-born residents in Maltby 1,391 residents are foreign born (5.2% Europe , 3.2% Asia , 1.6% Latin America ).
This city:
12.1%Washington:
14.9%
Marital status for residents in Maltby Marital status - White (Caucasian) population 15 years and over
Males 22.4% Never married68.7% Now married0.4% Separated1.1% Widowed7.4% DivorcedFemales 15.9% Never married70.7% Now married0.8% Separated3.8% Widowed8.8% DivorcedWomen who gave birth in the past 12 months Now married:
100.0% (87)Unmarried:
0.0% (0)
Women who did not give birth in the past 12 months Now married:
57.1% (932)Unmarried:
42.9% (699)
Marital status - Black or African American population 15 years and over
Males 0.0% Never married100.0% Now married0.0% Separated0.0% Widowed0.0% DivorcedFemales 24.6% Never married67.5% Now married0.0% Separated0.0% Widowed7.9% DivorcedWomen who did not give birth in the past 12 months Now married:
63.4% (73)Unmarried:
36.6% (42)
Marital status - Asian population 15 years and over
Males 9.9% Never married82.7% Now married0.0% Separated0.0% Widowed7.4% DivorcedFemales 10.0% Never married77.5% Now married0.0% Separated12.4% Widowed0.0% DivorcedWomen who gave birth in the past 12 months Now married:
100.0% (3)Unmarried:
0.0% (0)
Women who did not give birth in the past 12 months Now married:
75.9% (74)Unmarried:
24.1% (23)
Marital status - Other race population 15 years and over
Males 7.9% Never married92.1% Now married0.0% Separated0.0% Widowed0.0% DivorcedFemales 16.7% Never married83.3% Now married0.0% Separated0.0% Widowed0.0% DivorcedWomen who did not give birth in the past 12 months Now married:
82.1% (45)Unmarried:
17.9% (10)
Marital status - Two or more races population 15 years and over
Males 46.6% Never married50.2% Now married0.0% Separated0.0% Widowed3.2% DivorcedFemales 34.8% Never married50.8% Now married0.0% Separated6.8% Widowed7.6% DivorcedWomen who gave birth in the past 12 months Now married:
100.0% (28)Unmarried:
0.0% (0)
Women who did not give birth in the past 12 months Now married:
55.2% (134)Unmarried:
44.8% (109)
Marital status - White alone, not Hispanic / Latino population 15 years and over
Males 21.9% Never married69.0% Now married0.4% Separated1.1% Widowed7.5% DivorcedFemales 15.4% Never married71.0% Now married0.8% Separated3.9% Widowed8.9% DivorcedWomen who gave birth in the past 12 months Now married:
100.0% (89)Unmarried:
0.0% (0)
Women who did not give birth in the past 12 months Now married:
58.0% (934)Unmarried:
42.0% (676)
Marital status - Hispanic or Latino population 15 years and over
Males 43.1% Never married56.9% Now married0.0% Separated0.0% Widowed0.0% DivorcedFemales 32.4% Never married63.5% Now married0.0% Separated0.0% Widowed4.1% DivorcedWomen who gave birth in the past 12 months Now married:
100.0% (8)Unmarried:
0.0% (0)
Women who did not give birth in the past 12 months Now married:
44.6% (62)Unmarried:
55.4% (77)
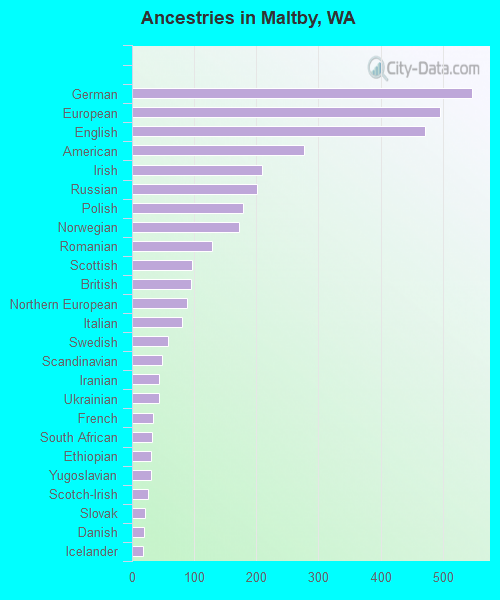
Ancestries in Maltby
547 11.2% German496 10.1% European471 9.6% English277 5.7% American209 4.3% Irish201 4.1% Russian179 3.7% Polish172 3.5% Norwegian129 2.6% Romanian96 2.0% Scottish95 1.9% British89 1.8% Northern European80 1.6% Italian58 1.2% Swedish48 1.0% Scandinavian44 0.9% Iranian43 0.9% Ukrainian34 0.7% French32 0.7% South African30 0.6% Ethiopian30 0.6% Yugoslavian25 0.5% Scotch-Irish21 0.4% Slovak20 0.4% Danish18 0.4% Icelander17 0.3% Dutch14 0.3% Jamaican13 0.3% Macedonian12 0.2% Lebanese12 0.2% Canadian9 0.2% African8 0.2% French Canadian5 0.1% Eastern European5 0.1% Portuguese5 0.1% Welsh4 0.08% Australian3 0.06% Syrian3 0.06% Swiss
Children Nativity (place of birth) in Maltby
Children under 6 years - Living with two parents Both parents native 450 100.0% NativeBoth parents foreign-born 48 92.3% Native4 7.7% Foreign-bornOne native, one foreign-born parent 58 100.0% NativeChildren under 6 years - Living with one parent Native parent 40 100.0% Native
Children 6 to 17 years - Living with two parents Both parents native 919 97.2% Native26 2.8% Foreign-bornBoth parents foreign-born 126 100.0% NativeOne native, one foreign-born parent 284 97.2% Native8 2.8% Foreign-bornChildren 6 to 17 years - Living with one parent Native parent 217 100.0% Native
Grandparents responsible for own grandchildren in Maltby
Grandparents (30 to 59 years) White / Caucasian 17 20.7% Responsible for grandchildren64 79.3% Not responsible for grandchildrenWhite alone, not Hispanic / Latino 18 24.0% Responsible for grandchildren56 76.0% Not responsible for grandchildrenHispanic or Latino 8 100.0% Not responsible for grandchildren
Grandparents (60 years and over) White / Caucasian 5 3.1% Responsible for grandchildren148 96.9% Not responsible for grandchildrenWhite alone, not Hispanic / Latino 5 3.0% Responsible for grandchildren154 97.0% Not responsible for grandchildren