Races in Mamers, North Carolina (NC) Detailed Stats
Ancestries, Foreign-born residents, place of birth
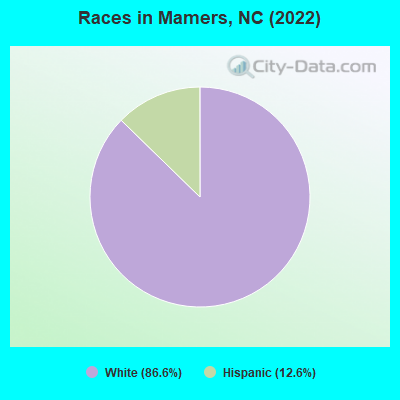
According to 2022 data, the most numerous races in Mamers, NC are White alone (596 residents), Black alone (0 residents), and Hispanic (87 residents). 97.6% of Mamers residents speak English at home.
Race distribution in Mamers

- 59686.6%White alone
- 8712.6%Hispanic
2000
2022
-
- 5,647,15570.2%White alone
- 1,723,30121.4%Black alone
- 378,9634.7%Hispanic
- 112,4161.4%Asian alone
- 95,3331.2%American Indian alone
- 79,9651.0%Two or more races
- 9,0150.1%Other race alone
- 3,1650.04%Native Hawaiian and Other
Pacific Islander alone

-
- 6,497,51960.7%White alone
- 2,155,65020.1%Black alone
- 1,114,79910.4%Hispanic
- 438,0614.1%Two or more races
- 341,0523.2%Asian alone
- 91,7580.9%American Indian alone
- 50,1800.5%Other race alone
- 9,9540.09%Native Hawaiian and Other
Pacific Islander alone

Income and house value in Mamers
- Median household income in 2022
- Median 2022 house value
Household income for White non-Hispanic householders

Median age by race in Mamers
- 63.9Median age for White residents
- 63.9Males
- 63.7Females
- -704,119,849.5Median age for Black or African American residents
- -726,396,916.4Males
- -690,607,734.1Females
- -666,666,666.0Median age for American Indian / Alaska Native residents
- -668,604,650.5Males
- -682,971,013.8Females
- -642,987,248.9Median age for Asian residents
- -579,008,073.2Males
- -885,443,582.2Females
- -864,385,297.0Median age for Native Hawaiian / Pacific Islander residents
- -381,443,298.6Males
- -857,142,856.3Females
- -587,134,502.3Median age for Other race residents
- -687,214,611.2Males
- -552,971,575.7Females
- 10.5Median age for Two or more races residents
- -987,783,594.1Males
- -1,161,048,688.0Females
- 67.1Median age for White alone residents
- 67.5Males
- 66.7Females
- 6.5Median age for Hispanic or Latino residents
- -600,255,427.2Males
- -652,835,407.4Females
Owner/renter occupied households by race in Mamers
- House owners and renters - White residents
- 26691.5%Owner occupied
- 258.5%Renter occupied
- House owners and renters - Two or more races residents
- 26100.0%Renter occupied
- House owners and renters - White alone residents
- 26791.2%Owner occupied
- 268.8%Renter occupied
- House owners and renters - Hispanic or Latino residents
- 17100.0%Renter occupied
Language usage in Mamers
- English speakers - Total
- 97.6% of residents of Mamers speak English at home.
- 2.1% of residents speak Spanish at home
- 14100.0%Speak English less than very well
All residents speak only English at home
All residents speak only English at home
- English speakers - Foreign-born
- 0.0% of residents of Mamers speak English at home.
- 80.0% of residents speak Spanish at home
- 16100.0%Speak English less than very well
Foreign-born residents in Mamers


Marital status for residents in Mamers
Marital status - White (Caucasian) population 15 years and over
- Males
- 12.2%Never married
- 82.3%Now married
- 0.0%Separated
- 0.0%Widowed
- 5.5%Divorced
- Females
- 4.1%Never married
- 79.6%Now married
- 4.5%Separated
- 11.9%Widowed
- 0.0%Divorced
Women who did not give birth in the past 12 months
| Now married: | 82.5% (47) |
| Unmarried: | 17.5% (10) |
Marital status - Two or more races population 15 years and over
- Males
- 0.0%Never married
- 100.0%Now married
- 0.0%Separated
- 0.0%Widowed
- 0.0%Divorced
- Females
- 0.0%Never married
- 100.0%Now married
- 0.0%Separated
- 0.0%Widowed
- 0.0%Divorced
Women who gave birth in the past 12 months
| Now married: | 100.0% (25) |
| Unmarried: | 0.0% (0) |
Marital status - White alone, not Hispanic / Latino population 15 years and over
- Males
- 12.2%Never married
- 82.3%Now married
- 0.0%Separated
- 0.0%Widowed
- 5.5%Divorced
- Females
- 4.1%Never married
- 79.6%Now married
- 4.5%Separated
- 11.9%Widowed
- 0.0%Divorced
Women who did not give birth in the past 12 months
| Now married: | 82.5% (47) |
| Unmarried: | 17.5% (10) |
Marital status - Hispanic or Latino population 15 years and over
- Males
- 0.0%Never married
- 100.0%Now married
- 0.0%Separated
- 0.0%Widowed
- 0.0%Divorced
- Females
- 0.0%Never married
- 100.0%Now married
- 0.0%Separated
- 0.0%Widowed
- 0.0%Divorced
Women who gave birth in the past 12 months
| Now married: | 100.0% (20) |
| Unmarried: | 0.0% (0) |
Ancestries in Mamers

- 10831.0%English
- 8123.3%German
- 61.7%Irish

Geographical mobility in Mamers

- Same house 1 year ago
- 45876.2%White (Caucasian)
- 45976.8%White alone, not Hispanic / Latino

-
- Moved within same state
- 14223.7%White / Caucasian
- 12220.3%White alone, not Hispanic / Latino

-
- Moved from different state
- 8296.6%Two or more races
- 6191.4%Hispanic or Latino

Children Nativity (place of birth) in Mamers
Place of birth for residents in Mamers
![Place of birth for the foreign-born population - Regions]()
- 19Americas
- 19Latin America
- 19Central America
