Races in Manchester, Missouri (MO) Detailed Stats
Ancestries, Foreign-born residents, place of birth
Settings
X


Recent posts about races in Manchester, Missouri on our local forum with over 2,400,000 registered users:
 | Things You Remember About St. Louis (229 replies) |
| House Market in spring for St. Louis County? (23 replies) |
| Walkable - transit - Asian/Chinese (8 replies) |
| Des Peres - near Manchester Rd. (5 replies) |
| Relocation to ballwin (8 replies) |
| Pakistani movef to st louis (2 replies) |
Latest news about races in Manchester, MO collected exclusively by city-data.com from local newspapers, TV, and radio stations
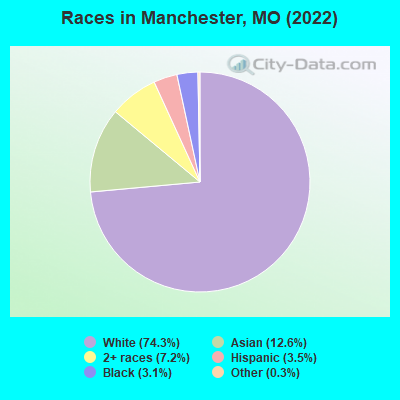
According to 2022 data, the most numerous races in Manchester, MO are White alone (13,423 residents), Black alone (565 residents), and Two or more races (1,304 residents). 82.9% of Manchester residents speak English at home. 12.1% of Manchester, MO residents are foreign-born (9.8% born in Asia), which is 66.9% greater than the foreign-born rate of 4.0% across the entire state of Missouri.
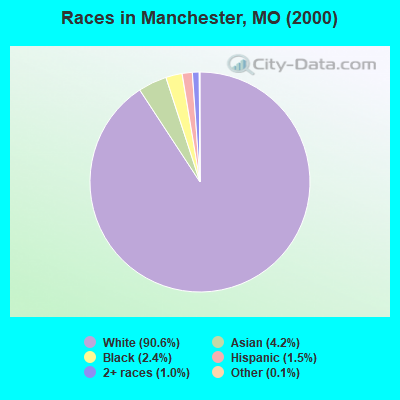
Race distribution in Manchester
2000
2022

- 17,35590.6%White alone
- 8114.2%Asian alone
- 4622.4%Black alone
- 2921.5%Hispanic
- 2001.0%Two or more races
- 220.1%Other race alone
- 150.08%American Indian alone
- 40.02%Native Hawaiian and Other
Pacific Islander alone
-
- 13,42374.3%White alone
- 2,27612.6%Asian alone
- 1,3047.2%Two or more races
- 6253.5%Hispanic
- 5653.1%Black alone
- 540.3%Other race alone
- 80.04%Native Hawaiian and Other
Pacific Islander alone
2000
2022
-
- 4,686,47483.8%White alone
- 625,66711.2%Black alone
- 118,5922.1%Hispanic
- 71,9051.3%Two or more races
- 61,0411.1%Asian alone
- 23,3020.4%American Indian alone
- 5,2910.09%Other race alone
- 2,9390.05%Native Hawaiian and Other
Pacific Islander alone

-
- 4,733,41176.6%White alone
- 656,73910.6%Black alone
- 316,3005.1%Two or more races
- 291,7634.7%Hispanic
- 132,4362.1%Asian alone
- 27,4670.4%Other race alone
- 12,3130.2%American Indian alone
- 7,5280.1%Native Hawaiian and Other
Pacific Islander alone

Income and house value in Manchester
- Median household income in 2022
- $88,386White non-Hispanic householders
- $133,889Black householders
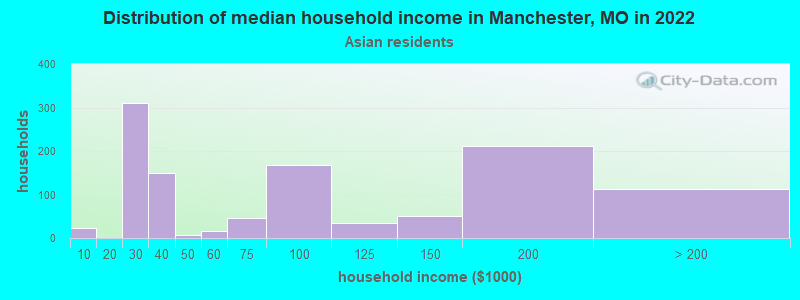
- $95,170Asian householders
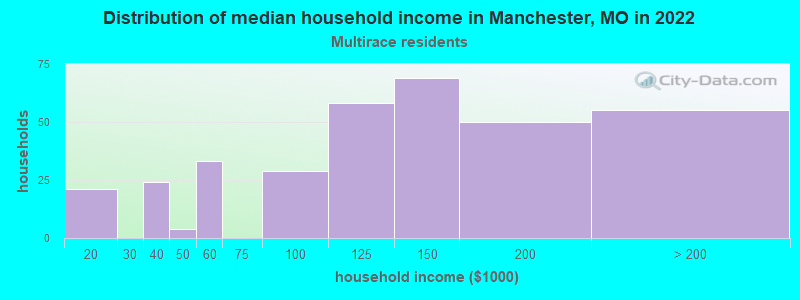
- $123,995Two or more races householders
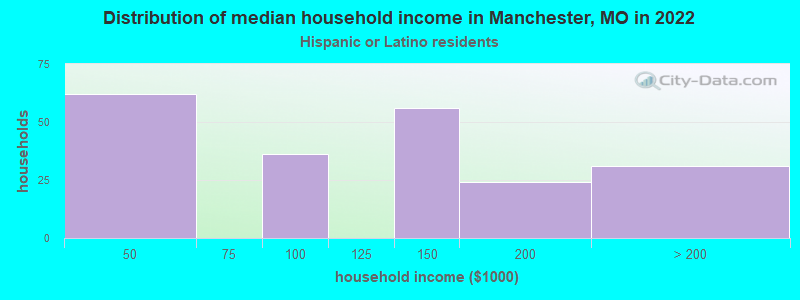
- $133,910Hispanic or Latino race householders
- Median 2022 house value
- $306,053White Non-Hispanic householders
- $335,323Black or African American householders
- $306,265Asian householders
- $308,174Two or more races householders
- $390,467Hispanic or Latino householders
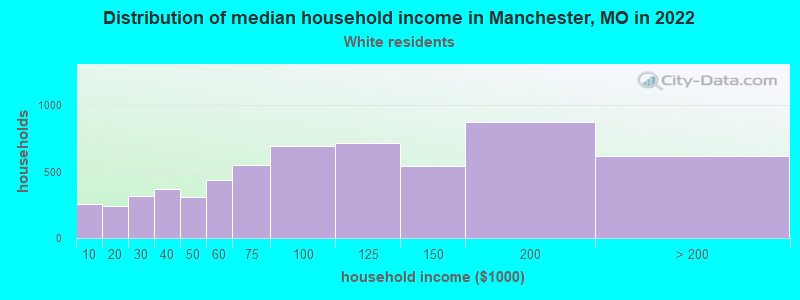
Household income for White non-Hispanic householders
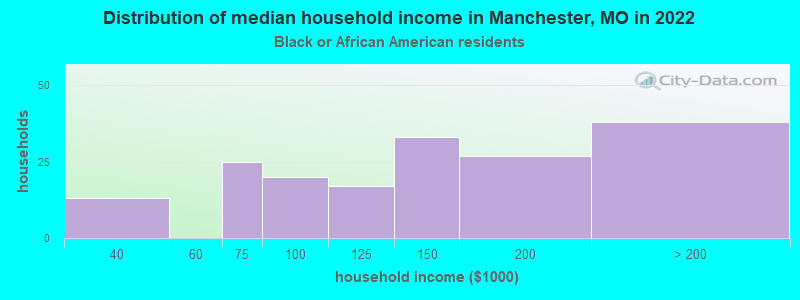
Household income for Black householders
Household income for American Indian and Alaska Native householders

Household income for Asian householders
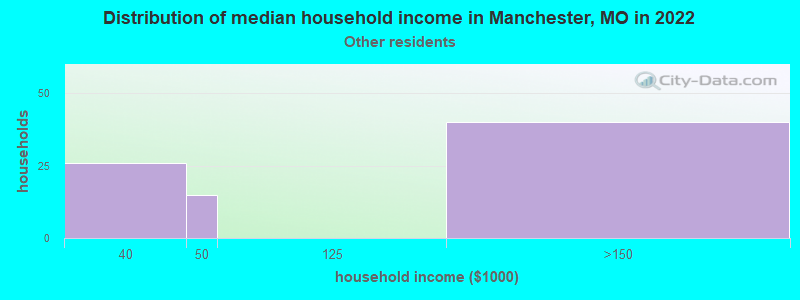
Household income for Some other race householders
Household income for Two or more races householders
Household income for Hispanic or Latino race householders
Median age by race in Manchester
- 39.8Median age for White residents
- 36.4Males
- 44.4Females
- 50.2Median age for Black or African American residents
- 45.9Males
- 61.7Females
- 34.7Median age for American Indian / Alaska Native residents
- 44.0Males
- 25.4Females
- 37.9Median age for Asian residents
- 32.0Males
- 40.0Females
- -710,303,029.6Median age for Native Hawaiian / Pacific Islander residents
- -1,449,781,657.9Males
- -752,136,751.4Females
- 49.0Median age for Other race residents
- 48.4Males
- 51.3Females
- 17.2Median age for Two or more races residents
- 18.9Males
- 23.0Females
- 40.0Median age for White alone residents
- 36.6Males
- 44.7Females
- 26.8Median age for Hispanic or Latino residents
- 33.4Males
- 24.9Females
Owner/renter occupied households by race in Manchester
- House owners and renters - White residents
- 4,34173.7%Owner occupied
- 1,55026.3%Renter occupied
- House owners and renters - Black or African American residents
- 10863.7%Owner occupied
- 6236.3%Renter occupied
- House owners and renters - American Indian / Alaska Native residents
- 10100.0%Owner occupied
- House owners and renters - Asian residents
- 61764.3%Owner occupied
- 34335.7%Renter occupied
- House owners and renters - Native Hawaiian / Pacific Islander residents
- 11100.0%Owner occupied
- House owners and renters - Other race residents
- 3363.2%Owner occupied
- 1936.8%Renter occupied
- House owners and renters - Two or more races residents
- 28982.4%Owner occupied
- 6217.6%Renter occupied
- House owners and renters - White alone residents
- 4,29274.0%Owner occupied
- 1,50626.0%Renter occupied
- House owners and renters - Hispanic or Latino residents
- 14268.9%Owner occupied
- 6431.1%Renter occupied
Language usage in Manchester
- English speakers - Total
- 82.9% of residents of Manchester speak English at home.
- 1.6% of residents speak Spanish at home
- 22379.4%Speak English very well
- 5820.6%Speak English less than very well
- 15.6% of residents speak other language at home
- 2,30986.8%Speak English very well
- 35213.2%Speak English less than very well
- English speakers - Born in the United States
- 97.1% of residents of Manchester speak English at home.
- 1.6% of residents speak Spanish at home
- 6895.8%Speak English very well
- 34.2%Speak English less than very well
- 1.2% of residents speak other language at home
- 53100.0%Speak English very well
- English speakers - Native, born elsewhere
- 77.2% of residents of Manchester speak English at home.
- 34.8% of residents speak other language at home
- 2990.6%Speak English very well
- 39.4%Speak English less than very well
- English speakers - Foreign-born
- 12.6% of residents of Manchester speak English at home.
- 4.6% of residents speak Spanish at home
- 6260.8%Speak English very well
- 4039.2%Speak English less than very well
- 80.3% of residents speak other language at home
- 1,45081.8%Speak English very well
- 32218.2%Speak English less than very well
White (Caucasian) - Speak only English
| Native: | 97.1% (12,094) |
| Foreign-born: | 18.2% (83) |
White (Caucasian) - Speak another language
| Native: | 2.9% (360) |
| Foreign-born: | 82.7% (379) |
Black or African American - Speak only English
| Native: | 99.0% (479) |
| Foreign-born: | 18.4% (16) |
American Indian / Alaska Native - Speak another language
| Native: | 100.0% (24) |
| Foreign-born: | 100.0% (9) |
Asian - Speak only English
| Native: | 36.1% (283) |
| Foreign-born: | 12.8% (188) |
Asian - Speak another language
| Native: | 58.8% (461) |
| Foreign-born: | 86.2% (1,265) |
Other race - Speak another language
| Native: | 11.2% (9) |
| Foreign-born: | 90.6% (10) |
Two or more races - Speak another language
| Native: | 13.8% (179) |
| Foreign-born: | 100.0% (179) |
White alone - Speak only English
| Native: | 96.9% (11,851) |
| Foreign-born: | 18.6% (85) |
White alone - Speak another language
| Native: | 3.1% (384) |
| Foreign-born: | 82.4% (378) |
Hispanic or Latino - Speak another language
| Native: | 21.3% (107) |
| Foreign-born: | 100.0% (106) |
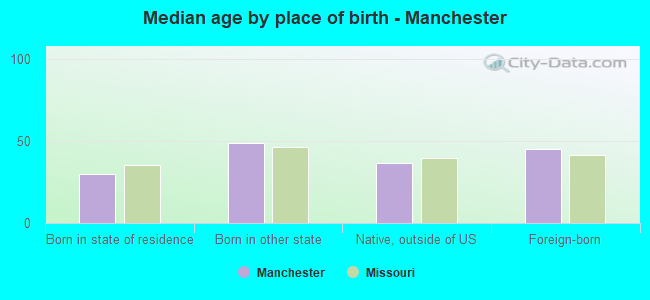
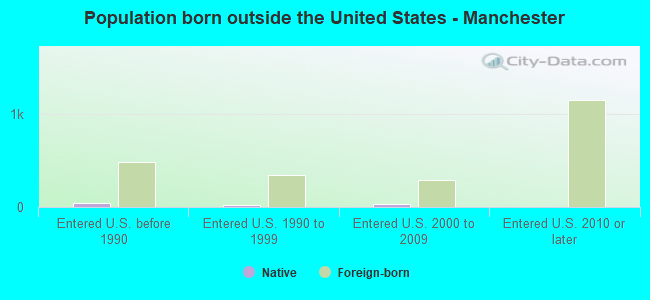
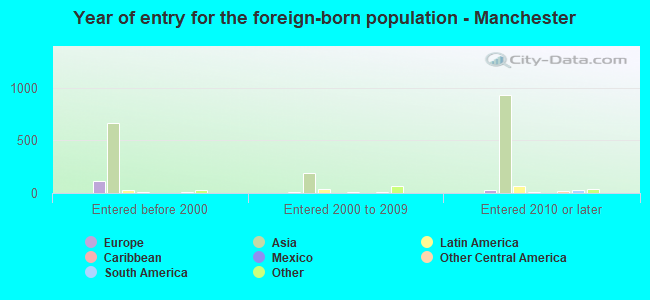
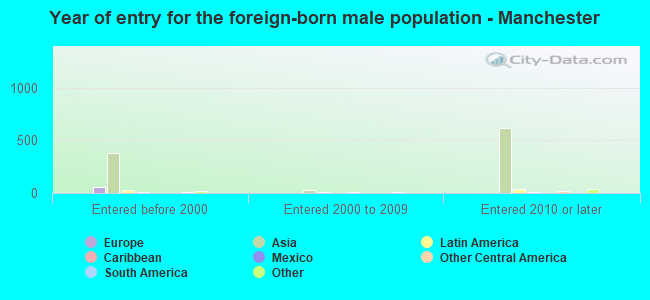
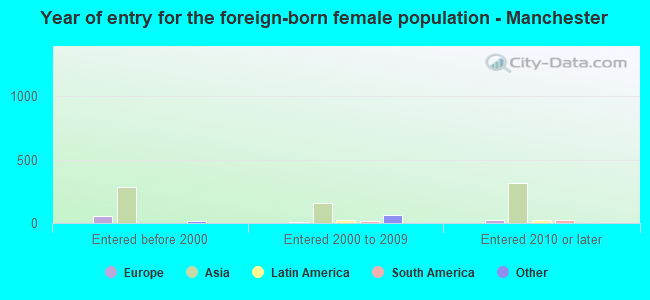
Foreign-born residents in Manchester
2,181 residents are foreign born (9.8% Asia).
| This city: | 12.1% |
| Missouri: | 4.2% |

Marital status for residents in Manchester
Marital status - White (Caucasian) population 15 years and over
- Males
- 31.1%Never married
- 59.4%Now married
- 1.0%Separated
- 2.9%Widowed
- 5.5%Divorced
- Females
- 17.5%Never married
- 60.5%Now married
- 1.1%Separated
- 7.3%Widowed
- 13.6%Divorced
Women who gave birth in the past 12 months
| Now married: | 100.0% (196) |
| Unmarried: | 0.0% (0) |
Women who did not give birth in the past 12 months
| Now married: | 63.0% (1,706) |
| Unmarried: | 37.0% (1,000) |
Marital status - Black or African American population 15 years and over
- Males
- 28.3%Never married
- 64.7%Now married
- 0.0%Separated
- 0.0%Widowed
- 7.1%Divorced
- Females
- 33.1%Never married
- 47.2%Now married
- 8.6%Separated
- 0.0%Widowed
- 11.0%Divorced
Women who did not give birth in the past 12 months
| Now married: | 58.6% (38) |
| Unmarried: | 41.4% (27) |
Marital status - American Indian / Alaska Native population 15 years and over
- Males
- 7.7%Never married
- 92.3%Now married
- 0.0%Separated
- 0.0%Widowed
- 0.0%Divorced
- Females
- 20.0%Never married
- 80.0%Now married
- 0.0%Separated
- 0.0%Widowed
- 0.0%Divorced
Women who did not give birth in the past 12 months
| Now married: | 80.0% (12) |
| Unmarried: | 20.0% (3) |
Marital status - Asian population 15 years and over
- Males
- 38.1%Never married
- 60.0%Now married
- 0.0%Separated
- 1.9%Widowed
- 0.0%Divorced
- Females
- 22.1%Never married
- 55.7%Now married
- 0.0%Separated
- 16.7%Widowed
- 5.5%Divorced
Women who did not give birth in the past 12 months
| Now married: | 65.3% (412) |
| Unmarried: | 34.7% (219) |
Marital status - Other race population 15 years and over
- Males
- 21.4%Never married
- 19.6%Now married
- 0.0%Separated
- 0.0%Widowed
- 58.9%Divorced
- Females
- 0.0%Never married
- 39.5%Now married
- 0.0%Separated
- 0.0%Widowed
- 60.5%Divorced
Women who did not give birth in the past 12 months
| Now married: | 100.0% (16) |
| Unmarried: | 0.0% (0) |
Marital status - Two or more races population 15 years and over
- Males
- 61.2%Never married
- 38.8%Now married
- 0.0%Separated
- 0.0%Widowed
- 0.0%Divorced
- Females
- 59.5%Never married
- 40.0%Now married
- 0.0%Separated
- 0.0%Widowed
- 0.4%Divorced
Women who did not give birth in the past 12 months
| Now married: | 35.9% (189) |
| Unmarried: | 64.1% (338) |
Marital status - White alone, not Hispanic / Latino population 15 years and over
- Males
- 31.2%Never married
- 59.9%Now married
- 0.2%Separated
- 3.0%Widowed
- 5.7%Divorced
- Females
- 16.6%Never married
- 61.1%Now married
- 1.1%Separated
- 7.4%Widowed
- 13.8%Divorced
Women who gave birth in the past 12 months
| Now married: | 100.0% (198) |
| Unmarried: | 0.0% (0) |
Women who did not give birth in the past 12 months
| Now married: | 64.4% (1,719) |
| Unmarried: | 35.6% (951) |
Marital status - Hispanic or Latino population 15 years and over
- Males
- 28.6%Never married
- 49.8%Now married
- 17.6%Separated
- 0.0%Widowed
- 4.0%Divorced
- Females
- 53.5%Never married
- 39.9%Now married
- 0.0%Separated
- 0.0%Widowed
- 6.6%Divorced
Women who did not give birth in the past 12 months
| Now married: | 27.8% (47) |
| Unmarried: | 72.2% (123) |
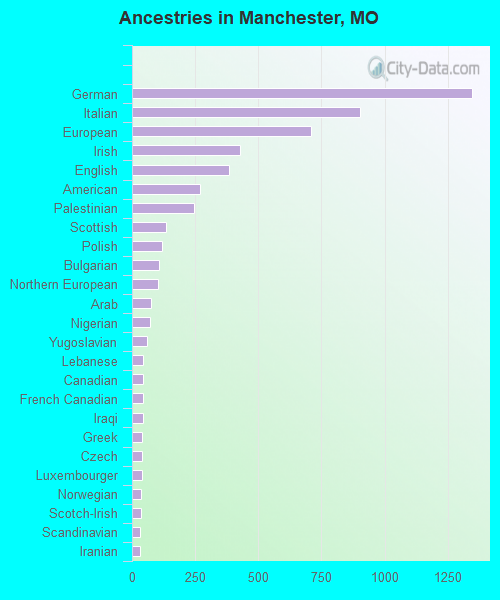
Ancestries in Manchester

- 1,34616.3%German
- 90410.9%Italian
- 7108.6%European
- 4285.2%Irish
- 3854.7%English
- 2693.2%American
- 2453.0%Palestinian
- 1351.6%Scottish
- 1191.4%Polish
- 1061.3%Bulgarian
- 1031.2%Northern European
- 750.9%Arab
- 720.9%Nigerian
- 580.7%Yugoslavian
- 450.5%Lebanese
- 450.5%Canadian
- 450.5%French Canadian
- 420.5%Iraqi
- 400.5%Greek
- 400.5%Czech
- 390.5%Luxembourger
- 370.4%Norwegian
- 370.4%Scotch-Irish
- 330.4%Scandinavian
- 310.4%Iranian
- 310.4%Welsh
- 260.3%Swedish
- 250.3%Eastern European
- 240.3%French
- 220.3%Dutch
- 220.3%Ghanaian
- 170.2%Danish
- 160.2%Moroccan
- 160.2%Austrian
- 100.1%Australian
- 100.1%British
- 90.1%Finnish
- 70.08%Russian
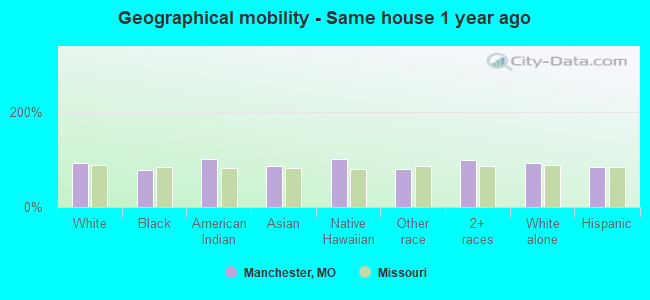
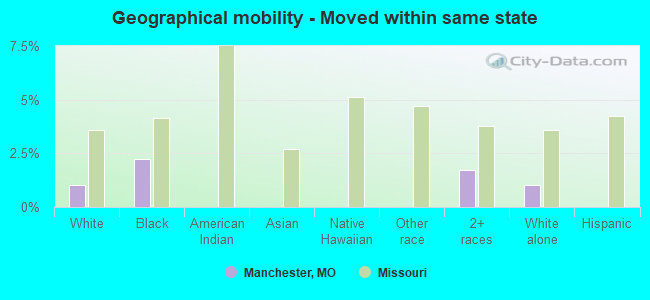
Geographical mobility in Manchester

- Same house 1 year ago
- 12,31891.8%White (Caucasian)
- 43077.5%Black or African American
- 36100.0%American Indian / Alaska Native
- 1,97386.3%Asian
- 14100.0%Native Hawaiian / Pacific Islander
- 7580.5%Other race
- 1,61498.7%Two or more races
- 12,18192.3%White alone, not Hispanic / Latino
- 51883.1%Hispanic or Latino
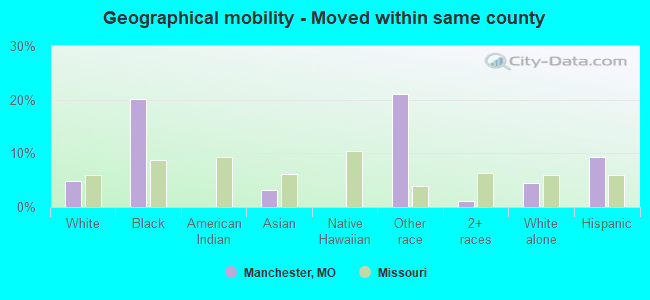
-
- Moved within same county
- 6404.8%White / Caucasian
- 11220.1%Black or African American
- 733.2%Asian
- 1921.0%Other race
- 181.1%Two or more races
- 5934.5%White alone, not Hispanic / Latino
- 599.4%Hispanic or Latino
-
- Moved within same state
- 1381.0%White / Caucasian
- 122.2%Black or African American
- 291.7%Two or more races
- 1361.0%White alone, not Hispanic / Latino
-
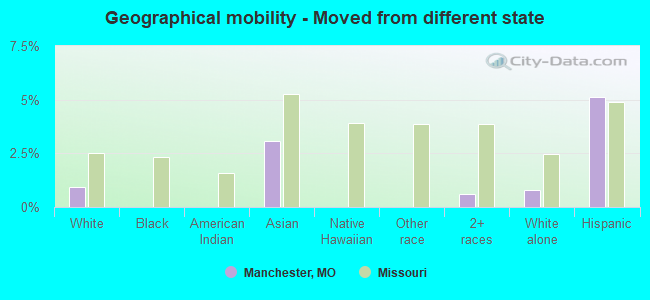
- Moved from different state
- 1220.9%White / Caucasian
- 703.1%Asian
- 100.6%Two or more races
- 1050.8%White alone, not Hispanic / Latino
- 325.1%Hispanic or Latino
-
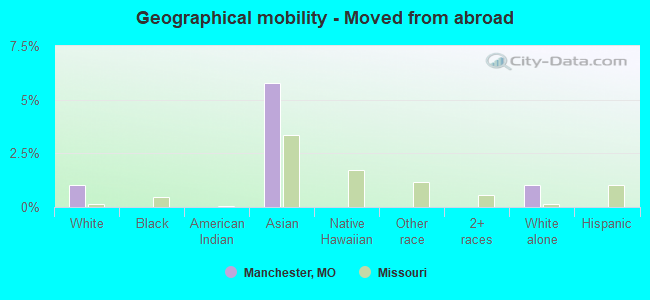
- Moved from abroad
- 1351.0%White
- 1325.8%Asian
- 1381.0%White alone, not Hispanic / Latino
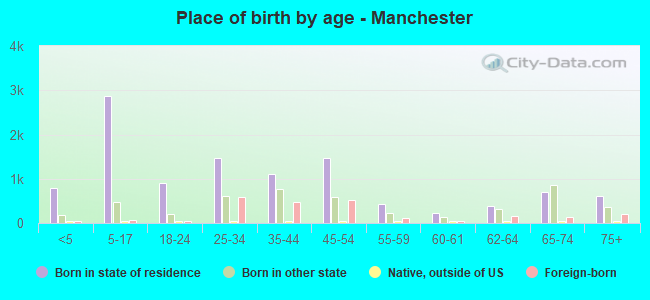
Children Nativity (place of birth) in Manchester
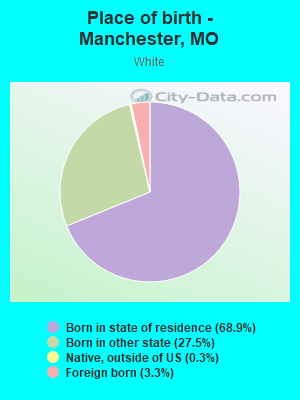
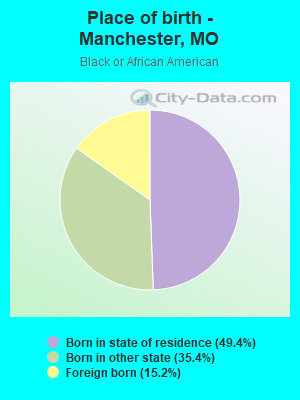
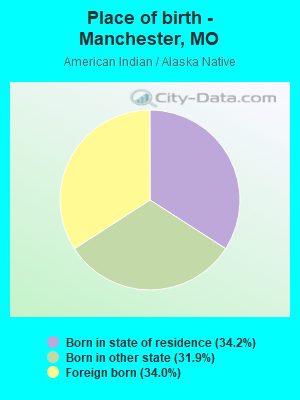
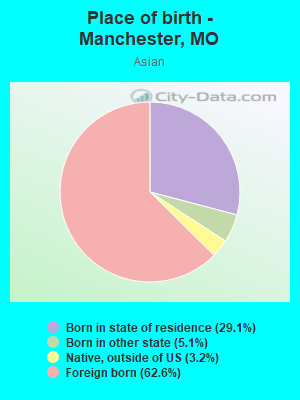
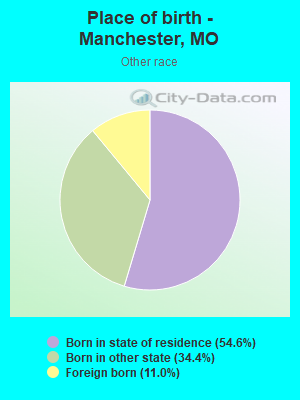
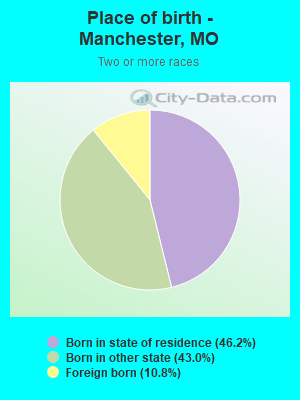
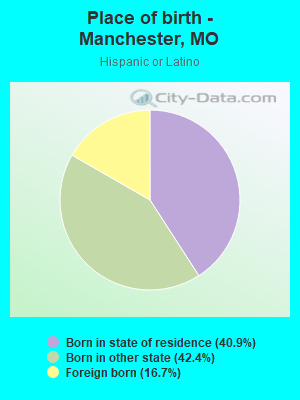
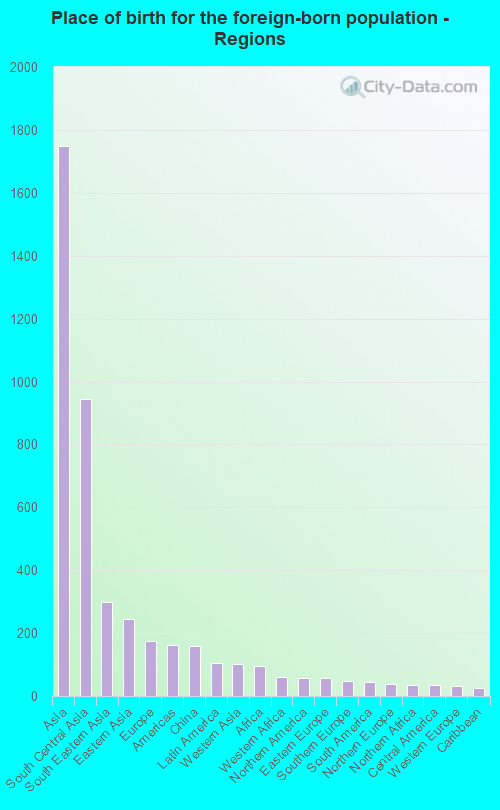
Place of birth for residents in Manchester
![Place of birth for the foreign-born population - Regions]()
- 1,748Asia
- 944South Central Asia
- 299South Eastern Asia
- 244Eastern Asia
- 175Europe
- 163Americas
- 159China
- 104Latin America
- 103Western Asia
- 94Africa
- 60Western Africa
- 58Northern America
- 57Eastern Europe
- 48Southern Europe
- 45South America
- 37Northern Europe
- 34Northern Africa
- 34Central America
- 31Western Europe
- 24Caribbean
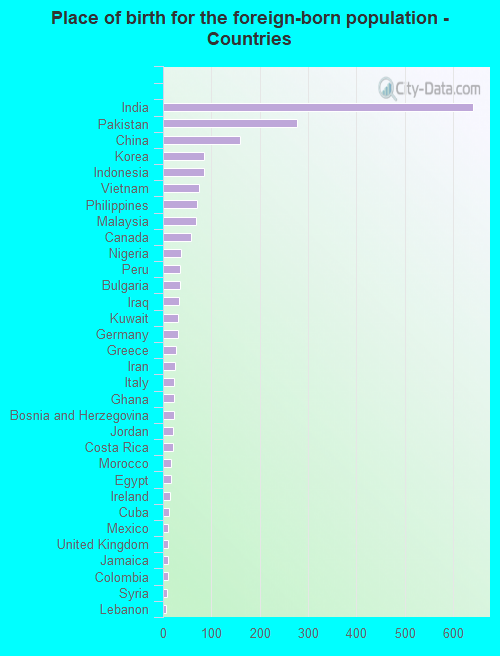
![Place of birth for the foreign-born population - Countries]()
- 642India
- 277Pakistan
- 159China
- 85Korea
- 84Indonesia
- 75Vietnam
- 70Philippines
- 69Malaysia
- 58Canada
- 38Nigeria
- 35Peru
- 35Bulgaria
- 33Iraq
- 32Kuwait
- 31Germany
- 26Greece
- 24Iran
- 22Italy
- 22Ghana
- 22Bosnia and Herzegovina
- 21Jordan
- 20Costa Rica
- 17Morocco
- 16Egypt
- 14Ireland
- 13Cuba
- 11Mexico
- 10United Kingdom
- 10Jamaica
- 10Colombia
- 8Syria
- 7Lebanon
- 1Guatemala
Grandparents responsible for own grandchildren in Manchester
Zip codes: 63088.