Races in Manhattan, Kansas (KS) Detailed Stats
Data:
Races - White alone (%)
Races - White alone (% change since 2000)
Races - Black alone (%)
Races - Black alone (% change since 2000)
Races - American Indian alone (%)
Races - American Indian alone (% change since 2000)
Races - Asian alone (%)
Races - Asian alone (% change since 2000)
Races - Hispanic (%)
Races - Hispanic (% change since 2000)
Races - Native Hawaiian and Other Pacific Islander alone (%)
Races - Native Hawaiian and Other Pacific Islander alone (% change since 2000)
Races - Two or more races(%)
Races - Two or more races(% change since 2000)
Races - Other race alone (%)
Races - Other race alone (% change since 2000)
Racial diversity
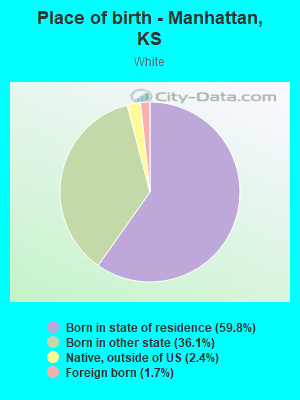
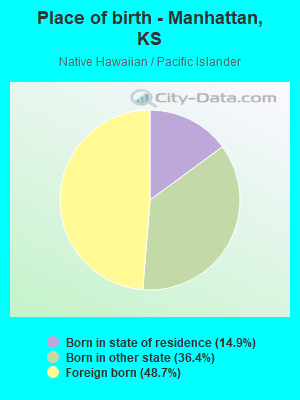
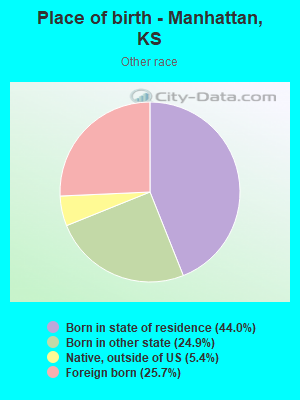
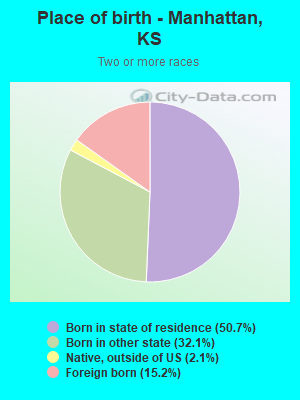
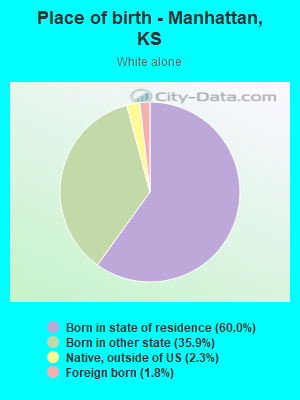
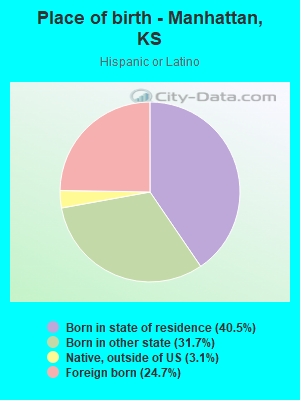
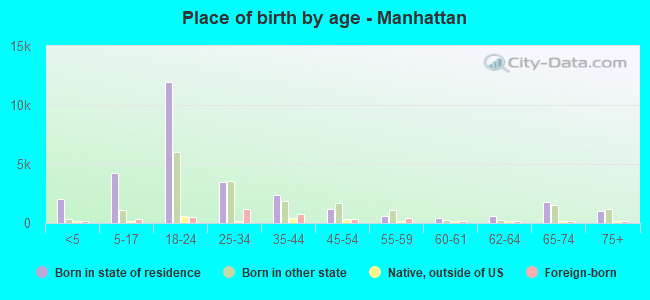
Place of birth - Born in state of residence (%)
Place of birth - Born in state of residence (%) - White
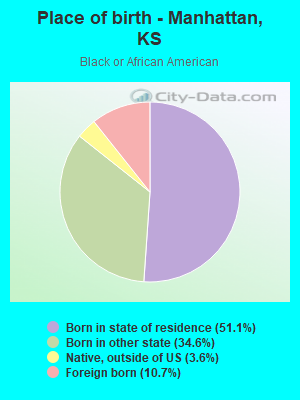
Place of birth - Born in state of residence (%) - Black or African American
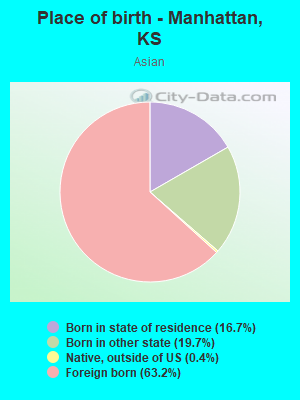
Place of birth - Born in state of residence (%) - Asian
Place of birth - Born in state of residence (%) - Hispanic or Latino
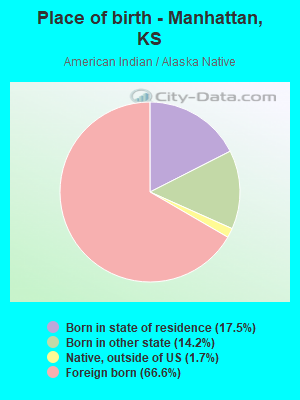
Place of birth - Born in state of residence (%) - American Indian and Alaska Native
Place of birth - Born in state of residence (%) - Multirace
Place of birth - Born in state of residence (%) - Other Race
Place of birth - Born in other state (%)
Place of birth - Born in other state (%) - White
Place of birth - Born in other state (%) - Black or African American
Place of birth - Born in other state (%) - Asian
Place of birth - Born in other state (%) - Hispanic or Latino
Place of birth - Born in other state (%) - American Indian and Alaska Native
Place of birth - Born in other state (%) - Multirace
Place of birth - Born in other state (%) - Other Race
Place of birth - Native, outside of US (%)
Place of birth - Native, outside of US (%) - White
Place of birth - Native, outside of US (%) - Black or African American
Place of birth - Native, outside of US (%) - Asian
Place of birth - Native, outside of US (%) - Hispanic or Latino
Place of birth - Native, outside of US (%) - American Indian and Alaska Native
Place of birth - Native, outside of US (%) - Multirace
Place of birth - Native, outside of US (%) - Other Race
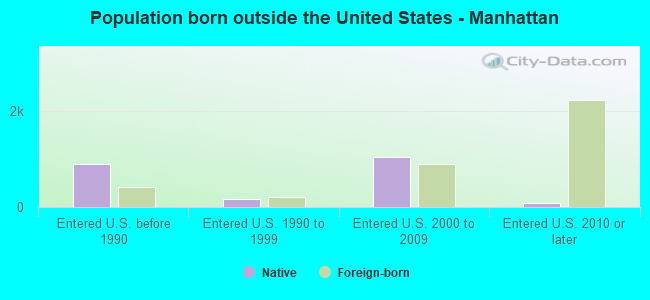
Place of birth - Foreign born (%)
Place of birth - Foreign born (%) - White
Place of birth - Foreign born (%) - Black or African American
Place of birth - Foreign born (%) - Asian
Place of birth - Foreign born (%) - Hispanic or Latino
Place of birth - Foreign born (%) - American Indian and Alaska Native
Place of birth - Foreign born (%) - Multirace
Place of birth - Foreign born (%) - Other Race
Residents speaking English at home (%)
Residents speaking English at home - Born in the United States (%)
Residents speaking English at home - Native, born elsewhere (%)
Residents speaking English at home - Foreign born (%)
Residents speaking Spanish at home (%)
Residents speaking Spanish at home - Born in the United States (%)
Residents speaking Spanish at home - Native, born elsewhere (%)
Residents speaking Spanish at home - Foreign born (%)
Residents speaking other language at home (%)
Residents speaking other language at home - Born in the United States (%)
Residents speaking other language at home - Native, born elsewhere (%)
Residents speaking other language at home - Foreign born (%)
Marital status - Never married (%)
Marital status - Now married (%)
Marital status - Separated (%)
Marital status - Widowed (%)
Marital status - Divorced (%)
Ancestries Reported - Arab (%)
Ancestries Reported - Czech (%)
Ancestries Reported - Danish (%)
Ancestries Reported - Dutch (%)
Ancestries Reported - English (%)
Ancestries Reported - French (%)
Ancestries Reported - French Canadian (%)
Ancestries Reported - German (%)
Ancestries Reported - Greek (%)
Ancestries Reported - Hungarian (%)
Ancestries Reported - Irish (%)
Ancestries Reported - Italian (%)
Ancestries Reported - Lithuanian (%)
Ancestries Reported - Norwegian (%)
Ancestries Reported - Polish (%)
Ancestries Reported - Portuguese (%)
Ancestries Reported - Russian (%)
Ancestries Reported - Scotch-Irish (%)
Ancestries Reported - Scottish (%)
Ancestries Reported - Slovak (%)
Ancestries Reported - Subsaharan African (%)
Ancestries Reported - Swedish (%)
Ancestries Reported - Swiss (%)
Ancestries Reported - Ukrainian (%)
Ancestries Reported - United States (%)
Ancestries Reported - Welsh (%)
Ancestries Reported - West Indian (%)
Ancestries Reported - Other (%)
Geographical mobility - Same house 1 year ago (%)
Geographical mobility - Same house 1 year ago (%) - White
Geographical mobility - Same house 1 year ago (%) - Black or African American
Geographical mobility - Same house 1 year ago (%) - Asian
Geographical mobility - Same house 1 year ago (%) - Hispanic or Latino
Geographical mobility - Same house 1 year ago (%) - American Indian and Alaska Native
Geographical mobility - Same house 1 year ago (%) - Multirace
Geographical mobility - Same house 1 year ago (%) - Other Race
Geographical mobility - Moved within same county (%)
Geographical mobility - Moved within same county (%) - White
Geographical mobility - Moved within same county (%) - Black or African American
Geographical mobility - Moved within same county (%) - Asian
Geographical mobility - Moved within same county (%) - Hispanic or Latino
Geographical mobility - Moved within same county (%) - American Indian and Alaska Native
Geographical mobility - Moved within same county (%) - Multirace
Geographical mobility - Moved within same county (%) - Other Race
Geographical mobility - Moved from different county within same state (%)
Geographical mobility - Moved from different county within same state (%) - White
Geographical mobility - Moved from different county within same state (%) - Black or African American
Geographical mobility - Moved from different county within same state (%) - Asian
Geographical mobility - Moved from different county within same state (%) - Hispanic or Latino
Geographical mobility - Moved from different county within same state (%) - American Indian and Alaska Native
Geographical mobility - Moved from different county within same state (%) - Multirace
Geographical mobility - Moved from different county within same state (%) - Other Race
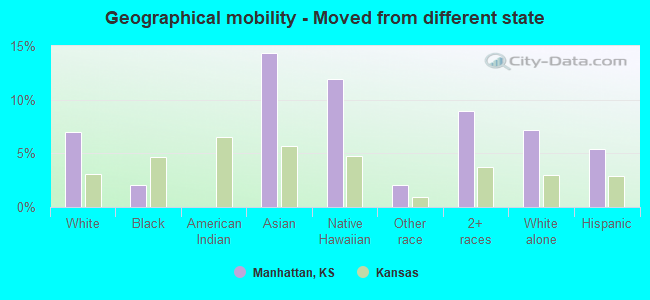
Geographical mobility - Moved from different state (%)
Geographical mobility - Moved from different state (%) - White
Geographical mobility - Moved from different state (%) - Black or African American
Geographical mobility - Moved from different state (%) - Asian
Geographical mobility - Moved from different state (%) - Hispanic or Latino
Geographical mobility - Moved from different state (%) - American Indian and Alaska Native
Geographical mobility - Moved from different state (%) - Multirace
Geographical mobility - Moved from different state (%) - Other Race
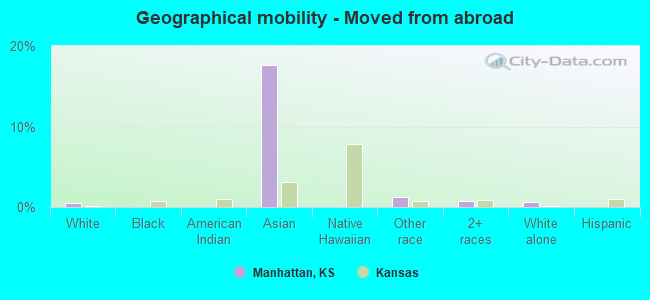
Geographical mobility - Moved from abroad (%)
Geographical mobility - Moved from abroad (%) - White
Geographical mobility - Moved from abroad (%) - Black or African American
Geographical mobility - Moved from abroad (%) - Asian
Geographical mobility - Moved from abroad (%) - Hispanic or Latino
Geographical mobility - Moved from abroad (%) - American Indian and Alaska Native
Geographical mobility - Moved from abroad (%) - Multirace
Geographical mobility - Moved from abroad (%) - Other Race
Place of birth for the foreign-born population - Ireland (%)
Place of birth for the foreign-born population - Denmark (%)
Place of birth for the foreign-born population - Norway (%)
Place of birth for the foreign-born population - Sweden (%)
Place of birth for the foreign-born population - United Kingdom (%)
Place of birth for the foreign-born population - England (%)
Place of birth for the foreign-born population - Scotland (%)
Place of birth for the foreign-born population - Other Northern Europe (%)
Place of birth for the foreign-born population - Austria (%)
Place of birth for the foreign-born population - Belgium (%)
Place of birth for the foreign-born population - France (%)
Place of birth for the foreign-born population - Germany (%)
Place of birth for the foreign-born population - Netherlands (%)
Place of birth for the foreign-born population - Switzerland (%)
Place of birth for the foreign-born population - Other Western Europe (%)
Place of birth for the foreign-born population - Greece (%)
Place of birth for the foreign-born population - Italy (%)
Place of birth for the foreign-born population - Portugal (%)
Place of birth for the foreign-born population - Spain (%)
Place of birth for the foreign-born population - Other Southern Europe (%)
Place of birth for the foreign-born population - Albania (%)
Place of birth for the foreign-born population - Belarus (%)
Place of birth for the foreign-born population - Bosnia and Herzegovina (%)
Place of birth for the foreign-born population - Bulgaria (%)
Place of birth for the foreign-born population - Croatia (%)
Place of birth for the foreign-born population - Czechoslovakia (%)
Place of birth for the foreign-born population - Hungary (%)
Place of birth for the foreign-born population - Latvia (%)
Place of birth for the foreign-born population - Lithuania (%)
Place of birth for the foreign-born population - North Macedonia (Macedonia) (%)
Place of birth for the foreign-born population - Moldova (%)
Place of birth for the foreign-born population - Poland (%)
Place of birth for the foreign-born population - Romania (%)
Place of birth for the foreign-born population - Russia (%)
Place of birth for the foreign-born population - Serbia (%)
Place of birth for the foreign-born population - Ukraine (%)
Place of birth for the foreign-born population - Other Eastern Europe (%)
Place of birth for the foreign-born population - China (%)
Place of birth for the foreign-born population - Hong Kong (%)
Place of birth for the foreign-born population - Taiwan (%)
Place of birth for the foreign-born population - Japan (%)
Place of birth for the foreign-born population - Korea (%)
Place of birth for the foreign-born population - Other Eastern Asia (%)
Place of birth for the foreign-born population - Afghanistan (%)
Place of birth for the foreign-born population - Bangladesh (%)
Place of birth for the foreign-born population - India (%)
Place of birth for the foreign-born population - Iran (%)
Place of birth for the foreign-born population - Kazakhstan (%)
Place of birth for the foreign-born population - Nepal (%)
Place of birth for the foreign-born population - Pakistan (%)
Place of birth for the foreign-born population - Sri Lanka (%)
Place of birth for the foreign-born population - Uzbekistan (%)
Place of birth for the foreign-born population - Other South Central Asia (%)
Place of birth for the foreign-born population - Burma (%)
Place of birth for the foreign-born population - Cambodia (%)
Place of birth for the foreign-born population - Indonesia (%)
Place of birth for the foreign-born population - Laos (%)
Place of birth for the foreign-born population - Malaysia (%)
Place of birth for the foreign-born population - Philippines (%)
Place of birth for the foreign-born population - Singapore (%)
Place of birth for the foreign-born population - Thailand (%)
Place of birth for the foreign-born population - Vietnam (%)
Place of birth for the foreign-born population - Other South Eastern Asia (%)
Place of birth for the foreign-born population - Armenia (%)
Place of birth for the foreign-born population - Iraq (%)
Place of birth for the foreign-born population - Israel (%)
Place of birth for the foreign-born population - Jordan (%)
Place of birth for the foreign-born population - Kuwait (%)
Place of birth for the foreign-born population - Lebanon (%)
Place of birth for the foreign-born population - Saudi Arabia (%)
Place of birth for the foreign-born population - Syria (%)
Place of birth for the foreign-born population - Turkey (%)
Place of birth for the foreign-born population - Yemen (%)
Place of birth for the foreign-born population - Other Western Asia (%)
Place of birth for the foreign-born population - Eritrea (%)
Place of birth for the foreign-born population - Ethiopia (%)
Place of birth for the foreign-born population - Kenya (%)
Place of birth for the foreign-born population - Somalia (%)
Place of birth for the foreign-born population - Uganda (%)
Place of birth for the foreign-born population - Zimbabwe (%)
Place of birth for the foreign-born population - Other Eastern Africa (%)
Place of birth for the foreign-born population - Cameroon (%)
Place of birth for the foreign-born population - Congo (%)
Place of birth for the foreign-born population - Democratic Republic of Congo (Zaire) (%)
Place of birth for the foreign-born population - Other Middle Africa (%)
Place of birth for the foreign-born population - Egypt (%)
Place of birth for the foreign-born population - Morocco (%)
Place of birth for the foreign-born population - Sudan (%)
Place of birth for the foreign-born population - Other Northern Africa (%)
Place of birth for the foreign-born population - South Africa (%)
Place of birth for the foreign-born population - Other Southern Africa (%)
Place of birth for the foreign-born population - Cabo Verde (%)
Place of birth for the foreign-born population - Ghana (%)
Place of birth for the foreign-born population - Liberia (%)
Place of birth for the foreign-born population - Nigeria (%)
Place of birth for the foreign-born population - Senegal (%)
Place of birth for the foreign-born population - Sierra Leone (%)
Place of birth for the foreign-born population - Other Western Africa (%)
Place of birth for the foreign-born population - Australia (%)
Place of birth for the foreign-born population - New Zealand (%)
Place of birth for the foreign-born population - Fiji (%)
Place of birth for the foreign-born population - Micronesia (%)
Place of birth for the foreign-born population - Bahamas (%)
Place of birth for the foreign-born population - Barbados (%)
Place of birth for the foreign-born population - Cuba (%)
Place of birth for the foreign-born population - Dominica (%)
Place of birth for the foreign-born population - Dominican Republic (%)
Place of birth for the foreign-born population - Grenada (%)
Place of birth for the foreign-born population - Haiti (%)
Place of birth for the foreign-born population - Jamaica (%)
Place of birth for the foreign-born population - St. Vincent and the Grenadines (%)
Place of birth for the foreign-born population - Trinidad and Tobago (%)
Place of birth for the foreign-born population - West Indies (%)
Place of birth for the foreign-born population - Other Caribbean (%)
Place of birth for the foreign-born population - Belize (%)
Place of birth for the foreign-born population - Costa Rica (%)
Place of birth for the foreign-born population - El Salvador (%)
Place of birth for the foreign-born population - Guatemala (%)
Place of birth for the foreign-born population - Honduras (%)
Place of birth for the foreign-born population - Mexico (%)
Place of birth for the foreign-born population - Nicaragua (%)
Place of birth for the foreign-born population - Panama (%)
Place of birth for the foreign-born population - Other Central America (%)
Place of birth for the foreign-born population - Argentina (%)
Place of birth for the foreign-born population - Bolivia (%)
Place of birth for the foreign-born population - Brazil (%)
Place of birth for the foreign-born population - Chile (%)
Place of birth for the foreign-born population - Colombia (%)
Place of birth for the foreign-born population - Ecuador (%)
Place of birth for the foreign-born population - Guyana (%)
Place of birth for the foreign-born population - Peru (%)
Place of birth for the foreign-born population - Uruguay (%)
Place of birth for the foreign-born population - Venezuela (%)
Place of birth for the foreign-born population - Other South America (%)
Place of birth for the foreign-born population - Canada (%)
Place of birth for the foreign-born population - Other Northern America (%)
Place of birth for the foreign-born population - Other (%)
Latest news about races in Manhattan, KS collected exclusively by city-data.com from local newspapers, TV, and radio stations
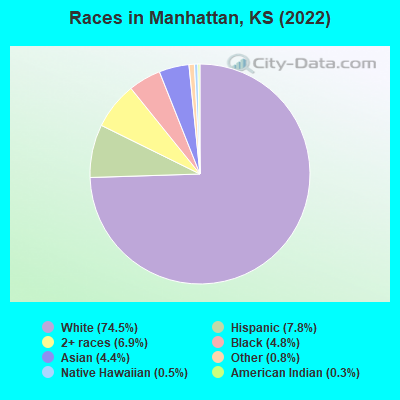
According to 2022 data, the most numerous races in Manhattan, KS are White alone (39,870 residents), Hispanic (4,194 residents), and Black alone (2,596 residents). 91.4% of Manhattan residents speak English at home. 8.0% of Manhattan, KS residents are foreign-born (4.2% born in Asia, 2.2% born in Latin America), which is 12.7% greater than the foreign-born rate of 7.0% across the entire state of Kansas.
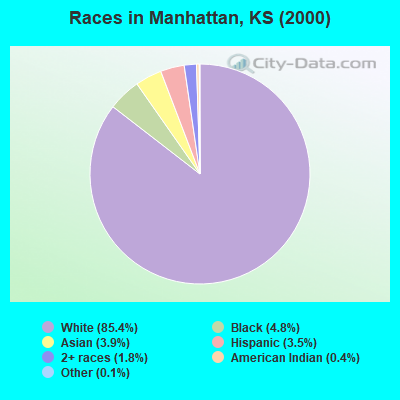
Race distribution in Manhattan
2000 2022
2,233,997 83.1% White alone 188,252 7.0% Hispanic 151,407 5.6% Black alone 46,301 1.7% Asian alone 42,508 1.6% Two or more races 22,322 0.8% American Indian alone 2,477 0.09% Other race alone 1,154 0.04% Native Hawaiian and Other
2,147,943 73.1% White alone 381,746 13.0% Hispanic 147,666 5.0% Black alone 145,362 4.9% Two or more races 85,085 2.9% Asian alone 13,263 0.5% Other race alone 12,065 0.4% American Indian alone 4,020 0.1% Native Hawaiian and Other
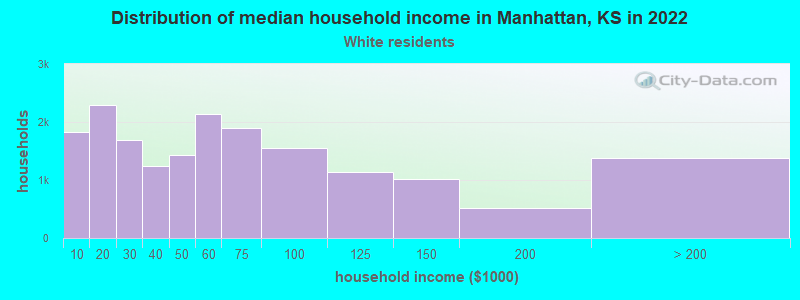
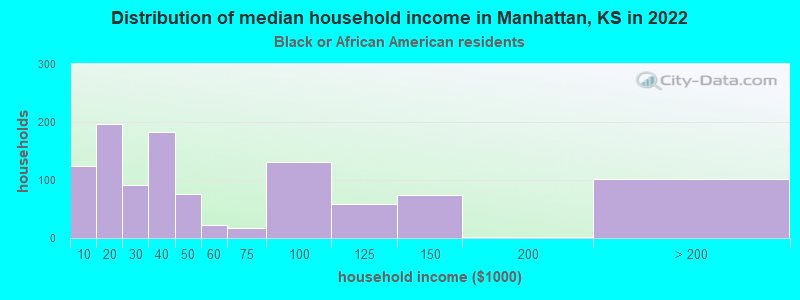
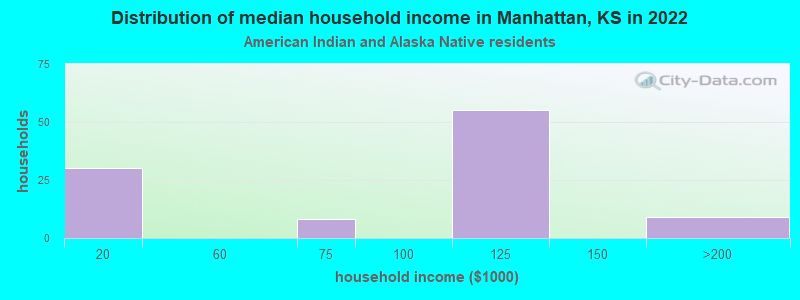
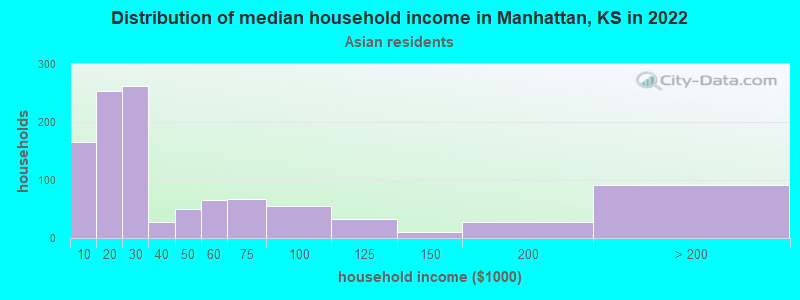
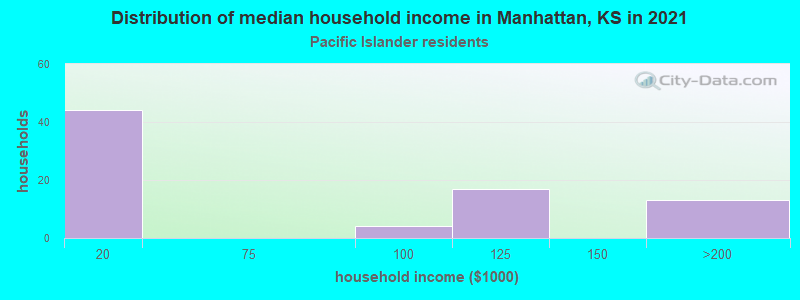
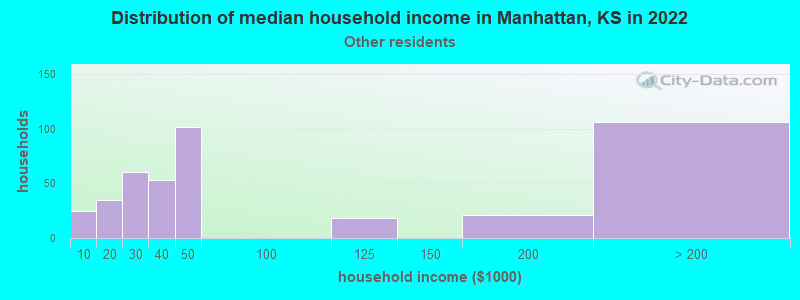
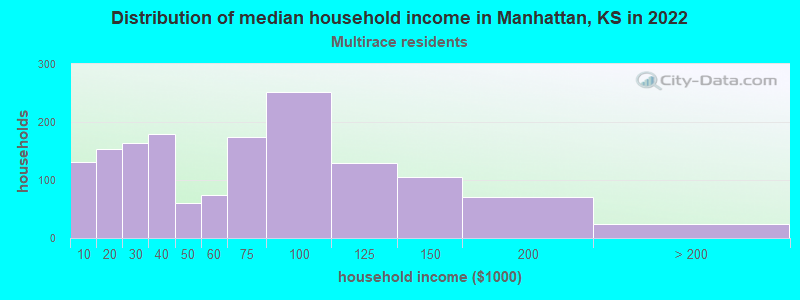
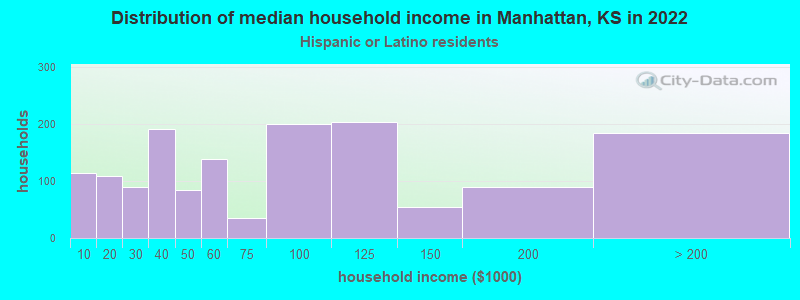
Income and house value in Manhattan Median household income in 2022 $53,620 White non-Hispanic householders$34,540 Black householders$128,743 American Indian and Alaska Native householders$23,402 Asian householders$119,902 Native Hawaiian and other Pacific Islander householders$28,048 Some other race householders$41,031 Two or more races householders$34,008 Hispanic or Latino race householdersMedian 2022 house value $237,340 White Non-Hispanic householders$190,018 Black or African American householders$168,309 American Indian or Alaska Native householders $237,828 Asian householders$250,024 Some other race householders$257,586 Two or more races householders$247,097 Hispanic or Latino householders
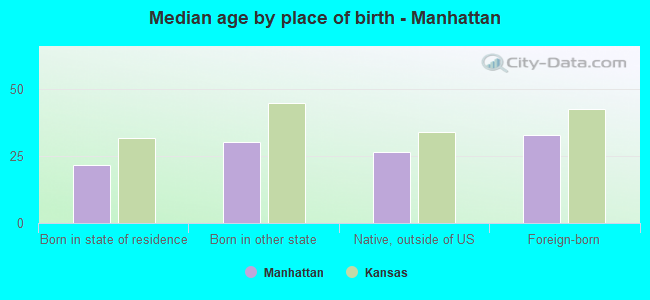
Median age by race in Manhattan
25.1 Median age for White residents24.5 25.5 32.9 Median age for Black or African American residents28.5 23.9 20.7 Median age for American Indian / Alaska Native residents21.0 20.3 27.0 Median age for Asian residents22.8 31.1 39.5 Median age for Native Hawaiian / Pacific Islander residents-669,240,668.6 29.8 29.5 Median age for Other race residents28.6 30.8 23.9 Median age for Two or more races residents24.6 21.4 25.1 Median age for White alone residents24.1 25.6 24.6 Median age for Hispanic or Latino residents26.3 23.9
Owner/renter occupied households by race in Manhattan
House owners and renters - White residents 7,244 40.1% Owner occupied10,814 59.9% Renter occupiedHouse owners and renters - Black or African American residents 367 32.8% Owner occupied751 67.2% Renter occupiedHouse owners and renters - American Indian / Alaska Native residents 92 78.3% Owner occupied26 21.7% Renter occupiedHouse owners and renters - Asian residents 459 50.7% Owner occupied447 49.3% Renter occupiedHouse owners and renters - Native Hawaiian / Pacific Islander residents 49 45.9% Owner occupied58 54.1% Renter occupiedHouse owners and renters - Other race residents 110 19.5% Owner occupied454 80.5% Renter occupiedHouse owners and renters - Two or more races residents 456 27.7% Owner occupied1,192 72.3% Renter occupiedHouse owners and renters - White alone residents 7,070 40.0% Owner occupied10,599 60.0% Renter occupiedHouse owners and renters - Hispanic or Latino residents 558 35.5% Owner occupied1,013 64.5% Renter occupied
Language usage in Manhattan
English speakers - Total 91.4% of residents of Manhattan speak English at home.
4.3% of residents speak Spanish at home 1,306 59.7% Speak English very well880 40.3% Speak English less than very well4.2% of residents speak other language at home 1,504 70.6% Speak English very well626 29.4% Speak English less than very well
English speakers - Born in the United States 94.3% of residents of Manhattan speak English at home.
4.0% of residents speak Spanish at home 707 95.3% Speak English very well35 4.7% Speak English less than very well1.2% of residents speak other language at home 212 93.8% Speak English very well14 6.2% Speak English less than very well
English speakers - Native, born elsewhere 89.8% of residents of Manhattan speak English at home.
5.3% of residents speak Spanish at home 113 100.0% Speak English very well1.2% of residents speak other language at home 25 100.0% Speak English very well
English speakers - Foreign-born 29.5% of residents of Manhattan speak English at home.
25.6% of residents speak Spanish at home 245 26.8% Speak English very well669 73.2% Speak English less than very well43.7% of residents speak other language at home 982 62.9% Speak English very well579 37.1% Speak English less than very well
White (Caucasian) - Speak only English Native:
98.6% (38,176)Foreign-born:
16.9% (117)
White (Caucasian) - Speak another language Native:
1.4% (523)Foreign-born:
85.5% (593)
Black or African American - Speak only English Native:
95.9% (2,124)Foreign-born:
12.2% (32)
Black or African American - Speak another language Native:
4.1% (90)Foreign-born:
87.1% (228)
American Indian / Alaska Native - Speak only English Native:
72.0% (184)Foreign-born:
8.1% (42)
American Indian / Alaska Native - Speak another language Native:
33.8% (86)Foreign-born:
89.8% (468)
Asian - Speak only English Native:
68.2% (565)Foreign-born:
40.9% (608)
Asian - Speak another language Native:
30.3% (251)Foreign-born:
58.4% (867)
Native Hawaiian / Pacific Islander - Speak only English Native:
79.4% (124)Foreign-born:
36.4% (60)
Other race - Speak only English Native:
72.0% (672)Foreign-born:
21.7% (61)
Other race - Speak another language Native:
31.8% (297)Foreign-born:
82.8% (233)
Two or more races - Speak only English Native:
91.4% (3,824)Foreign-born:
11.7% (114)
Two or more races - Speak another language Native:
5.4% (226)Foreign-born:
87.7% (850)
White alone - Speak only English Native:
99.0% (37,500)Foreign-born:
15.4% (112)
White alone - Speak another language Native:
0.9% (343)Foreign-born:
94.4% (688)
Hispanic or Latino - Speak only English Native:
64.0% (1,851)Foreign-born:
11.8% (123)
Hispanic or Latino - Speak another language Native:
36.1% (1,042)Foreign-born:
88.5% (922)
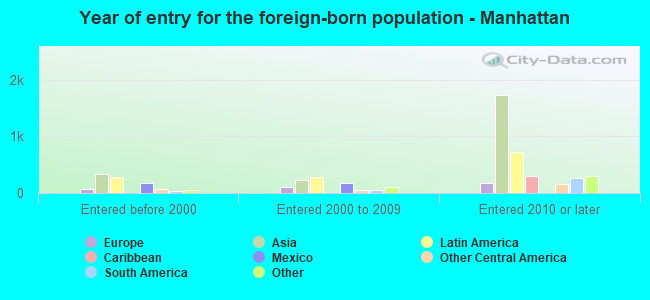
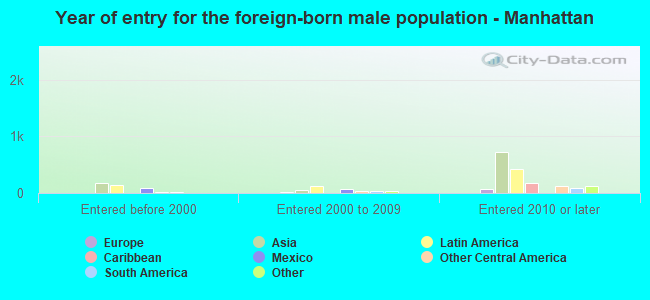
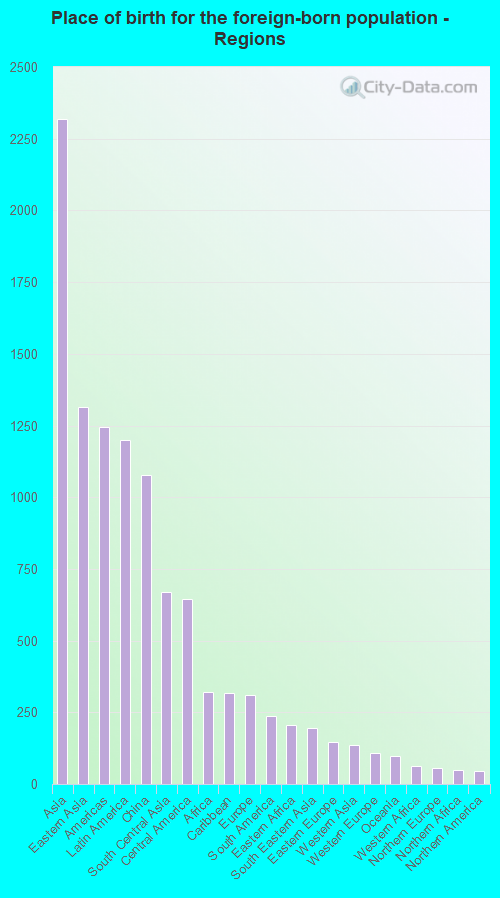
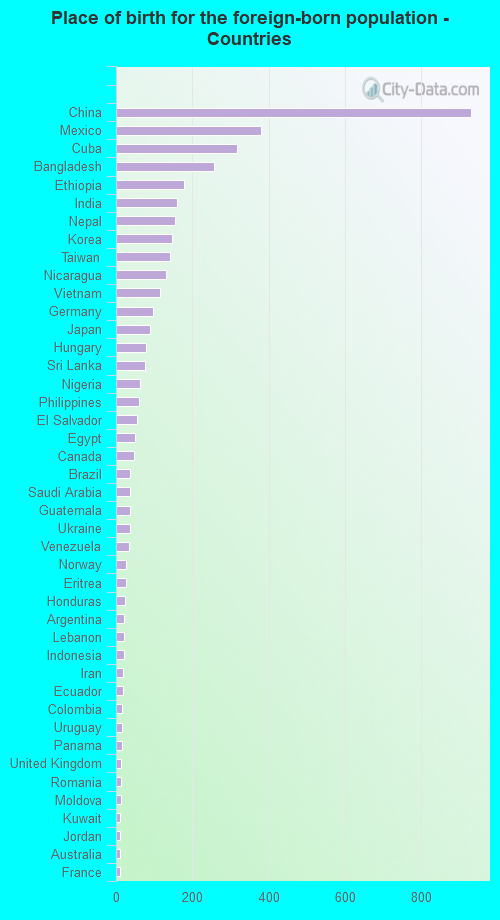
Foreign-born residents in Manhattan 4,291 residents are foreign born (4.2% Asia , 2.2% Latin America ).
This city:
8.0%Kansas:
7.1%
Marital status for residents in Manhattan Marital status - White (Caucasian) population 15 years and over
Males 61.6% Never married29.8% Now married0.4% Separated1.7% Widowed6.5% DivorcedFemales 52.3% Never married32.8% Now married0.8% Separated4.5% Widowed9.6% DivorcedWomen who gave birth in the past 12 months Now married:
71.6% (228)Unmarried:
28.4% (90)
Women who did not give birth in the past 12 months Now married:
23.8% (3,089)Unmarried:
76.2% (9,891)
Marital status - Black or African American population 15 years and over
Males 51.3% Never married36.6% Now married1.2% Separated1.1% Widowed9.7% DivorcedFemales 56.4% Never married25.3% Now married1.2% Separated3.6% Widowed13.5% DivorcedWomen who did not give birth in the past 12 months Now married:
24.0% (181)Unmarried:
76.0% (570)
Marital status - American Indian / Alaska Native population 15 years and over
Males 8.3% Never married80.6% Now married0.0% Separated0.0% Widowed11.1% DivorcedFemales 22.0% Never married53.2% Now married0.0% Separated13.5% Widowed11.3% DivorcedWomen who gave birth in the past 12 months Now married:
0.0% (0)Unmarried:
100.0% (25)
Women who did not give birth in the past 12 months Now married:
56.9% (66)Unmarried:
43.1% (50)
Marital status - Asian population 15 years and over
Males 43.3% Never married56.1% Now married0.0% Separated0.0% Widowed0.6% DivorcedFemales 50.3% Never married44.0% Now married0.0% Separated3.3% Widowed2.3% DivorcedWomen who gave birth in the past 12 months Now married:
99.9% (1)Unmarried:
0.0% (0)
Women who did not give birth in the past 12 months Now married:
35.2% (408)Unmarried:
64.8% (753)
Marital status - Native Hawaiian / Pacific Islander population 15 years and over
Males 0.0% Never married66.1% Now married0.0% Separated0.0% Widowed33.9% DivorcedFemales 38.8% Never married32.9% Now married0.0% Separated0.0% Widowed28.2% DivorcedWomen who did not give birth in the past 12 months Now married:
45.9% (29)Unmarried:
54.1% (35)
Marital status - Other race population 15 years and over
Males 44.3% Never married38.9% Now married0.0% Separated0.0% Widowed16.7% DivorcedFemales 55.7% Never married21.7% Now married0.0% Separated0.0% Widowed22.6% DivorcedWomen who gave birth in the past 12 months Now married:
0.0% (0)Unmarried:
100.0% (13)
Women who did not give birth in the past 12 months Now married:
19.8% (83)Unmarried:
80.2% (337)
Marital status - Two or more races population 15 years and over
Males 51.2% Never married42.6% Now married4.9% Separated0.5% Widowed0.8% DivorcedFemales 68.5% Never married28.8% Now married0.0% Separated0.0% Widowed2.6% DivorcedWomen who gave birth in the past 12 months Now married:
100.0% (13)Unmarried:
0.0% (0)
Women who did not give birth in the past 12 months Now married:
23.3% (405)Unmarried:
76.7% (1,330)
Marital status - White alone, not Hispanic / Latino population 15 years and over
Males 61.8% Never married29.9% Now married0.4% Separated1.7% Widowed6.3% DivorcedFemales 52.4% Never married32.9% Now married0.9% Separated4.6% Widowed9.3% DivorcedWomen who gave birth in the past 12 months Now married:
63.1% (136)Unmarried:
36.9% (80)
Women who did not give birth in the past 12 months Now married:
24.0% (3,048)Unmarried:
76.0% (9,648)
Marital status - Hispanic or Latino population 15 years and over
Males 49.4% Never married40.7% Now married0.0% Separated0.8% Widowed9.2% DivorcedFemales 51.2% Never married37.7% Now married0.0% Separated1.7% Widowed9.5% DivorcedWomen who gave birth in the past 12 months Now married:
71.0% (116)Unmarried:
29.0% (47)
Women who did not give birth in the past 12 months Now married:
30.8% (388)Unmarried:
69.2% (871)
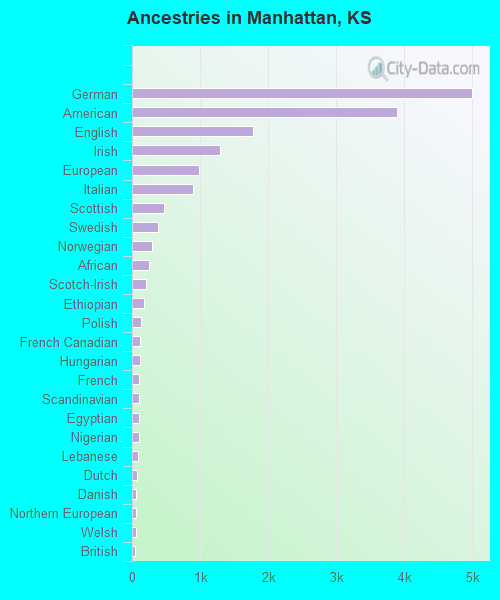
Ancestries in Manhattan
4,995 20.1% German3,896 15.7% American1,775 7.1% English1,297 5.2% Irish989 4.0% European890 3.6% Italian477 1.9% Scottish386 1.6% Swedish289 1.2% Norwegian251 1.0% African203 0.8% Scotch-Irish170 0.7% Ethiopian125 0.5% Polish123 0.5% French Canadian112 0.5% Hungarian110 0.4% French109 0.4% Scandinavian100 0.4% Egyptian98 0.4% Nigerian86 0.3% Lebanese80 0.3% Dutch57 0.2% Danish55 0.2% Northern European55 0.2% Welsh50 0.2% British43 0.2% Russian42 0.2% Trinidadian and Tobagonian41 0.2% Czech40 0.2% Belgian38 0.2% Eastern European35 0.1% Sudanese33 0.1% Lithuanian28 0.1% Ukrainian19 0.08% Canadian16 0.06% Jordanian16 0.06% Pennsylvania German15 0.06% Croatian15 0.06% Greek13 0.05% Cajun12 0.05% Finnish9 0.04% Swiss8 0.03% Slovak6 0.02% Brazilian5 0.02% Iranian5 0.02% Romanian5 0.02% Czechoslovakian
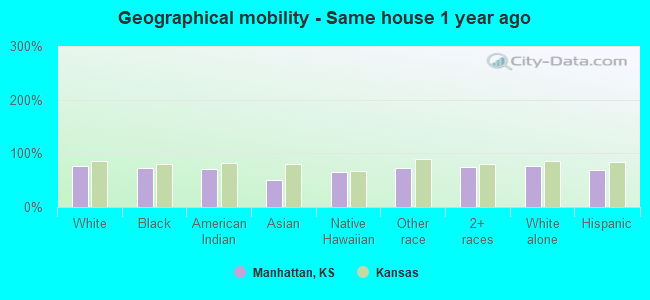
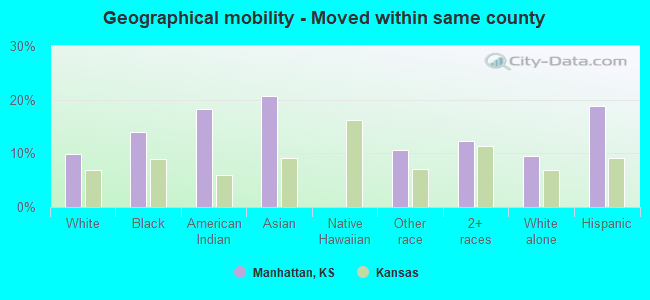
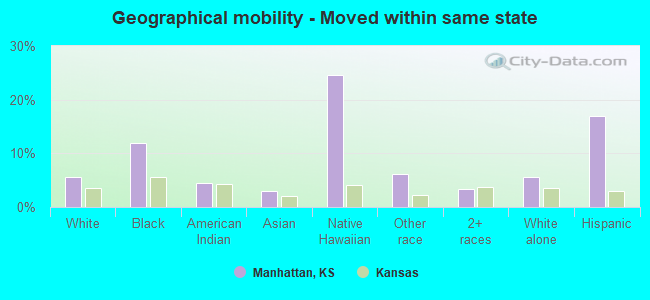
Geographical mobility in Manhattan Same house 1 year ago 30,738 75.9% White (Caucasian)1,957 72.1% Black or African American386 70.0% American Indian / Alaska Native1,320 50.9% Asian115 65.1% Native Hawaiian / Pacific Islander916 72.9% Other race3,915 74.0% Two or more races30,054 75.9% White alone, not Hispanic / Latino2,860 68.9% Hispanic or LatinoMoved within same county 3,974 9.8% White / Caucasian378 13.9% Black or African American101 18.3% American Indian / Alaska Native535 20.6% Asian133 10.6% Other race647 12.2% Two or more races3,788 9.6% White alone, not Hispanic / Latino780 18.8% Hispanic or LatinoMoved within same state 2,288 5.7% White / Caucasian323 11.9% Black or African American24 4.4% American Indian / Alaska Native77 3.0% Asian43 24.6% Native Hawaiian / Pacific Islander77 6.1% Other race174 3.3% Two or more races2,220 5.6% White alone, not Hispanic / Latino703 16.9% Hispanic or LatinoMoved from different state 2,829 7.0% White / Caucasian57 2.1% Black or African American373 14.4% Asian21 12.0% Native Hawaiian / Pacific Islander25 2.0% Other race472 8.9% Two or more races2,838 7.2% White alone, not Hispanic / Latino223 5.4% Hispanic or LatinoMoved from abroad 223 0.6% White458 17.7% Asian16 1.2% Other race39 0.7% Two or more races244 0.6% White alone, not Hispanic / Latino
Children Nativity (place of birth) in Manhattan
Children under 6 years - Living with two parents Both parents native 1,477 100.0% Native0 0.0% Foreign-bornBoth parents foreign-born 145 99.2% Native1 0.8% Foreign-bornOne native, one foreign-born parent 57 100.0% NativeChildren under 6 years - Living with one parent Native parent 630 100.0% NativeForeign-born parent 147 85.0% Native26 15.0% Foreign-bornChildren 6 to 17 years - Living with two parents Both parents native 2,240 100.0% NativeBoth parents foreign-born 38 14.4% Native222 85.6% Foreign-bornOne native, one foreign-born parent 271 95.1% Native14 4.9% Foreign-bornChildren 6 to 17 years - Living with one parent Native parent 1,948 100.0% NativeForeign-born parent 138 52.8% Native124 47.2% Foreign-born
Grandparents responsible for own grandchildren in Manhattan
Grandparents (30 to 59 years) White / Caucasian 38 60.4% Responsible for grandchildren25 39.6% Not responsible for grandchildrenAmerican Indian / Alaska Native 17 100.0% Not responsible for grandchildrenWhite alone, not Hispanic / Latino 40 59.8% Responsible for grandchildren27 40.2% Not responsible for grandchildrenGrandparents (60 years and over) White / Caucasian 34 50.7% Responsible for grandchildren33 49.3% Not responsible for grandchildrenWhite alone, not Hispanic / Latino 35 49.1% Responsible for grandchildren36 50.9% Not responsible for grandchildren