Races in Manhattan, New York (NY) Detailed Stats
Ancestries, Foreign-born residents, place of birth
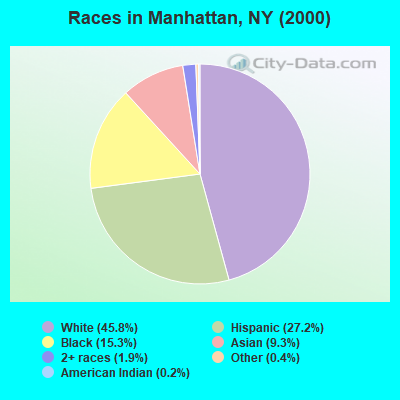
Race distribution in Manhattan

- 703,87345.8%White alone
- 417,81627.2%Hispanic
- 234,69815.3%Black alone
- 143,2919.3%Asian alone
- 28,9441.9%Two or more races
- 5,5360.4%Other race alone
- 2,4650.2%American Indian alone
- 5720.04%Native Hawaiian and Other
Pacific Islander alone
2000
2022
-
- 11,760,98162.0%White alone
- 2,867,58315.1%Hispanic
- 2,812,62314.8%Black alone
- 1,035,9265.5%Asian alone
- 366,1161.9%Two or more races
- 75,4990.4%Other race alone
- 52,4990.3%American Indian alone
- 5,2300.03%Native Hawaiian and Other
Pacific Islander alone

-
- 10,408,93352.9%White alone
- 3,867,29919.7%Hispanic
- 2,633,84013.4%Black alone
- 1,776,2869.0%Asian alone
- 732,6703.7%Two or more races
- 216,1101.1%Other race alone
- 35,0820.2%American Indian alone
- 6,9310.04%Native Hawaiian and Other
Pacific Islander alone

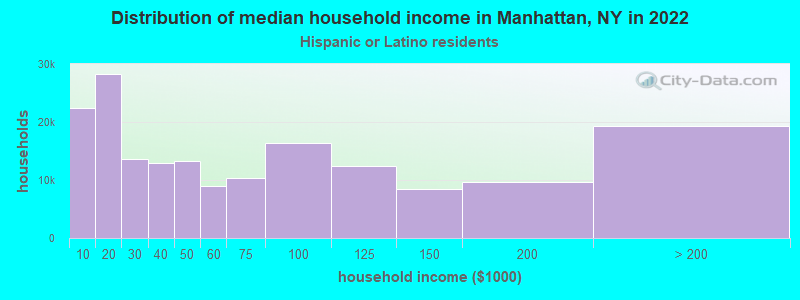
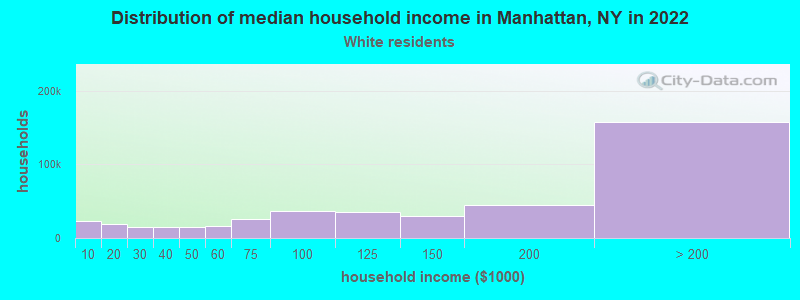
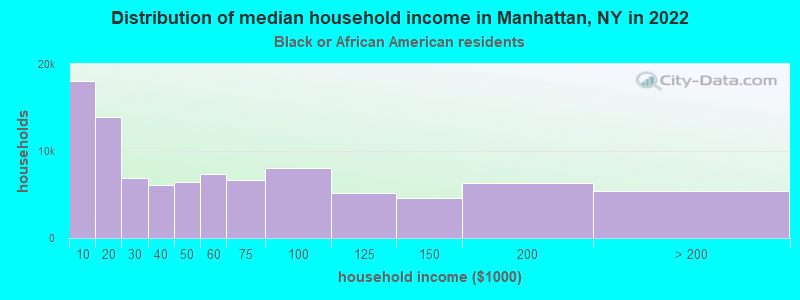
Income and house value in Manhattan
- Median household income in 2022
- $143,822White non-Hispanic householders
- $42,209Black householders
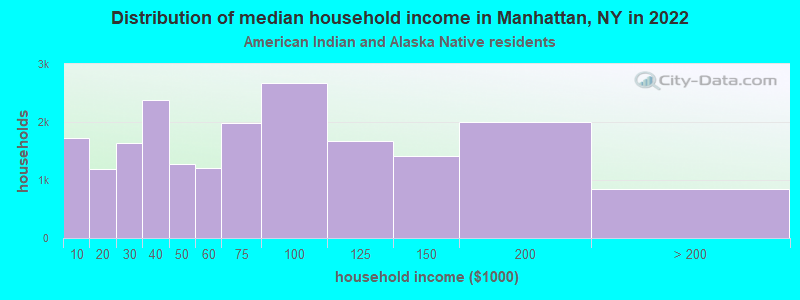
- $62,687American Indian and Alaska Native householders
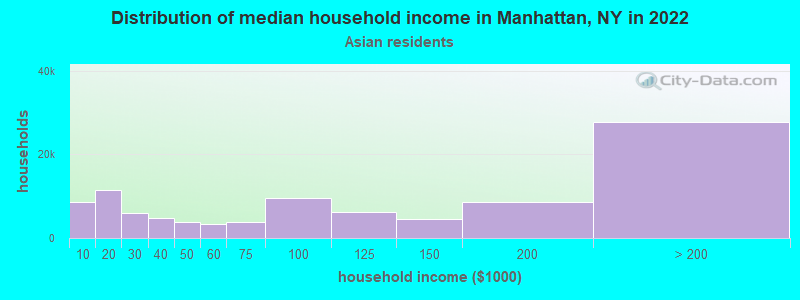
- $92,258Asian householders
- $40,081Some other race householders
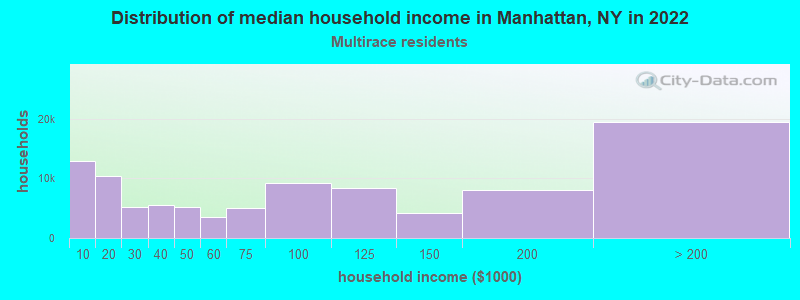
- $76,060Two or more races householders
- $48,091Hispanic or Latino race householders
- Median 2022 house value
- over $1,000,000White Non-Hispanic householders
- $877,655Black or African American householders
- $383,103American Indian or Alaska Native householders
- over $1,000,000Asian householders
- $661,724Some other race householders
- over $1,000,000Two or more races householders
- $682,621Hispanic or Latino householders
Household income for White non-Hispanic householders
Household income for Black householders
Household income for American Indian and Alaska Native householders
Household income for Asian householders
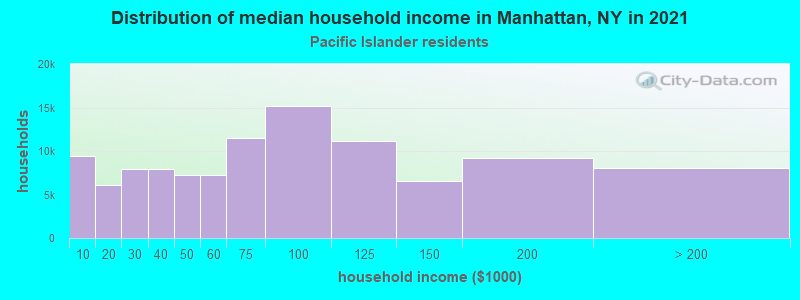
Household income for Native Hawaiian and other Pacific Islander householders
Household income for Two or more races householders
Household income for Hispanic or Latino race householders