Races in Maple Heights, Ohio (OH) Detailed Stats
Data:
Races - White alone (%)
Races - White alone (% change since 2000)
Races - Black alone (%)
Races - Black alone (% change since 2000)
Races - American Indian alone (%)
Races - American Indian alone (% change since 2000)
Races - Asian alone (%)
Races - Asian alone (% change since 2000)
Races - Hispanic (%)
Races - Hispanic (% change since 2000)
Races - Native Hawaiian and Other Pacific Islander alone (%)
Races - Native Hawaiian and Other Pacific Islander alone (% change since 2000)
Races - Two or more races(%)
Races - Two or more races(% change since 2000)
Races - Other race alone (%)
Races - Other race alone (% change since 2000)
Racial diversity
Place of birth - Born in state of residence (%)
Place of birth - Born in state of residence (%) - White
Place of birth - Born in state of residence (%) - Black or African American
Place of birth - Born in state of residence (%) - Asian
Place of birth - Born in state of residence (%) - Hispanic or Latino
Place of birth - Born in state of residence (%) - American Indian and Alaska Native
Place of birth - Born in state of residence (%) - Multirace
Place of birth - Born in state of residence (%) - Other Race
Place of birth - Born in other state (%)
Place of birth - Born in other state (%) - White
Place of birth - Born in other state (%) - Black or African American
Place of birth - Born in other state (%) - Asian
Place of birth - Born in other state (%) - Hispanic or Latino
Place of birth - Born in other state (%) - American Indian and Alaska Native
Place of birth - Born in other state (%) - Multirace
Place of birth - Born in other state (%) - Other Race
Place of birth - Native, outside of US (%)
Place of birth - Native, outside of US (%) - White
Place of birth - Native, outside of US (%) - Black or African American
Place of birth - Native, outside of US (%) - Asian
Place of birth - Native, outside of US (%) - Hispanic or Latino
Place of birth - Native, outside of US (%) - American Indian and Alaska Native
Place of birth - Native, outside of US (%) - Multirace
Place of birth - Native, outside of US (%) - Other Race
Place of birth - Foreign born (%)
Place of birth - Foreign born (%) - White
Place of birth - Foreign born (%) - Black or African American
Place of birth - Foreign born (%) - Asian
Place of birth - Foreign born (%) - Hispanic or Latino
Place of birth - Foreign born (%) - American Indian and Alaska Native
Place of birth - Foreign born (%) - Multirace
Place of birth - Foreign born (%) - Other Race
Residents speaking English at home (%)
Residents speaking English at home - Born in the United States (%)
Residents speaking English at home - Native, born elsewhere (%)
Residents speaking English at home - Foreign born (%)
Residents speaking Spanish at home (%)
Residents speaking Spanish at home - Born in the United States (%)
Residents speaking Spanish at home - Native, born elsewhere (%)
Residents speaking Spanish at home - Foreign born (%)
Residents speaking other language at home (%)
Residents speaking other language at home - Born in the United States (%)
Residents speaking other language at home - Native, born elsewhere (%)
Residents speaking other language at home - Foreign born (%)
Marital status - Never married (%)
Marital status - Now married (%)
Marital status - Separated (%)
Marital status - Widowed (%)
Marital status - Divorced (%)
Ancestries Reported - Arab (%)
Ancestries Reported - Czech (%)
Ancestries Reported - Danish (%)
Ancestries Reported - Dutch (%)
Ancestries Reported - English (%)
Ancestries Reported - French (%)
Ancestries Reported - French Canadian (%)
Ancestries Reported - German (%)
Ancestries Reported - Greek (%)
Ancestries Reported - Hungarian (%)
Ancestries Reported - Irish (%)
Ancestries Reported - Italian (%)
Ancestries Reported - Lithuanian (%)
Ancestries Reported - Norwegian (%)
Ancestries Reported - Polish (%)
Ancestries Reported - Portuguese (%)
Ancestries Reported - Russian (%)
Ancestries Reported - Scotch-Irish (%)
Ancestries Reported - Scottish (%)
Ancestries Reported - Slovak (%)
Ancestries Reported - Subsaharan African (%)
Ancestries Reported - Swedish (%)
Ancestries Reported - Swiss (%)
Ancestries Reported - Ukrainian (%)
Ancestries Reported - United States (%)
Ancestries Reported - Welsh (%)
Ancestries Reported - West Indian (%)
Ancestries Reported - Other (%)
Geographical mobility - Same house 1 year ago (%)
Geographical mobility - Same house 1 year ago (%) - White
Geographical mobility - Same house 1 year ago (%) - Black or African American
Geographical mobility - Same house 1 year ago (%) - Asian
Geographical mobility - Same house 1 year ago (%) - Hispanic or Latino
Geographical mobility - Same house 1 year ago (%) - American Indian and Alaska Native
Geographical mobility - Same house 1 year ago (%) - Multirace
Geographical mobility - Same house 1 year ago (%) - Other Race
Geographical mobility - Moved within same county (%)
Geographical mobility - Moved within same county (%) - White
Geographical mobility - Moved within same county (%) - Black or African American
Geographical mobility - Moved within same county (%) - Asian
Geographical mobility - Moved within same county (%) - Hispanic or Latino
Geographical mobility - Moved within same county (%) - American Indian and Alaska Native
Geographical mobility - Moved within same county (%) - Multirace
Geographical mobility - Moved within same county (%) - Other Race
Geographical mobility - Moved from different county within same state (%)
Geographical mobility - Moved from different county within same state (%) - White
Geographical mobility - Moved from different county within same state (%) - Black or African American
Geographical mobility - Moved from different county within same state (%) - Asian
Geographical mobility - Moved from different county within same state (%) - Hispanic or Latino
Geographical mobility - Moved from different county within same state (%) - American Indian and Alaska Native
Geographical mobility - Moved from different county within same state (%) - Multirace
Geographical mobility - Moved from different county within same state (%) - Other Race
Geographical mobility - Moved from different state (%)
Geographical mobility - Moved from different state (%) - White
Geographical mobility - Moved from different state (%) - Black or African American
Geographical mobility - Moved from different state (%) - Asian
Geographical mobility - Moved from different state (%) - Hispanic or Latino
Geographical mobility - Moved from different state (%) - American Indian and Alaska Native
Geographical mobility - Moved from different state (%) - Multirace
Geographical mobility - Moved from different state (%) - Other Race
Geographical mobility - Moved from abroad (%)
Geographical mobility - Moved from abroad (%) - White
Geographical mobility - Moved from abroad (%) - Black or African American
Geographical mobility - Moved from abroad (%) - Asian
Geographical mobility - Moved from abroad (%) - Hispanic or Latino
Geographical mobility - Moved from abroad (%) - American Indian and Alaska Native
Geographical mobility - Moved from abroad (%) - Multirace
Geographical mobility - Moved from abroad (%) - Other Race
Place of birth for the foreign-born population - Ireland (%)
Place of birth for the foreign-born population - Denmark (%)
Place of birth for the foreign-born population - Norway (%)
Place of birth for the foreign-born population - Sweden (%)
Place of birth for the foreign-born population - United Kingdom (%)
Place of birth for the foreign-born population - England (%)
Place of birth for the foreign-born population - Scotland (%)
Place of birth for the foreign-born population - Other Northern Europe (%)
Place of birth for the foreign-born population - Austria (%)
Place of birth for the foreign-born population - Belgium (%)
Place of birth for the foreign-born population - France (%)
Place of birth for the foreign-born population - Germany (%)
Place of birth for the foreign-born population - Netherlands (%)
Place of birth for the foreign-born population - Switzerland (%)
Place of birth for the foreign-born population - Other Western Europe (%)
Place of birth for the foreign-born population - Greece (%)
Place of birth for the foreign-born population - Italy (%)
Place of birth for the foreign-born population - Portugal (%)
Place of birth for the foreign-born population - Spain (%)
Place of birth for the foreign-born population - Other Southern Europe (%)
Place of birth for the foreign-born population - Albania (%)
Place of birth for the foreign-born population - Belarus (%)
Place of birth for the foreign-born population - Bosnia and Herzegovina (%)
Place of birth for the foreign-born population - Bulgaria (%)
Place of birth for the foreign-born population - Croatia (%)
Place of birth for the foreign-born population - Czechoslovakia (%)
Place of birth for the foreign-born population - Hungary (%)
Place of birth for the foreign-born population - Latvia (%)
Place of birth for the foreign-born population - Lithuania (%)
Place of birth for the foreign-born population - North Macedonia (Macedonia) (%)
Place of birth for the foreign-born population - Moldova (%)
Place of birth for the foreign-born population - Poland (%)
Place of birth for the foreign-born population - Romania (%)
Place of birth for the foreign-born population - Russia (%)
Place of birth for the foreign-born population - Serbia (%)
Place of birth for the foreign-born population - Ukraine (%)
Place of birth for the foreign-born population - Other Eastern Europe (%)
Place of birth for the foreign-born population - China (%)
Place of birth for the foreign-born population - Hong Kong (%)
Place of birth for the foreign-born population - Taiwan (%)
Place of birth for the foreign-born population - Japan (%)
Place of birth for the foreign-born population - Korea (%)
Place of birth for the foreign-born population - Other Eastern Asia (%)
Place of birth for the foreign-born population - Afghanistan (%)
Place of birth for the foreign-born population - Bangladesh (%)
Place of birth for the foreign-born population - India (%)
Place of birth for the foreign-born population - Iran (%)
Place of birth for the foreign-born population - Kazakhstan (%)
Place of birth for the foreign-born population - Nepal (%)
Place of birth for the foreign-born population - Pakistan (%)
Place of birth for the foreign-born population - Sri Lanka (%)
Place of birth for the foreign-born population - Uzbekistan (%)
Place of birth for the foreign-born population - Other South Central Asia (%)
Place of birth for the foreign-born population - Burma (%)
Place of birth for the foreign-born population - Cambodia (%)
Place of birth for the foreign-born population - Indonesia (%)
Place of birth for the foreign-born population - Laos (%)
Place of birth for the foreign-born population - Malaysia (%)
Place of birth for the foreign-born population - Philippines (%)
Place of birth for the foreign-born population - Singapore (%)
Place of birth for the foreign-born population - Thailand (%)
Place of birth for the foreign-born population - Vietnam (%)
Place of birth for the foreign-born population - Other South Eastern Asia (%)
Place of birth for the foreign-born population - Armenia (%)
Place of birth for the foreign-born population - Iraq (%)
Place of birth for the foreign-born population - Israel (%)
Place of birth for the foreign-born population - Jordan (%)
Place of birth for the foreign-born population - Kuwait (%)
Place of birth for the foreign-born population - Lebanon (%)
Place of birth for the foreign-born population - Saudi Arabia (%)
Place of birth for the foreign-born population - Syria (%)
Place of birth for the foreign-born population - Turkey (%)
Place of birth for the foreign-born population - Yemen (%)
Place of birth for the foreign-born population - Other Western Asia (%)
Place of birth for the foreign-born population - Eritrea (%)
Place of birth for the foreign-born population - Ethiopia (%)
Place of birth for the foreign-born population - Kenya (%)
Place of birth for the foreign-born population - Somalia (%)
Place of birth for the foreign-born population - Uganda (%)
Place of birth for the foreign-born population - Zimbabwe (%)
Place of birth for the foreign-born population - Other Eastern Africa (%)
Place of birth for the foreign-born population - Cameroon (%)
Place of birth for the foreign-born population - Congo (%)
Place of birth for the foreign-born population - Democratic Republic of Congo (Zaire) (%)
Place of birth for the foreign-born population - Other Middle Africa (%)
Place of birth for the foreign-born population - Egypt (%)
Place of birth for the foreign-born population - Morocco (%)
Place of birth for the foreign-born population - Sudan (%)
Place of birth for the foreign-born population - Other Northern Africa (%)
Place of birth for the foreign-born population - South Africa (%)
Place of birth for the foreign-born population - Other Southern Africa (%)
Place of birth for the foreign-born population - Cabo Verde (%)
Place of birth for the foreign-born population - Ghana (%)
Place of birth for the foreign-born population - Liberia (%)
Place of birth for the foreign-born population - Nigeria (%)
Place of birth for the foreign-born population - Senegal (%)
Place of birth for the foreign-born population - Sierra Leone (%)
Place of birth for the foreign-born population - Other Western Africa (%)
Place of birth for the foreign-born population - Australia (%)
Place of birth for the foreign-born population - New Zealand (%)
Place of birth for the foreign-born population - Fiji (%)
Place of birth for the foreign-born population - Micronesia (%)
Place of birth for the foreign-born population - Bahamas (%)
Place of birth for the foreign-born population - Barbados (%)
Place of birth for the foreign-born population - Cuba (%)
Place of birth for the foreign-born population - Dominica (%)
Place of birth for the foreign-born population - Dominican Republic (%)
Place of birth for the foreign-born population - Grenada (%)
Place of birth for the foreign-born population - Haiti (%)
Place of birth for the foreign-born population - Jamaica (%)
Place of birth for the foreign-born population - St. Vincent and the Grenadines (%)
Place of birth for the foreign-born population - Trinidad and Tobago (%)
Place of birth for the foreign-born population - West Indies (%)
Place of birth for the foreign-born population - Other Caribbean (%)
Place of birth for the foreign-born population - Belize (%)
Place of birth for the foreign-born population - Costa Rica (%)
Place of birth for the foreign-born population - El Salvador (%)
Place of birth for the foreign-born population - Guatemala (%)
Place of birth for the foreign-born population - Honduras (%)
Place of birth for the foreign-born population - Mexico (%)
Place of birth for the foreign-born population - Nicaragua (%)
Place of birth for the foreign-born population - Panama (%)
Place of birth for the foreign-born population - Other Central America (%)
Place of birth for the foreign-born population - Argentina (%)
Place of birth for the foreign-born population - Bolivia (%)
Place of birth for the foreign-born population - Brazil (%)
Place of birth for the foreign-born population - Chile (%)
Place of birth for the foreign-born population - Colombia (%)
Place of birth for the foreign-born population - Ecuador (%)
Place of birth for the foreign-born population - Guyana (%)
Place of birth for the foreign-born population - Peru (%)
Place of birth for the foreign-born population - Uruguay (%)
Place of birth for the foreign-born population - Venezuela (%)
Place of birth for the foreign-born population - Other South America (%)
Place of birth for the foreign-born population - Canada (%)
Place of birth for the foreign-born population - Other Northern America (%)
Place of birth for the foreign-born population - Other (%)
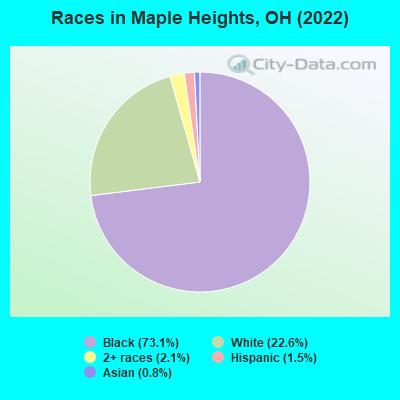
According to 2022 data, the most numerous races in Maple Heights, OH are White alone (5,228 residents), Black alone (16,868 residents), and Two or more races (488 residents). 96.8% of Maple Heights residents speak English at home. 1.9% of Maple Heights, OH residents are foreign-born , which is 115.3% less than the foreign-born rate of 4.0% across the entire state of Ohio.
Race distribution in Maple Heights
2000 2022
9,538,111 84.0% White alone 1,290,662 11.4% Black alone 217,123 1.9% Hispanic 137,770 1.2% Two or more races 131,670 1.2% Asian alone 21,985 0.2% American Indian alone 13,483 0.1% Other race alone 2,336 0.02% Native Hawaiian and Other
8,948,793 76.1% White alone 1,401,403 11.9% Black alone 529,291 4.5% Two or more races 517,232 4.4% Hispanic 293,387 2.5% Asian alone 52,805 0.4% Other race alone 9,785 0.08% American Indian alone 3,362 0.03% Native Hawaiian and Other
Income and house value in Maple Heights Median household income in 2022 $58,643 White non-Hispanic householders$49,146 Black householders$82,405 Some other race householders$47,079 Two or more races householders$91,523 Hispanic or Latino race householdersMedian 2022 house value $94,247 White Non-Hispanic householders$94,916 Black or African American householders$90,348 American Indian or Alaska Native householders $127,669 Asian householders$99,483 Some other race householders$91,908 Two or more races householders$98,369 Hispanic or Latino householders
Median age by race in Maple Heights
56.3 Median age for White residents58.1 56.2 33.3 Median age for Black or African American residents27.2 38.1 -545,601,290.8 Median age for American Indian / Alaska Native residents-734,374,999.3 -499,999,999.5 61.8 Median age for Asian residents-694,677,870.5 -679,702,047.7 -706,093,189.3 Median age for Native Hawaiian / Pacific Islander residents-750,242,953.6 -805,394,989.6 39.8 Median age for Other race residents35.7 37.3 33.7 Median age for Two or more races residents35.1 33.5 55.9 Median age for White alone residents57.7 55.8 34.3 Median age for Hispanic or Latino residents33.7 31.1
Owner/renter occupied households by race in Maple Heights
House owners and renters - White residents 2,365 84.1% Owner occupied447 15.9% Renter occupiedHouse owners and renters - Black or African American residents 4,186 58.8% Owner occupied2,927 41.2% Renter occupiedHouse owners and renters - Asian residents 35 100.0% Renter occupiedHouse owners and renters - Other race residents 34 48.6% Owner occupied36 51.4% Renter occupiedHouse owners and renters - Two or more races residents 119 37.7% Owner occupied196 62.3% Renter occupiedHouse owners and renters - White alone residents 2,332 83.6% Owner occupied456 16.4% Renter occupiedHouse owners and renters - Hispanic or Latino residents 121 84.3% Owner occupied23 15.7% Renter occupied
Language usage in Maple Heights
English speakers - Total 96.8% of residents of Maple Heights speak English at home.
0.9% of residents speak Spanish at home 135 72.6% Speak English very well51 27.4% Speak English less than very well2.2% of residents speak other language at home 265 57.2% Speak English very well198 42.8% Speak English less than very well
English speakers - Born in the United States 96.8% of residents of Maple Heights speak English at home.
0.3% of residents speak Spanish at home 8 100.0% Speak English very well3.1% of residents speak other language at home 1 1.1% Speak English very well93 98.9% Speak English less than very well
English speakers - Native, born elsewhere 68.9% of residents of Maple Heights speak English at home.
33.0% of residents speak Spanish at home 14 40.0% Speak English very well21 60.0% Speak English less than very well
English speakers - Foreign-born 23.5% of residents of Maple Heights speak English at home.
17.2% of residents speak Spanish at home 36 50.7% Speak English very well35 49.3% Speak English less than very well57.8% of residents speak other language at home 137 57.6% Speak English very well101 42.4% Speak English less than very well
White (Caucasian) - Speak only English Native:
99.2% (5,070)Foreign-born:
88.4% (58)
White (Caucasian) - Speak another language Native:
1.4% (72)Foreign-born:
13.4% (9)
Black or African American - Speak only English Native:
99.5% (15,025)Foreign-born:
23.3% (34)
Black or African American - Speak another language Native:
0.9% (142)Foreign-born:
74.6% (108)
Other race - Speak another language Native:
19.4% (24)Foreign-born:
100.0% (55)
Two or more races - Speak another language Native:
4.4% (29)Foreign-born:
100.0% (14)
White alone - Speak only English Native:
98.4% (5,041)Foreign-born:
86.0% (59)
White alone - Speak another language Native:
1.5% (75)Foreign-born:
13.5% (9)
Hispanic or Latino - Speak another language Native:
19.9% (56)Foreign-born:
100.0% (76)
Foreign-born residents in Maple Heights 429 residents are foreign born
Marital status for residents in Maple Heights Marital status - White (Caucasian) population 15 years and over
Males 34.7% Never married41.6% Now married0.4% Separated7.0% Widowed16.3% DivorcedFemales 30.8% Never married32.3% Now married0.2% Separated10.0% Widowed26.8% DivorcedWomen who gave birth in the past 12 months Now married:
0.0% (0)Unmarried:
100.0% (8)
Women who did not give birth in the past 12 months Now married:
25.0% (255)Unmarried:
75.0% (767)
Marital status - Black or African American population 15 years and over
Males 48.5% Never married37.7% Now married1.1% Separated5.3% Widowed7.4% DivorcedFemales 47.8% Never married21.7% Now married1.8% Separated5.9% Widowed22.8% DivorcedWomen who gave birth in the past 12 months Now married:
42.4% (117)Unmarried:
57.6% (158)
Women who did not give birth in the past 12 months Now married:
17.0% (666)Unmarried:
83.0% (3,256)
Marital status - Asian population 15 years and over
Males 0.0% Never married100.0% Now married0.0% Separated0.0% Widowed0.0% DivorcedFemales 0.0% Never married100.0% Now married0.0% Separated0.0% Widowed0.0% DivorcedMarital status - Other race population 15 years and over
Males 23.1% Never married57.7% Now married0.0% Separated0.0% Widowed19.2% DivorcedFemales 0.0% Never married100.0% Now married0.0% Separated0.0% Widowed0.0% DivorcedWomen who did not give birth in the past 12 months Now married:
100.0% (37)Unmarried:
0.0% (0)
Marital status - Two or more races population 15 years and over
Males 75.9% Never married24.1% Now married0.0% Separated0.0% Widowed0.0% DivorcedFemales 48.1% Never married41.2% Now married8.4% Separated2.3% Widowed0.0% DivorcedWomen who did not give birth in the past 12 months Now married:
46.4% (184)Unmarried:
53.6% (212)
Marital status - White alone, not Hispanic / Latino population 15 years and over
Males 34.4% Never married41.8% Now married0.4% Separated7.1% Widowed16.4% DivorcedFemales 31.3% Never married31.1% Now married0.2% Separated10.2% Widowed27.2% DivorcedWomen who gave birth in the past 12 months Now married:
0.0% (0)Unmarried:
100.0% (8)
Women who did not give birth in the past 12 months Now married:
22.4% (228)Unmarried:
77.6% (789)
Marital status - Hispanic or Latino population 15 years and over
Males 52.5% Never married47.5% Now married0.0% Separated0.0% Widowed0.0% DivorcedFemales 9.8% Never married82.8% Now married0.0% Separated7.4% Widowed0.0% DivorcedWomen who did not give birth in the past 12 months Now married:
85.5% (74)Unmarried:
14.5% (13)
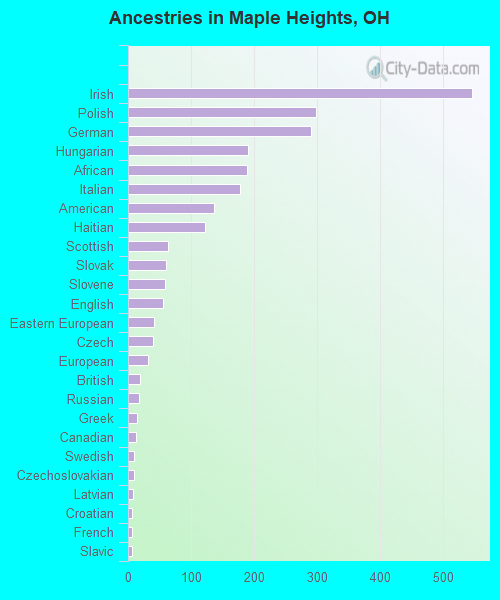
Ancestries in Maple Heights
545 3.8% Irish298 2.1% Polish290 2.0% German190 1.3% Hungarian188 1.3% African178 1.2% Italian137 1.0% American122 0.9% Haitian63 0.4% Scottish60 0.4% Slovak58 0.4% Slovene55 0.4% English42 0.3% Eastern European39 0.3% Czech32 0.2% European19 0.1% British18 0.1% Russian14 0.10% Greek12 0.08% Canadian10 0.07% Swedish9 0.06% Czechoslovakian8 0.06% Latvian7 0.05% Croatian7 0.05% French7 0.05% Slavic4 0.03% Pennsylvania German1 0.01% Arab
Children Nativity (place of birth) in Maple Heights
Children under 6 years - Living with two parents Both parents native 556 100.0% NativeBoth parents foreign-born 9 100.0% NativeOne native, one foreign-born parent 21 100.0% NativeChildren under 6 years - Living with one parent Native parent 1,073 100.0% Native
Children 6 to 17 years - Living with two parents Both parents native 1,224 100.0% NativeBoth parents foreign-born 51 100.0% NativeOne native, one foreign-born parent 29 100.0% NativeChildren 6 to 17 years - Living with one parent Native parent 2,210 100.0% Native
Grandparents responsible for own grandchildren in Maple Heights
Grandparents (30 to 59 years) White / Caucasian 7 100.0% Responsible for grandchildrenBlack or African American 113 38.5% Responsible for grandchildren181 61.5% Not responsible for grandchildrenWhite alone, not Hispanic / Latino 7 100.0% Responsible for grandchildrenGrandparents (60 years and over) White / Caucasian 49 100.0% Responsible for grandchildrenBlack or African American 60 59.7% Responsible for grandchildren40 40.3% Not responsible for grandchildrenWhite alone, not Hispanic / Latino 50 100.0% Responsible for grandchildren