Races in Maple Valley, Washington (WA) Detailed Stats
Data:
Races - White alone (%)
Races - White alone (% change since 2000)
Races - Black alone (%)
Races - Black alone (% change since 2000)
Races - American Indian alone (%)
Races - American Indian alone (% change since 2000)
Races - Asian alone (%)
Races - Asian alone (% change since 2000)
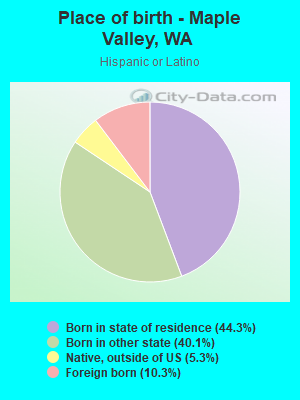
Races - Hispanic (%)
Races - Hispanic (% change since 2000)
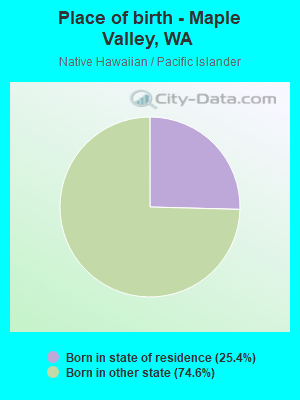
Races - Native Hawaiian and Other Pacific Islander alone (%)
Races - Native Hawaiian and Other Pacific Islander alone (% change since 2000)
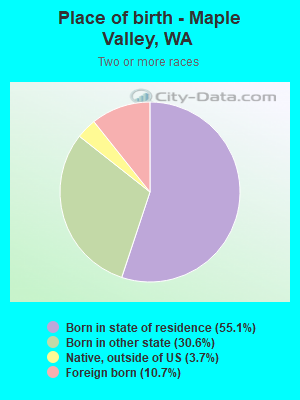
Races - Two or more races(%)
Races - Two or more races(% change since 2000)
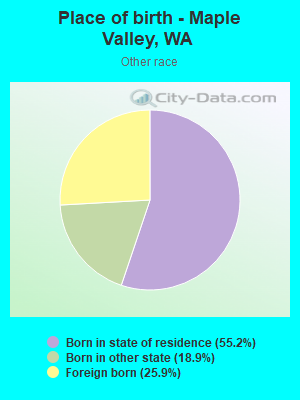
Races - Other race alone (%)
Races - Other race alone (% change since 2000)
Racial diversity
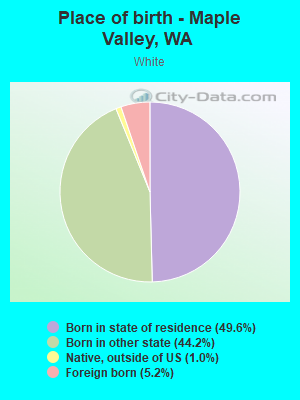
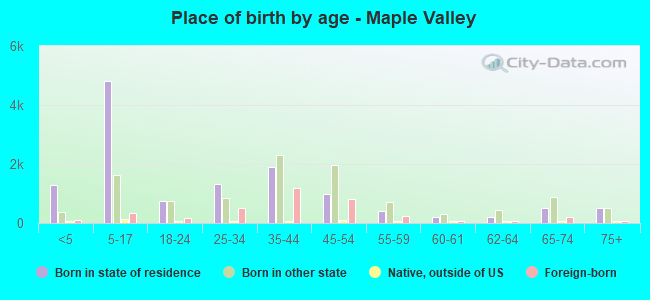
Place of birth - Born in state of residence (%)
Place of birth - Born in state of residence (%) - White
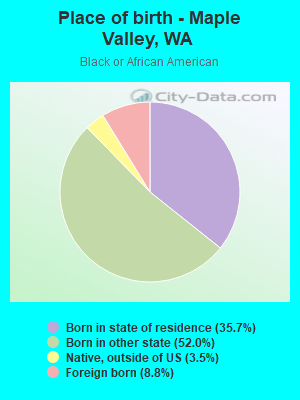
Place of birth - Born in state of residence (%) - Black or African American
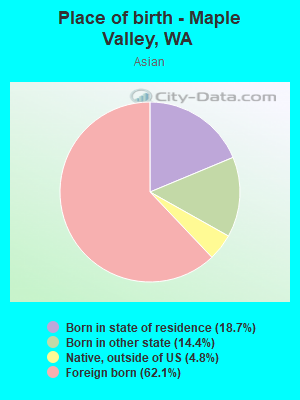
Place of birth - Born in state of residence (%) - Asian
Place of birth - Born in state of residence (%) - Hispanic or Latino
Place of birth - Born in state of residence (%) - American Indian and Alaska Native
Place of birth - Born in state of residence (%) - Multirace
Place of birth - Born in state of residence (%) - Other Race
Place of birth - Born in other state (%)
Place of birth - Born in other state (%) - White
Place of birth - Born in other state (%) - Black or African American
Place of birth - Born in other state (%) - Asian
Place of birth - Born in other state (%) - Hispanic or Latino
Place of birth - Born in other state (%) - American Indian and Alaska Native
Place of birth - Born in other state (%) - Multirace
Place of birth - Born in other state (%) - Other Race
Place of birth - Native, outside of US (%)
Place of birth - Native, outside of US (%) - White
Place of birth - Native, outside of US (%) - Black or African American
Place of birth - Native, outside of US (%) - Asian
Place of birth - Native, outside of US (%) - Hispanic or Latino
Place of birth - Native, outside of US (%) - American Indian and Alaska Native
Place of birth - Native, outside of US (%) - Multirace
Place of birth - Native, outside of US (%) - Other Race
Place of birth - Foreign born (%)
Place of birth - Foreign born (%) - White
Place of birth - Foreign born (%) - Black or African American
Place of birth - Foreign born (%) - Asian
Place of birth - Foreign born (%) - Hispanic or Latino
Place of birth - Foreign born (%) - American Indian and Alaska Native
Place of birth - Foreign born (%) - Multirace
Place of birth - Foreign born (%) - Other Race
Residents speaking English at home (%)
Residents speaking English at home - Born in the United States (%)
Residents speaking English at home - Native, born elsewhere (%)
Residents speaking English at home - Foreign born (%)
Residents speaking Spanish at home (%)
Residents speaking Spanish at home - Born in the United States (%)
Residents speaking Spanish at home - Native, born elsewhere (%)
Residents speaking Spanish at home - Foreign born (%)
Residents speaking other language at home (%)
Residents speaking other language at home - Born in the United States (%)
Residents speaking other language at home - Native, born elsewhere (%)
Residents speaking other language at home - Foreign born (%)
Marital status - Never married (%)
Marital status - Now married (%)
Marital status - Separated (%)
Marital status - Widowed (%)
Marital status - Divorced (%)
Ancestries Reported - Arab (%)
Ancestries Reported - Czech (%)
Ancestries Reported - Danish (%)
Ancestries Reported - Dutch (%)
Ancestries Reported - English (%)
Ancestries Reported - French (%)
Ancestries Reported - French Canadian (%)
Ancestries Reported - German (%)
Ancestries Reported - Greek (%)
Ancestries Reported - Hungarian (%)
Ancestries Reported - Irish (%)
Ancestries Reported - Italian (%)
Ancestries Reported - Lithuanian (%)
Ancestries Reported - Norwegian (%)
Ancestries Reported - Polish (%)
Ancestries Reported - Portuguese (%)
Ancestries Reported - Russian (%)
Ancestries Reported - Scotch-Irish (%)
Ancestries Reported - Scottish (%)
Ancestries Reported - Slovak (%)
Ancestries Reported - Subsaharan African (%)
Ancestries Reported - Swedish (%)
Ancestries Reported - Swiss (%)
Ancestries Reported - Ukrainian (%)
Ancestries Reported - United States (%)
Ancestries Reported - Welsh (%)
Ancestries Reported - West Indian (%)
Ancestries Reported - Other (%)
Geographical mobility - Same house 1 year ago (%)
Geographical mobility - Same house 1 year ago (%) - White
Geographical mobility - Same house 1 year ago (%) - Black or African American
Geographical mobility - Same house 1 year ago (%) - Asian
Geographical mobility - Same house 1 year ago (%) - Hispanic or Latino
Geographical mobility - Same house 1 year ago (%) - American Indian and Alaska Native
Geographical mobility - Same house 1 year ago (%) - Multirace
Geographical mobility - Same house 1 year ago (%) - Other Race
Geographical mobility - Moved within same county (%)
Geographical mobility - Moved within same county (%) - White
Geographical mobility - Moved within same county (%) - Black or African American
Geographical mobility - Moved within same county (%) - Asian
Geographical mobility - Moved within same county (%) - Hispanic or Latino
Geographical mobility - Moved within same county (%) - American Indian and Alaska Native
Geographical mobility - Moved within same county (%) - Multirace
Geographical mobility - Moved within same county (%) - Other Race
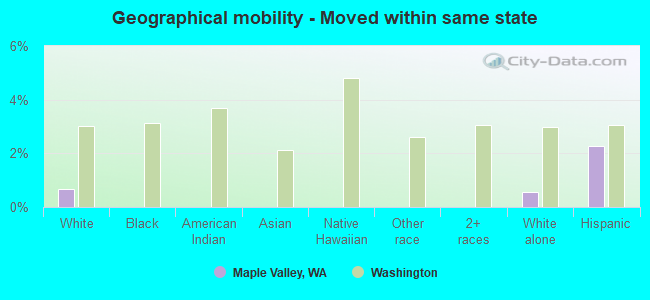
Geographical mobility - Moved from different county within same state (%)
Geographical mobility - Moved from different county within same state (%) - White
Geographical mobility - Moved from different county within same state (%) - Black or African American
Geographical mobility - Moved from different county within same state (%) - Asian
Geographical mobility - Moved from different county within same state (%) - Hispanic or Latino
Geographical mobility - Moved from different county within same state (%) - American Indian and Alaska Native
Geographical mobility - Moved from different county within same state (%) - Multirace
Geographical mobility - Moved from different county within same state (%) - Other Race
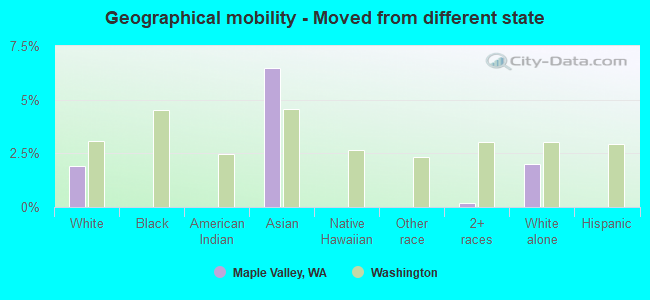
Geographical mobility - Moved from different state (%)
Geographical mobility - Moved from different state (%) - White
Geographical mobility - Moved from different state (%) - Black or African American
Geographical mobility - Moved from different state (%) - Asian
Geographical mobility - Moved from different state (%) - Hispanic or Latino
Geographical mobility - Moved from different state (%) - American Indian and Alaska Native
Geographical mobility - Moved from different state (%) - Multirace
Geographical mobility - Moved from different state (%) - Other Race
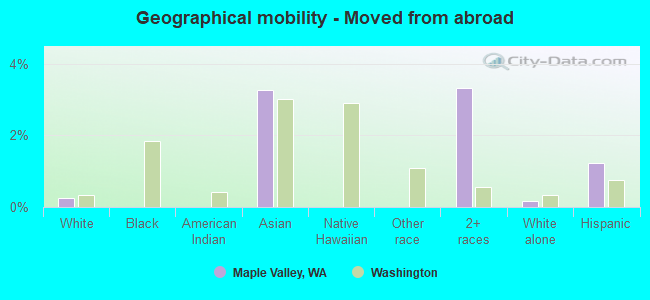
Geographical mobility - Moved from abroad (%)
Geographical mobility - Moved from abroad (%) - White
Geographical mobility - Moved from abroad (%) - Black or African American
Geographical mobility - Moved from abroad (%) - Asian
Geographical mobility - Moved from abroad (%) - Hispanic or Latino
Geographical mobility - Moved from abroad (%) - American Indian and Alaska Native
Geographical mobility - Moved from abroad (%) - Multirace
Geographical mobility - Moved from abroad (%) - Other Race
Place of birth for the foreign-born population - Ireland (%)
Place of birth for the foreign-born population - Denmark (%)
Place of birth for the foreign-born population - Norway (%)
Place of birth for the foreign-born population - Sweden (%)
Place of birth for the foreign-born population - United Kingdom (%)
Place of birth for the foreign-born population - England (%)
Place of birth for the foreign-born population - Scotland (%)
Place of birth for the foreign-born population - Other Northern Europe (%)
Place of birth for the foreign-born population - Austria (%)
Place of birth for the foreign-born population - Belgium (%)
Place of birth for the foreign-born population - France (%)
Place of birth for the foreign-born population - Germany (%)
Place of birth for the foreign-born population - Netherlands (%)
Place of birth for the foreign-born population - Switzerland (%)
Place of birth for the foreign-born population - Other Western Europe (%)
Place of birth for the foreign-born population - Greece (%)
Place of birth for the foreign-born population - Italy (%)
Place of birth for the foreign-born population - Portugal (%)
Place of birth for the foreign-born population - Spain (%)
Place of birth for the foreign-born population - Other Southern Europe (%)
Place of birth for the foreign-born population - Albania (%)
Place of birth for the foreign-born population - Belarus (%)
Place of birth for the foreign-born population - Bosnia and Herzegovina (%)
Place of birth for the foreign-born population - Bulgaria (%)
Place of birth for the foreign-born population - Croatia (%)
Place of birth for the foreign-born population - Czechoslovakia (%)
Place of birth for the foreign-born population - Hungary (%)
Place of birth for the foreign-born population - Latvia (%)
Place of birth for the foreign-born population - Lithuania (%)
Place of birth for the foreign-born population - North Macedonia (Macedonia) (%)
Place of birth for the foreign-born population - Moldova (%)
Place of birth for the foreign-born population - Poland (%)
Place of birth for the foreign-born population - Romania (%)
Place of birth for the foreign-born population - Russia (%)
Place of birth for the foreign-born population - Serbia (%)
Place of birth for the foreign-born population - Ukraine (%)
Place of birth for the foreign-born population - Other Eastern Europe (%)
Place of birth for the foreign-born population - China (%)
Place of birth for the foreign-born population - Hong Kong (%)
Place of birth for the foreign-born population - Taiwan (%)
Place of birth for the foreign-born population - Japan (%)
Place of birth for the foreign-born population - Korea (%)
Place of birth for the foreign-born population - Other Eastern Asia (%)
Place of birth for the foreign-born population - Afghanistan (%)
Place of birth for the foreign-born population - Bangladesh (%)
Place of birth for the foreign-born population - India (%)
Place of birth for the foreign-born population - Iran (%)
Place of birth for the foreign-born population - Kazakhstan (%)
Place of birth for the foreign-born population - Nepal (%)
Place of birth for the foreign-born population - Pakistan (%)
Place of birth for the foreign-born population - Sri Lanka (%)
Place of birth for the foreign-born population - Uzbekistan (%)
Place of birth for the foreign-born population - Other South Central Asia (%)
Place of birth for the foreign-born population - Burma (%)
Place of birth for the foreign-born population - Cambodia (%)
Place of birth for the foreign-born population - Indonesia (%)
Place of birth for the foreign-born population - Laos (%)
Place of birth for the foreign-born population - Malaysia (%)
Place of birth for the foreign-born population - Philippines (%)
Place of birth for the foreign-born population - Singapore (%)
Place of birth for the foreign-born population - Thailand (%)
Place of birth for the foreign-born population - Vietnam (%)
Place of birth for the foreign-born population - Other South Eastern Asia (%)
Place of birth for the foreign-born population - Armenia (%)
Place of birth for the foreign-born population - Iraq (%)
Place of birth for the foreign-born population - Israel (%)
Place of birth for the foreign-born population - Jordan (%)
Place of birth for the foreign-born population - Kuwait (%)
Place of birth for the foreign-born population - Lebanon (%)
Place of birth for the foreign-born population - Saudi Arabia (%)
Place of birth for the foreign-born population - Syria (%)
Place of birth for the foreign-born population - Turkey (%)
Place of birth for the foreign-born population - Yemen (%)
Place of birth for the foreign-born population - Other Western Asia (%)
Place of birth for the foreign-born population - Eritrea (%)
Place of birth for the foreign-born population - Ethiopia (%)
Place of birth for the foreign-born population - Kenya (%)
Place of birth for the foreign-born population - Somalia (%)
Place of birth for the foreign-born population - Uganda (%)
Place of birth for the foreign-born population - Zimbabwe (%)
Place of birth for the foreign-born population - Other Eastern Africa (%)
Place of birth for the foreign-born population - Cameroon (%)
Place of birth for the foreign-born population - Congo (%)
Place of birth for the foreign-born population - Democratic Republic of Congo (Zaire) (%)
Place of birth for the foreign-born population - Other Middle Africa (%)
Place of birth for the foreign-born population - Egypt (%)
Place of birth for the foreign-born population - Morocco (%)
Place of birth for the foreign-born population - Sudan (%)
Place of birth for the foreign-born population - Other Northern Africa (%)
Place of birth for the foreign-born population - South Africa (%)
Place of birth for the foreign-born population - Other Southern Africa (%)
Place of birth for the foreign-born population - Cabo Verde (%)
Place of birth for the foreign-born population - Ghana (%)
Place of birth for the foreign-born population - Liberia (%)
Place of birth for the foreign-born population - Nigeria (%)
Place of birth for the foreign-born population - Senegal (%)
Place of birth for the foreign-born population - Sierra Leone (%)
Place of birth for the foreign-born population - Other Western Africa (%)
Place of birth for the foreign-born population - Australia (%)
Place of birth for the foreign-born population - New Zealand (%)
Place of birth for the foreign-born population - Fiji (%)
Place of birth for the foreign-born population - Micronesia (%)
Place of birth for the foreign-born population - Bahamas (%)
Place of birth for the foreign-born population - Barbados (%)
Place of birth for the foreign-born population - Cuba (%)
Place of birth for the foreign-born population - Dominica (%)
Place of birth for the foreign-born population - Dominican Republic (%)
Place of birth for the foreign-born population - Grenada (%)
Place of birth for the foreign-born population - Haiti (%)
Place of birth for the foreign-born population - Jamaica (%)
Place of birth for the foreign-born population - St. Vincent and the Grenadines (%)
Place of birth for the foreign-born population - Trinidad and Tobago (%)
Place of birth for the foreign-born population - West Indies (%)
Place of birth for the foreign-born population - Other Caribbean (%)
Place of birth for the foreign-born population - Belize (%)
Place of birth for the foreign-born population - Costa Rica (%)
Place of birth for the foreign-born population - El Salvador (%)
Place of birth for the foreign-born population - Guatemala (%)
Place of birth for the foreign-born population - Honduras (%)
Place of birth for the foreign-born population - Mexico (%)
Place of birth for the foreign-born population - Nicaragua (%)
Place of birth for the foreign-born population - Panama (%)
Place of birth for the foreign-born population - Other Central America (%)
Place of birth for the foreign-born population - Argentina (%)
Place of birth for the foreign-born population - Bolivia (%)
Place of birth for the foreign-born population - Brazil (%)
Place of birth for the foreign-born population - Chile (%)
Place of birth for the foreign-born population - Colombia (%)
Place of birth for the foreign-born population - Ecuador (%)
Place of birth for the foreign-born population - Guyana (%)
Place of birth for the foreign-born population - Peru (%)
Place of birth for the foreign-born population - Uruguay (%)
Place of birth for the foreign-born population - Venezuela (%)
Place of birth for the foreign-born population - Other South America (%)
Place of birth for the foreign-born population - Canada (%)
Place of birth for the foreign-born population - Other Northern America (%)
Place of birth for the foreign-born population - Other (%)
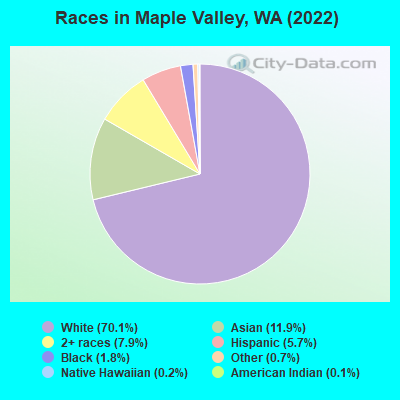
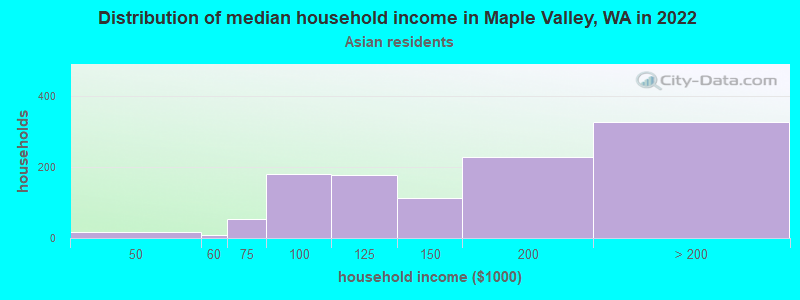
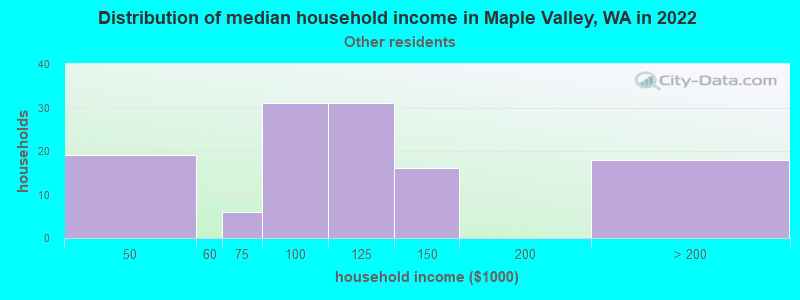
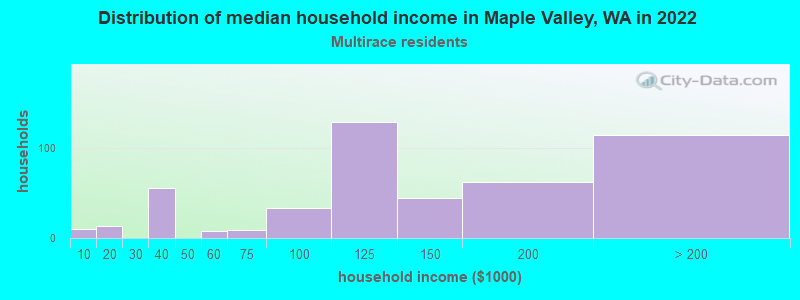
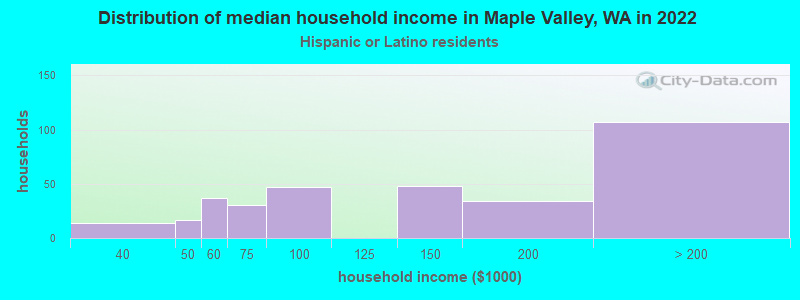
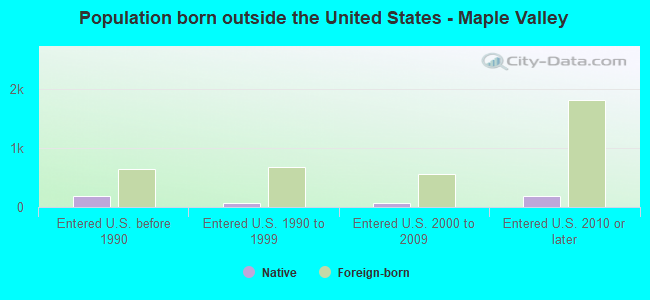
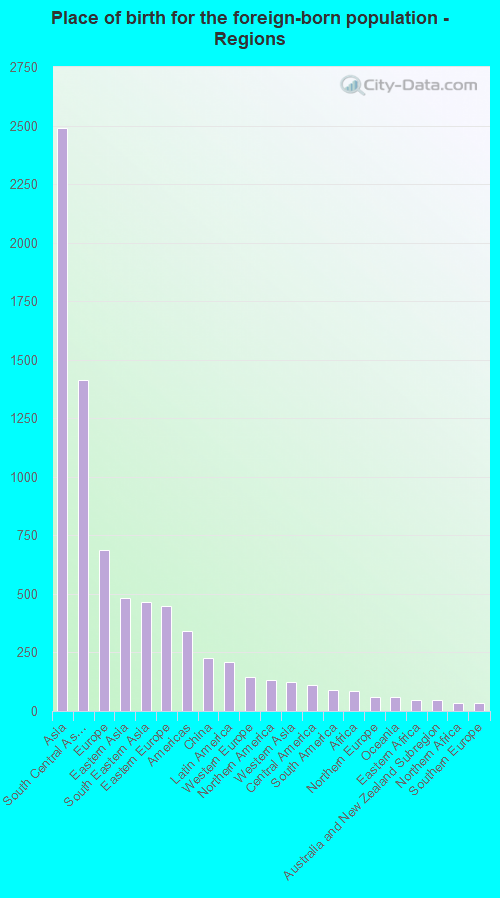
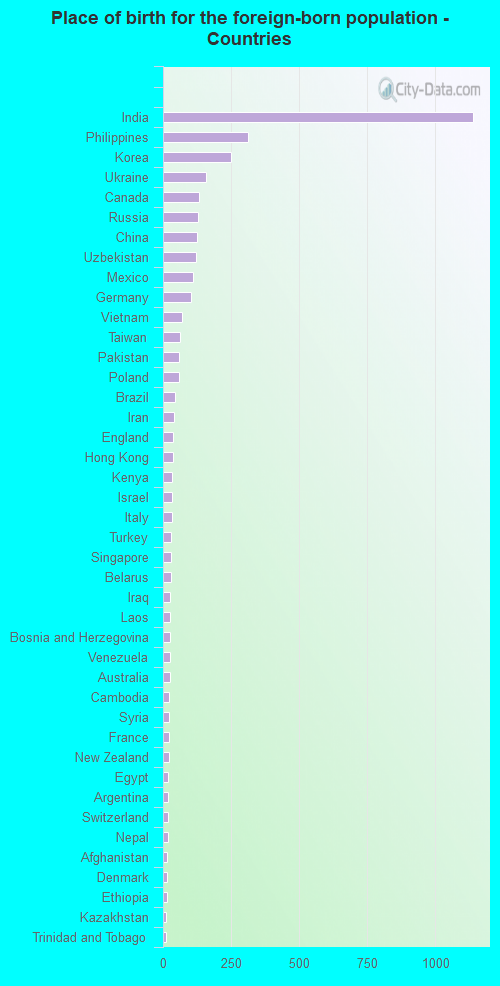
According to 2022 data, the most numerous races in Maple Valley, WA are White alone (19,653 residents), Hispanic (1,596 residents), and Asian alone (3,349 residents). 83.7% of Maple Valley residents speak English at home. 13.1% of Maple Valley, WA residents are foreign-born (8.5% born in Asia, 2.4% born in Europe), which is 14.8% less than the foreign-born rate of 15.0% across the entire state of Washington.
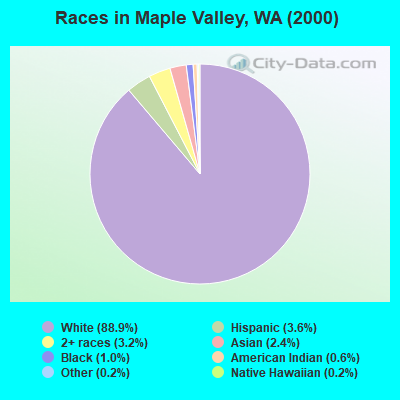
Race distribution in Maple Valley
2000 2022
4,652,490 78.9% White alone 441,509 7.5% Hispanic 319,401 5.4% Asian alone 184,631 3.1% Black alone 175,926 3.0% Two or more races 85,396 1.4% American Indian alone 22,779 0.4% Native Hawaiian and Other 11,989 0.2% Other race alone
4,941,456 63.5% White alone 1,093,313 14.0% Hispanic 755,832 9.7% Asian alone 523,448 6.7% Two or more races 299,537 3.8% Black alone 69,024 0.9% American Indian alone 52,231 0.7% Native Hawaiian and Other 50,945 0.7% Other race alone
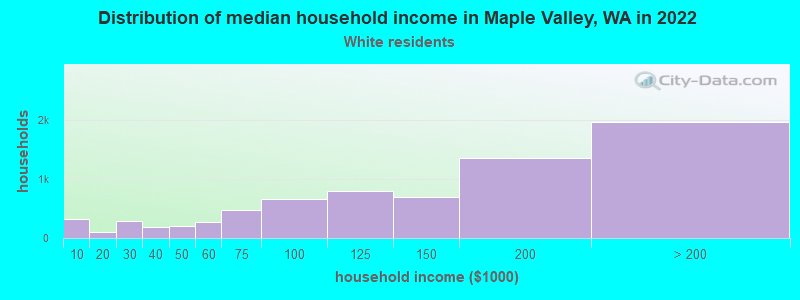
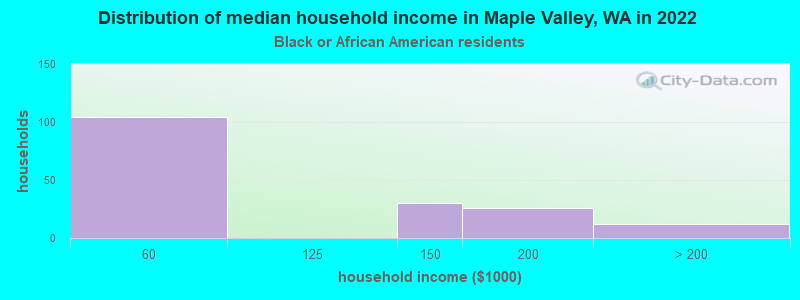
Income and house value in Maple Valley Median household income in 2022 $137,965 White non-Hispanic householders$150,052 Asian householders$97,262 Some other race householders$115,491 Two or more races householders$137,630 Hispanic or Latino race householdersMedian 2022 house value $717,257 White Non-Hispanic householders$696,845 Black or African American householders$636,686 American Indian or Alaska Native householders $697,204 Asian householders$636,686 Some other race householders$615,559 Two or more races householders$657,455 Hispanic or Latino householders
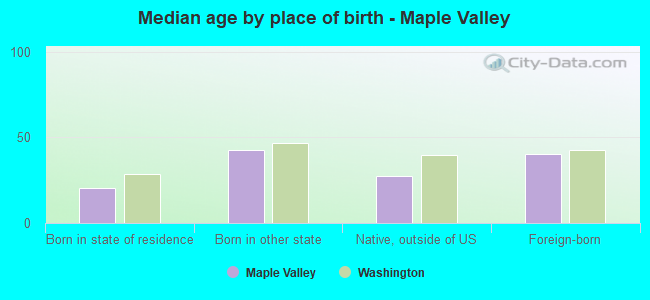
Median age by race in Maple Valley
39.6 Median age for White residents38.0 40.3 19.8 Median age for Black or African American residents22.2 19.8 42.4 Median age for American Indian / Alaska Native residents40.3 -631,249,999.4 36.1 Median age for Asian residents37.4 35.2 22.3 Median age for Native Hawaiian / Pacific Islander residents-664,509,168.7 22.5 37.4 Median age for Other race residents39.0 37.6 15.7 Median age for Two or more races residents15.4 15.7 39.4 Median age for White alone residents38.4 40.3 22.6 Median age for Hispanic or Latino residents23.1 21.8
Owner/renter occupied households by race in Maple Valley
House owners and renters - White residents 6,174 84.1% Owner occupied1,171 15.9% Renter occupiedHouse owners and renters - Black or African American residents 67 41.7% Owner occupied94 58.3% Renter occupiedHouse owners and renters - American Indian / Alaska Native residents 7 100.0% Owner occupiedHouse owners and renters - Asian residents 1,049 93.8% Owner occupied70 6.2% Renter occupiedHouse owners and renters - Native Hawaiian / Pacific Islander residents 18 100.0% Owner occupiedHouse owners and renters - Other race residents 125 100.0% Owner occupiedHouse owners and renters - Two or more races residents 438 90.4% Owner occupied46 9.6% Renter occupiedHouse owners and renters - White alone residents 6,122 83.9% Owner occupied1,174 16.1% Renter occupiedHouse owners and renters - Hispanic or Latino residents 300 86.6% Owner occupied46 13.4% Renter occupied
Language usage in Maple Valley
English speakers - Total 83.7% of residents of Maple Valley speak English at home.
1.2% of residents speak Spanish at home 295 90.5% Speak English very well31 9.5% Speak English less than very well13.7% of residents speak other language at home 2,855 79.4% Speak English very well741 20.6% Speak English less than very well
English speakers - Born in the United States 95.9% of residents of Maple Valley speak English at home.
0.8% of residents speak Spanish at home 82 98.8% Speak English very well1 1.2% Speak English less than very well2.8% of residents speak other language at home 273 94.1% Speak English very well17 5.9% Speak English less than very well
English speakers - Native, born elsewhere 65.3% of residents of Maple Valley speak English at home.
33.0% of residents speak other language at home 118 83.1% Speak English very well24 16.9% Speak English less than very well
English speakers - Foreign-born 18.1% of residents of Maple Valley speak English at home.
3.7% of residents speak Spanish at home 106 79.1% Speak English very well28 20.9% Speak English less than very well79.2% of residents speak other language at home 2,242 79.1% Speak English very well592 20.9% Speak English less than very well
White (Caucasian) - Speak only English Native:
98.8% (17,853)Foreign-born:
20.7% (215)
White (Caucasian) - Speak another language Native:
1.3% (227)Foreign-born:
79.7% (827)
Black or African American - Speak only English Native:
100.0% (443)Foreign-born:
100.0% (43)
Asian - Speak only English Native:
55.2% (586)Foreign-born:
13.6% (276)
Asian - Speak another language Native:
44.9% (477)Foreign-born:
86.4% (1,752)
Other race - Speak only English Native:
84.7% (284)Foreign-born:
23.4% (26)
Other race - Speak another language Native:
17.4% (58)Foreign-born:
71.4% (79)
Two or more races - Speak only English Native:
88.1% (1,743)Foreign-born:
32.2% (96)
Two or more races - Speak another language Native:
11.0% (218)Foreign-born:
67.3% (200)
White alone - Speak only English Native:
98.6% (17,354)Foreign-born:
18.2% (197)
White alone - Speak another language Native:
1.1% (186)Foreign-born:
84.1% (909)
Hispanic or Latino - Speak only English Native:
84.7% (1,143)Foreign-born:
20.4% (34)
Hispanic or Latino - Speak another language Native:
13.3% (180)Foreign-born:
77.7% (128)
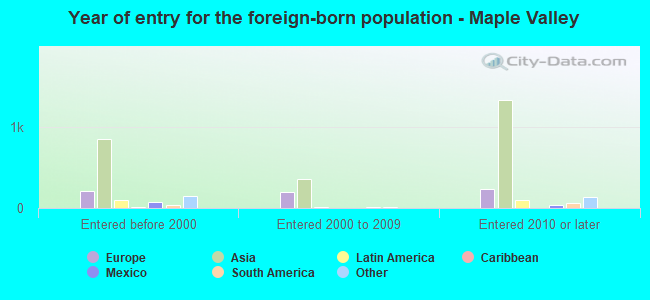
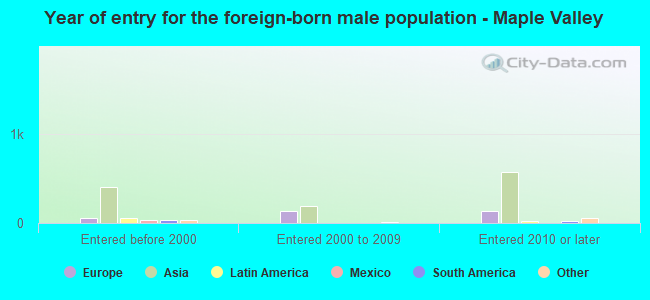
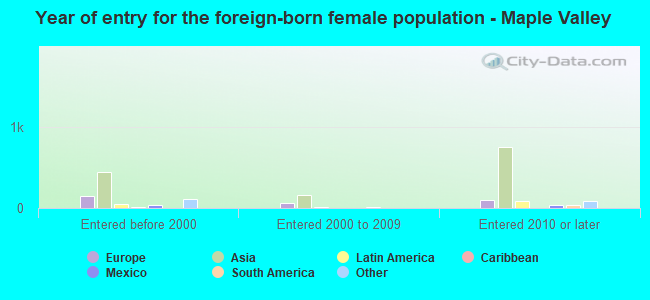
Foreign-born residents in Maple Valley 3,663 residents are foreign born (8.5% Asia , 2.4% Europe ).
This city:
13.1%Washington:
14.9%
Marital status for residents in Maple Valley Marital status - White (Caucasian) population 15 years and over
Males 26.7% Never married64.8% Now married0.0% Separated3.2% Widowed5.3% DivorcedFemales 17.0% Never married62.0% Now married0.3% Separated5.4% Widowed15.2% DivorcedWomen who gave birth in the past 12 months Now married:
77.0% (136)Unmarried:
23.0% (41)
Women who did not give birth in the past 12 months Now married:
63.2% (2,687)Unmarried:
36.8% (1,567)
Marital status - Black or African American population 15 years and over
Males 3.9% Never married96.1% Now married0.0% Separated0.0% Widowed0.0% DivorcedFemales 31.3% Never married61.5% Now married0.0% Separated7.1% Widowed0.0% DivorcedWomen who did not give birth in the past 12 months Now married:
62.5% (97)Unmarried:
37.5% (58)
Marital status - American Indian / Alaska Native population 15 years and over
Males 0.0% Never married100.0% Now married0.0% Separated0.0% Widowed0.0% DivorcedFemales 0.0% Never married100.0% Now married0.0% Separated0.0% Widowed0.0% DivorcedWomen who did not give birth in the past 12 months Now married:
100.0% (8)Unmarried:
0.0% (0)
Marital status - Asian population 15 years and over
Males 22.3% Never married76.9% Now married0.0% Separated0.0% Widowed0.8% DivorcedFemales 10.1% Never married77.7% Now married0.0% Separated4.0% Widowed8.3% DivorcedWomen who gave birth in the past 12 months Now married:
100.0% (126)Unmarried:
0.0% (0)
Women who did not give birth in the past 12 months Now married:
76.7% (674)Unmarried:
23.3% (205)
Marital status - Other race population 15 years and over
Males 33.1% Never married62.9% Now married4.0% Separated0.0% Widowed0.0% DivorcedFemales 14.2% Never married85.8% Now married0.0% Separated0.0% Widowed0.0% DivorcedWomen who did not give birth in the past 12 months Now married:
85.8% (149)Unmarried:
14.2% (25)
Marital status - Two or more races population 15 years and over
Males 36.1% Never married63.9% Now married0.0% Separated0.0% Widowed0.0% DivorcedFemales 30.2% Never married55.5% Now married0.0% Separated2.2% Widowed12.1% DivorcedWomen who gave birth in the past 12 months Now married:
72.7% (45)Unmarried:
27.3% (17)
Women who did not give birth in the past 12 months Now married:
50.1% (273)Unmarried:
49.9% (272)
Marital status - White alone, not Hispanic / Latino population 15 years and over
Males 26.5% Never married65.5% Now married0.0% Separated3.2% Widowed4.8% DivorcedFemales 16.6% Never married61.9% Now married0.3% Separated5.6% Widowed15.6% DivorcedWomen who gave birth in the past 12 months Now married:
77.0% (140)Unmarried:
23.0% (42)
Women who did not give birth in the past 12 months Now married:
63.2% (2,644)Unmarried:
36.8% (1,537)
Marital status - Hispanic or Latino population 15 years and over
Males 31.4% Never married54.8% Now married1.3% Separated3.0% Widowed9.5% DivorcedFemales 27.1% Never married69.1% Now married0.0% Separated0.0% Widowed3.7% DivorcedWomen who gave birth in the past 12 months Now married:
100.0% (20)Unmarried:
0.0% (0)
Women who did not give birth in the past 12 months Now married:
64.1% (291)Unmarried:
35.9% (163)
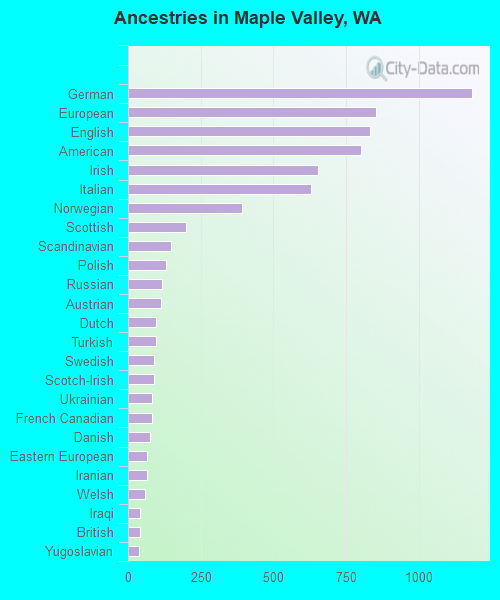
Ancestries in Maple Valley
1,183 9.6% German855 6.9% European831 6.7% English801 6.5% American655 5.3% Irish630 5.1% Italian393 3.2% Norwegian200 1.6% Scottish147 1.2% Scandinavian132 1.1% Polish117 0.9% Russian113 0.9% Austrian98 0.8% Dutch97 0.8% Turkish88 0.7% Swedish88 0.7% Scotch-Irish84 0.7% Ukrainian81 0.7% French Canadian75 0.6% Danish65 0.5% Eastern European64 0.5% Iranian59 0.5% Welsh43 0.3% Iraqi40 0.3% British37 0.3% Yugoslavian35 0.3% Czechoslovakian30 0.2% French29 0.2% Jamaican23 0.2% Swiss20 0.2% Syrian18 0.1% Croatian17 0.1% Finnish16 0.1% Ethiopian14 0.1% Northern European12 0.10% Brazilian7 0.06% Lebanese6 0.05% Trinidadian and Tobagonian5 0.04% Greek
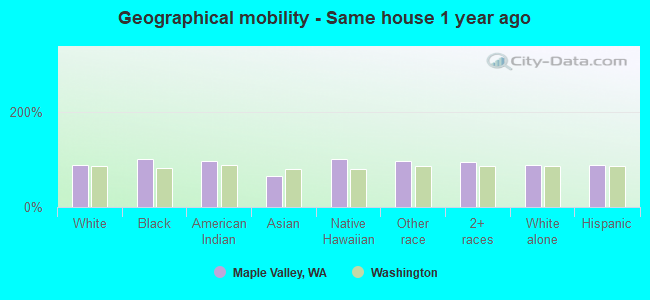
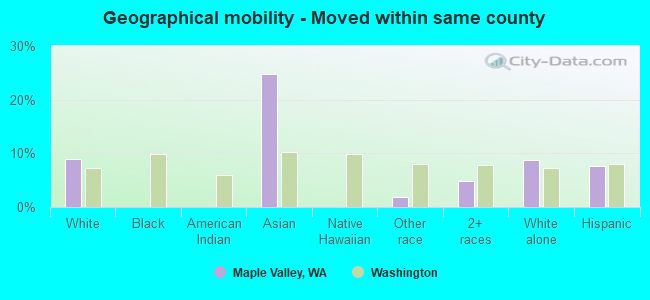
Geographical mobility in Maple Valley Same house 1 year ago 17,645 88.5% White (Caucasian)511 100.0% Black or African American34 96.7% American Indian / Alaska Native2,205 66.2% Asian66 100.0% Native Hawaiian / Pacific Islander422 96.7% Other race2,535 94.0% Two or more races17,360 88.7% White alone, not Hispanic / Latino1,354 88.8% Hispanic or LatinoMoved within same county 1,775 8.9% White / Caucasian826 24.8% Asian8 1.9% Other race129 4.8% Two or more races1,716 8.8% White alone, not Hispanic / Latino117 7.7% Hispanic or LatinoMoved within same state 134 0.7% White / Caucasian110 0.6% White alone, not Hispanic / Latino35 2.3% Hispanic or LatinoMoved from different state 380 1.9% White / Caucasian216 6.5% Asian5 0.2% Two or more races391 2.0% White alone, not Hispanic / LatinoMoved from abroad 49 0.2% White109 3.3% Asian89 3.3% Two or more races33 0.2% White alone, not Hispanic / Latino19 1.2% Hispanic or Latino
Children Nativity (place of birth) in Maple Valley
Children under 6 years - Living with two parents Both parents native 954 100.0% NativeBoth parents foreign-born 295 78.6% Native80 21.4% Foreign-bornOne native, one foreign-born parent 320 100.0% NativeChildren under 6 years - Living with one parent Native parent 364 100.0% NativeForeign-born parent 82 100.0% NativeChildren 6 to 17 years - Living with two parents Both parents native 3,920 100.0% NativeBoth parents foreign-born 361 52.8% Native323 47.2% Foreign-bornOne native, one foreign-born parent 503 98.1% Native10 1.9% Foreign-bornChildren 6 to 17 years - Living with one parent Native parent 1,320 100.0% NativeForeign-born parent 86 50.9% Native83 49.1% Foreign-born
Grandparents responsible for own grandchildren in Maple Valley
Grandparents (30 to 59 years) White / Caucasian 49 24.1% Responsible for grandchildren153 75.9% Not responsible for grandchildrenAsian 66 100.0% Not responsible for grandchildrenTwo or more races 9 100.0% Responsible for grandchildrenWhite alone, not Hispanic / Latino 48 22.3% Responsible for grandchildren168 77.7% Not responsible for grandchildrenGrandparents (60 years and over) White / Caucasian 49 20.9% Responsible for grandchildren187 79.1% Not responsible for grandchildrenAsian 4 100.0% Not responsible for grandchildrenTwo or more races 26 100.0% Not responsible for grandchildrenWhite alone, not Hispanic / Latino 49 20.5% Responsible for grandchildren190 79.5% Not responsible for grandchildren