Races in Mapleton, Utah (UT) Detailed Stats
Data:
Races - White alone (%)
Races - White alone (% change since 2000)
Races - Black alone (%)
Races - Black alone (% change since 2000)
Races - American Indian alone (%)
Races - American Indian alone (% change since 2000)
Races - Asian alone (%)
Races - Asian alone (% change since 2000)
Races - Hispanic (%)
Races - Hispanic (% change since 2000)
Races - Native Hawaiian and Other Pacific Islander alone (%)
Races - Native Hawaiian and Other Pacific Islander alone (% change since 2000)
Races - Two or more races(%)
Races - Two or more races(% change since 2000)
Races - Other race alone (%)
Races - Other race alone (% change since 2000)
Racial diversity
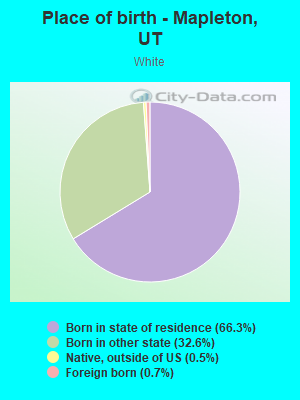
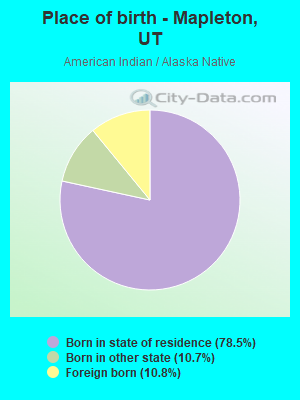
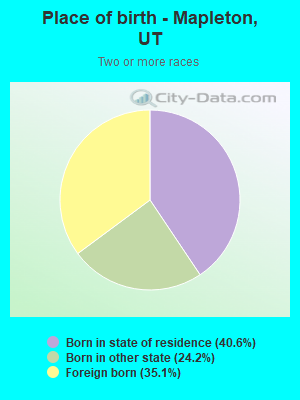
Place of birth - Born in state of residence (%)
Place of birth - Born in state of residence (%) - White
Place of birth - Born in state of residence (%) - Black or African American
Place of birth - Born in state of residence (%) - Asian
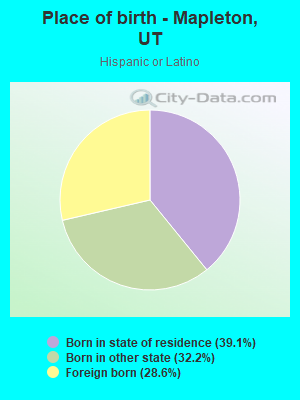
Place of birth - Born in state of residence (%) - Hispanic or Latino
Place of birth - Born in state of residence (%) - American Indian and Alaska Native
Place of birth - Born in state of residence (%) - Multirace
Place of birth - Born in state of residence (%) - Other Race
Place of birth - Born in other state (%)
Place of birth - Born in other state (%) - White
Place of birth - Born in other state (%) - Black or African American
Place of birth - Born in other state (%) - Asian
Place of birth - Born in other state (%) - Hispanic or Latino
Place of birth - Born in other state (%) - American Indian and Alaska Native
Place of birth - Born in other state (%) - Multirace
Place of birth - Born in other state (%) - Other Race
Place of birth - Native, outside of US (%)
Place of birth - Native, outside of US (%) - White
Place of birth - Native, outside of US (%) - Black or African American
Place of birth - Native, outside of US (%) - Asian
Place of birth - Native, outside of US (%) - Hispanic or Latino
Place of birth - Native, outside of US (%) - American Indian and Alaska Native
Place of birth - Native, outside of US (%) - Multirace
Place of birth - Native, outside of US (%) - Other Race
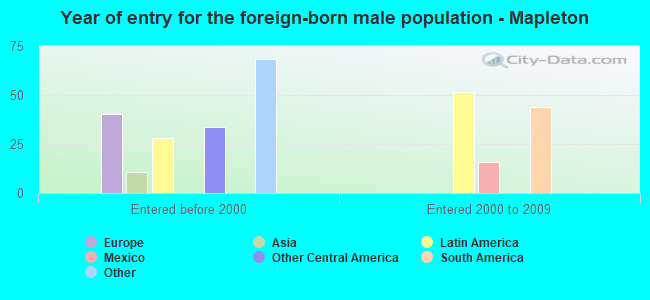
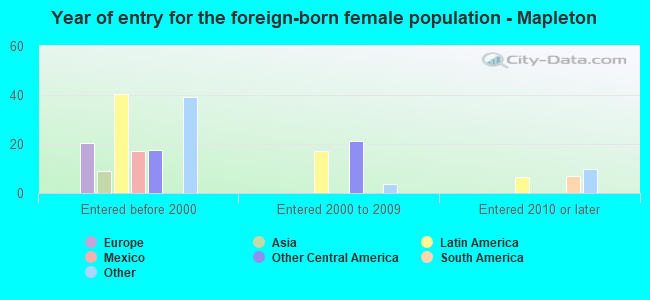
Place of birth - Foreign born (%)
Place of birth - Foreign born (%) - White
Place of birth - Foreign born (%) - Black or African American
Place of birth - Foreign born (%) - Asian
Place of birth - Foreign born (%) - Hispanic or Latino
Place of birth - Foreign born (%) - American Indian and Alaska Native
Place of birth - Foreign born (%) - Multirace
Place of birth - Foreign born (%) - Other Race
Residents speaking English at home (%)
Residents speaking English at home - Born in the United States (%)
Residents speaking English at home - Native, born elsewhere (%)
Residents speaking English at home - Foreign born (%)
Residents speaking Spanish at home (%)
Residents speaking Spanish at home - Born in the United States (%)
Residents speaking Spanish at home - Native, born elsewhere (%)
Residents speaking Spanish at home - Foreign born (%)
Residents speaking other language at home (%)
Residents speaking other language at home - Born in the United States (%)
Residents speaking other language at home - Native, born elsewhere (%)
Residents speaking other language at home - Foreign born (%)
Marital status - Never married (%)
Marital status - Now married (%)
Marital status - Separated (%)
Marital status - Widowed (%)
Marital status - Divorced (%)
Ancestries Reported - Arab (%)
Ancestries Reported - Czech (%)
Ancestries Reported - Danish (%)
Ancestries Reported - Dutch (%)
Ancestries Reported - English (%)
Ancestries Reported - French (%)
Ancestries Reported - French Canadian (%)
Ancestries Reported - German (%)
Ancestries Reported - Greek (%)
Ancestries Reported - Hungarian (%)
Ancestries Reported - Irish (%)
Ancestries Reported - Italian (%)
Ancestries Reported - Lithuanian (%)
Ancestries Reported - Norwegian (%)
Ancestries Reported - Polish (%)
Ancestries Reported - Portuguese (%)
Ancestries Reported - Russian (%)
Ancestries Reported - Scotch-Irish (%)
Ancestries Reported - Scottish (%)
Ancestries Reported - Slovak (%)
Ancestries Reported - Subsaharan African (%)
Ancestries Reported - Swedish (%)
Ancestries Reported - Swiss (%)
Ancestries Reported - Ukrainian (%)
Ancestries Reported - United States (%)
Ancestries Reported - Welsh (%)
Ancestries Reported - West Indian (%)
Ancestries Reported - Other (%)
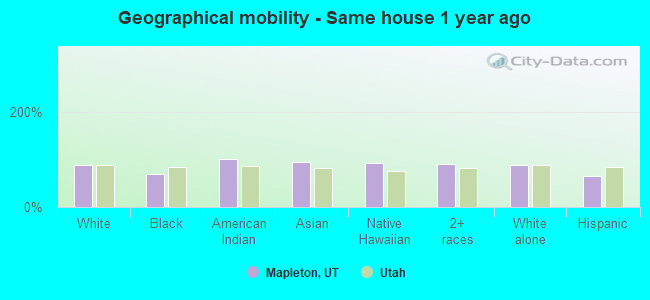
Geographical mobility - Same house 1 year ago (%)
Geographical mobility - Same house 1 year ago (%) - White
Geographical mobility - Same house 1 year ago (%) - Black or African American
Geographical mobility - Same house 1 year ago (%) - Asian
Geographical mobility - Same house 1 year ago (%) - Hispanic or Latino
Geographical mobility - Same house 1 year ago (%) - American Indian and Alaska Native
Geographical mobility - Same house 1 year ago (%) - Multirace
Geographical mobility - Same house 1 year ago (%) - Other Race
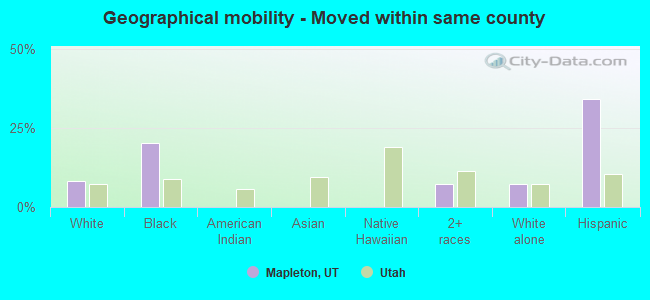
Geographical mobility - Moved within same county (%)
Geographical mobility - Moved within same county (%) - White
Geographical mobility - Moved within same county (%) - Black or African American
Geographical mobility - Moved within same county (%) - Asian
Geographical mobility - Moved within same county (%) - Hispanic or Latino
Geographical mobility - Moved within same county (%) - American Indian and Alaska Native
Geographical mobility - Moved within same county (%) - Multirace
Geographical mobility - Moved within same county (%) - Other Race
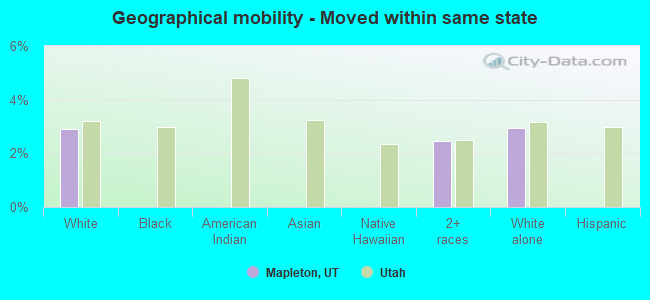
Geographical mobility - Moved from different county within same state (%)
Geographical mobility - Moved from different county within same state (%) - White
Geographical mobility - Moved from different county within same state (%) - Black or African American
Geographical mobility - Moved from different county within same state (%) - Asian
Geographical mobility - Moved from different county within same state (%) - Hispanic or Latino
Geographical mobility - Moved from different county within same state (%) - American Indian and Alaska Native
Geographical mobility - Moved from different county within same state (%) - Multirace
Geographical mobility - Moved from different county within same state (%) - Other Race
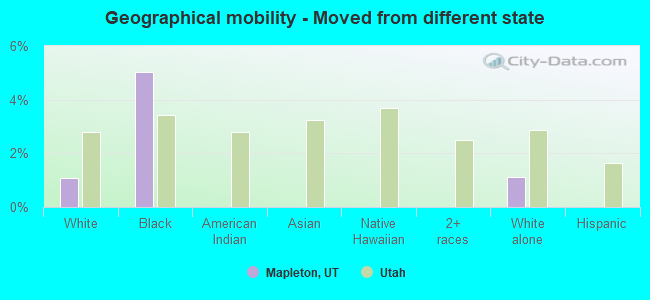
Geographical mobility - Moved from different state (%)
Geographical mobility - Moved from different state (%) - White
Geographical mobility - Moved from different state (%) - Black or African American
Geographical mobility - Moved from different state (%) - Asian
Geographical mobility - Moved from different state (%) - Hispanic or Latino
Geographical mobility - Moved from different state (%) - American Indian and Alaska Native
Geographical mobility - Moved from different state (%) - Multirace
Geographical mobility - Moved from different state (%) - Other Race
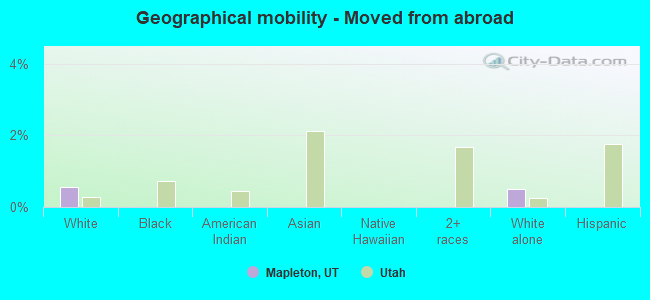
Geographical mobility - Moved from abroad (%)
Geographical mobility - Moved from abroad (%) - White
Geographical mobility - Moved from abroad (%) - Black or African American
Geographical mobility - Moved from abroad (%) - Asian
Geographical mobility - Moved from abroad (%) - Hispanic or Latino
Geographical mobility - Moved from abroad (%) - American Indian and Alaska Native
Geographical mobility - Moved from abroad (%) - Multirace
Geographical mobility - Moved from abroad (%) - Other Race
Place of birth for the foreign-born population - Ireland (%)
Place of birth for the foreign-born population - Denmark (%)
Place of birth for the foreign-born population - Norway (%)
Place of birth for the foreign-born population - Sweden (%)
Place of birth for the foreign-born population - United Kingdom (%)
Place of birth for the foreign-born population - England (%)
Place of birth for the foreign-born population - Scotland (%)
Place of birth for the foreign-born population - Other Northern Europe (%)
Place of birth for the foreign-born population - Austria (%)
Place of birth for the foreign-born population - Belgium (%)
Place of birth for the foreign-born population - France (%)
Place of birth for the foreign-born population - Germany (%)
Place of birth for the foreign-born population - Netherlands (%)
Place of birth for the foreign-born population - Switzerland (%)
Place of birth for the foreign-born population - Other Western Europe (%)
Place of birth for the foreign-born population - Greece (%)
Place of birth for the foreign-born population - Italy (%)
Place of birth for the foreign-born population - Portugal (%)
Place of birth for the foreign-born population - Spain (%)
Place of birth for the foreign-born population - Other Southern Europe (%)
Place of birth for the foreign-born population - Albania (%)
Place of birth for the foreign-born population - Belarus (%)
Place of birth for the foreign-born population - Bosnia and Herzegovina (%)
Place of birth for the foreign-born population - Bulgaria (%)
Place of birth for the foreign-born population - Croatia (%)
Place of birth for the foreign-born population - Czechoslovakia (%)
Place of birth for the foreign-born population - Hungary (%)
Place of birth for the foreign-born population - Latvia (%)
Place of birth for the foreign-born population - Lithuania (%)
Place of birth for the foreign-born population - North Macedonia (Macedonia) (%)
Place of birth for the foreign-born population - Moldova (%)
Place of birth for the foreign-born population - Poland (%)
Place of birth for the foreign-born population - Romania (%)
Place of birth for the foreign-born population - Russia (%)
Place of birth for the foreign-born population - Serbia (%)
Place of birth for the foreign-born population - Ukraine (%)
Place of birth for the foreign-born population - Other Eastern Europe (%)
Place of birth for the foreign-born population - China (%)
Place of birth for the foreign-born population - Hong Kong (%)
Place of birth for the foreign-born population - Taiwan (%)
Place of birth for the foreign-born population - Japan (%)
Place of birth for the foreign-born population - Korea (%)
Place of birth for the foreign-born population - Other Eastern Asia (%)
Place of birth for the foreign-born population - Afghanistan (%)
Place of birth for the foreign-born population - Bangladesh (%)
Place of birth for the foreign-born population - India (%)
Place of birth for the foreign-born population - Iran (%)
Place of birth for the foreign-born population - Kazakhstan (%)
Place of birth for the foreign-born population - Nepal (%)
Place of birth for the foreign-born population - Pakistan (%)
Place of birth for the foreign-born population - Sri Lanka (%)
Place of birth for the foreign-born population - Uzbekistan (%)
Place of birth for the foreign-born population - Other South Central Asia (%)
Place of birth for the foreign-born population - Burma (%)
Place of birth for the foreign-born population - Cambodia (%)
Place of birth for the foreign-born population - Indonesia (%)
Place of birth for the foreign-born population - Laos (%)
Place of birth for the foreign-born population - Malaysia (%)
Place of birth for the foreign-born population - Philippines (%)
Place of birth for the foreign-born population - Singapore (%)
Place of birth for the foreign-born population - Thailand (%)
Place of birth for the foreign-born population - Vietnam (%)
Place of birth for the foreign-born population - Other South Eastern Asia (%)
Place of birth for the foreign-born population - Armenia (%)
Place of birth for the foreign-born population - Iraq (%)
Place of birth for the foreign-born population - Israel (%)
Place of birth for the foreign-born population - Jordan (%)
Place of birth for the foreign-born population - Kuwait (%)
Place of birth for the foreign-born population - Lebanon (%)
Place of birth for the foreign-born population - Saudi Arabia (%)
Place of birth for the foreign-born population - Syria (%)
Place of birth for the foreign-born population - Turkey (%)
Place of birth for the foreign-born population - Yemen (%)
Place of birth for the foreign-born population - Other Western Asia (%)
Place of birth for the foreign-born population - Eritrea (%)
Place of birth for the foreign-born population - Ethiopia (%)
Place of birth for the foreign-born population - Kenya (%)
Place of birth for the foreign-born population - Somalia (%)
Place of birth for the foreign-born population - Uganda (%)
Place of birth for the foreign-born population - Zimbabwe (%)
Place of birth for the foreign-born population - Other Eastern Africa (%)
Place of birth for the foreign-born population - Cameroon (%)
Place of birth for the foreign-born population - Congo (%)
Place of birth for the foreign-born population - Democratic Republic of Congo (Zaire) (%)
Place of birth for the foreign-born population - Other Middle Africa (%)
Place of birth for the foreign-born population - Egypt (%)
Place of birth for the foreign-born population - Morocco (%)
Place of birth for the foreign-born population - Sudan (%)
Place of birth for the foreign-born population - Other Northern Africa (%)
Place of birth for the foreign-born population - South Africa (%)
Place of birth for the foreign-born population - Other Southern Africa (%)
Place of birth for the foreign-born population - Cabo Verde (%)
Place of birth for the foreign-born population - Ghana (%)
Place of birth for the foreign-born population - Liberia (%)
Place of birth for the foreign-born population - Nigeria (%)
Place of birth for the foreign-born population - Senegal (%)
Place of birth for the foreign-born population - Sierra Leone (%)
Place of birth for the foreign-born population - Other Western Africa (%)
Place of birth for the foreign-born population - Australia (%)
Place of birth for the foreign-born population - New Zealand (%)
Place of birth for the foreign-born population - Fiji (%)
Place of birth for the foreign-born population - Micronesia (%)
Place of birth for the foreign-born population - Bahamas (%)
Place of birth for the foreign-born population - Barbados (%)
Place of birth for the foreign-born population - Cuba (%)
Place of birth for the foreign-born population - Dominica (%)
Place of birth for the foreign-born population - Dominican Republic (%)
Place of birth for the foreign-born population - Grenada (%)
Place of birth for the foreign-born population - Haiti (%)
Place of birth for the foreign-born population - Jamaica (%)
Place of birth for the foreign-born population - St. Vincent and the Grenadines (%)
Place of birth for the foreign-born population - Trinidad and Tobago (%)
Place of birth for the foreign-born population - West Indies (%)
Place of birth for the foreign-born population - Other Caribbean (%)
Place of birth for the foreign-born population - Belize (%)
Place of birth for the foreign-born population - Costa Rica (%)
Place of birth for the foreign-born population - El Salvador (%)
Place of birth for the foreign-born population - Guatemala (%)
Place of birth for the foreign-born population - Honduras (%)
Place of birth for the foreign-born population - Mexico (%)
Place of birth for the foreign-born population - Nicaragua (%)
Place of birth for the foreign-born population - Panama (%)
Place of birth for the foreign-born population - Other Central America (%)
Place of birth for the foreign-born population - Argentina (%)
Place of birth for the foreign-born population - Bolivia (%)
Place of birth for the foreign-born population - Brazil (%)
Place of birth for the foreign-born population - Chile (%)
Place of birth for the foreign-born population - Colombia (%)
Place of birth for the foreign-born population - Ecuador (%)
Place of birth for the foreign-born population - Guyana (%)
Place of birth for the foreign-born population - Peru (%)
Place of birth for the foreign-born population - Uruguay (%)
Place of birth for the foreign-born population - Venezuela (%)
Place of birth for the foreign-born population - Other South America (%)
Place of birth for the foreign-born population - Canada (%)
Place of birth for the foreign-born population - Other Northern America (%)
Place of birth for the foreign-born population - Other (%)
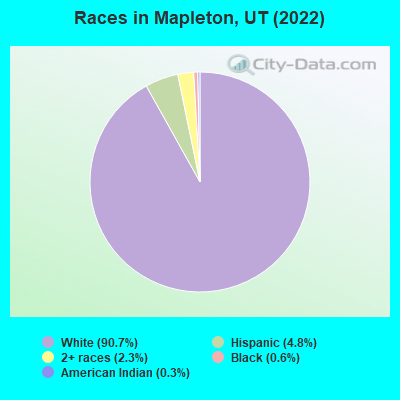
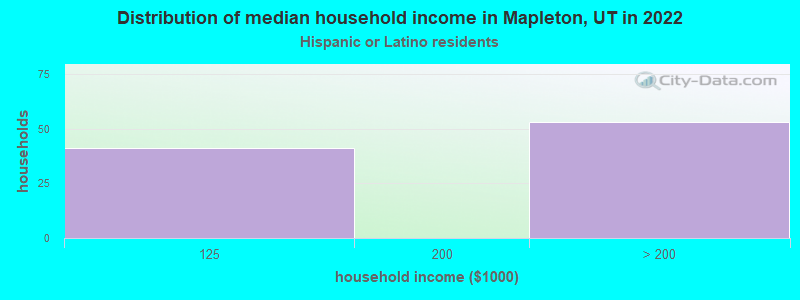
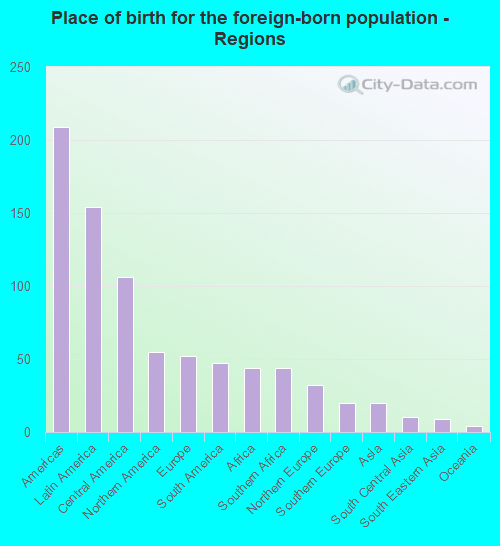
According to 2022 data, the most numerous races in Mapleton, UT are White alone (11,240 residents), Hispanic (592 residents), and Two or more races (285 residents). 93.3% of Mapleton residents speak English at home. 2.7% of Mapleton, UT residents are foreign-born (1.2% born in Latin America, 0.4% born in North America, 0.4% born in Europe, 0.4% born in Africa), which is 199.7% less than the foreign-born rate of 8.0% across the entire state of Utah.
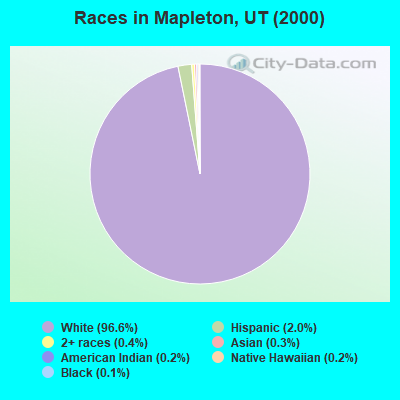
Race distribution in Mapleton
2000 2022
1,904,265 85.3% White alone 201,559 9.0% Hispanic 36,483 1.6% Asian alone 31,308 1.4% Two or more races 26,663 1.2% American Indian alone 14,806 0.7% Native Hawaiian and Other 16,137 0.7% Black alone 1,948 0.09% Other race alone
2,557,466 75.6% White alone 512,086 15.1% Hispanic 119,308 3.5% Two or more races 82,388 2.4% Asian alone 36,978 1.1% Native Hawaiian and Other 34,873 1.0% Black alone 22,803 0.7% American Indian alone 14,898 0.4% Other race alone
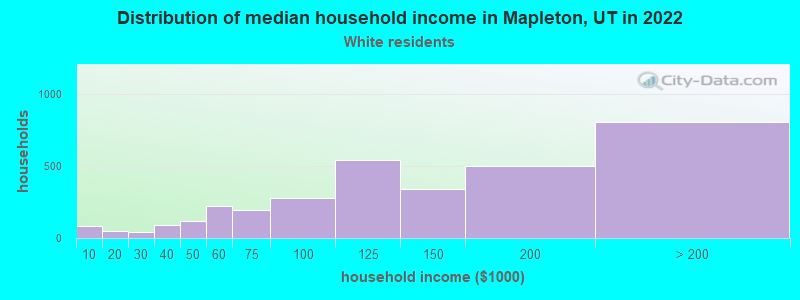
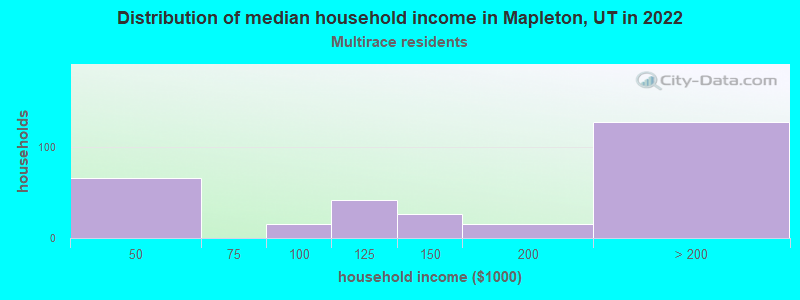
Income and house value in Mapleton Median household income in 2022 $128,028 White non-Hispanic householders$132,145 Two or more races householdersMedian 2022 house value $820,696 White Non-Hispanic householders$901,644 Black or African American householders $901,644 Asian householdersover $1,000,000 Some other race householders$943,320 Hispanic or Latino householders
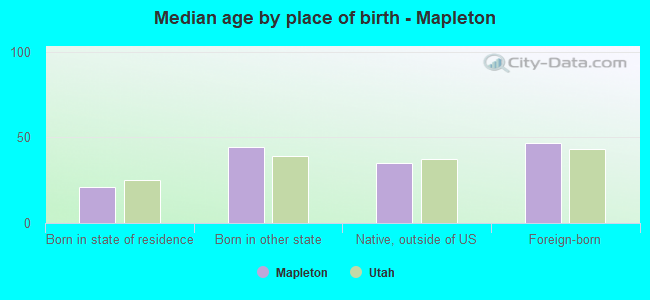
Median age by race in Mapleton
32.1 Median age for White residents25.3 36.7 19.3 Median age for Black or African American residents26.2 -640,650,405.9 3.0 Median age for American Indian / Alaska Native residents2.1 -706,192,357.7 -680,555,554.9 Median age for Asian residents-702,020,201.3 -674,974,038.8 -599,999,999.4 Median age for Native Hawaiian / Pacific Islander residents-749,999,999.2 -583,006,535.4 -664,294,186.8 Median age for Other race residents-650,349,649.7 -683,698,296.2 31.6 Median age for Two or more races residents37.5 20.0 32.9 Median age for White alone residents25.9 37.3 13.7 Median age for Hispanic or Latino residents16.2 13.1
Owner/renter occupied households by race in Mapleton
House owners and renters - White residents 2,762 86.7% Owner occupied424 13.3% Renter occupiedHouse owners and renters - Two or more races residents 225 81.9% Owner occupied50 18.1% Renter occupiedHouse owners and renters - White alone residents 2,822 86.5% Owner occupied441 13.5% Renter occupiedHouse owners and renters - Hispanic or Latino residents 87 100.0% Owner occupied
Language usage in Mapleton
English speakers - Total 93.3% of residents of Mapleton speak English at home.
4.0% of residents speak Spanish at home 365 78.2% Speak English very well102 21.8% Speak English less than very well2.1% of residents speak other language at home 218 87.6% Speak English very well31 12.4% Speak English less than very well
English speakers - Born in the United States 94.3% of residents of Mapleton speak English at home.
3.7% of residents speak Spanish at home 99 70.2% Speak English very well42 29.8% Speak English less than very well2.0% of residents speak other language at home 71 92.2% Speak English very well6 7.8% Speak English less than very well
All residents speak only English at home
English speakers - Foreign-born 36.2% of residents of Mapleton speak English at home.
37.9% of residents speak Spanish at home 125 92.6% Speak English very well10 7.4% Speak English less than very well17.1% of residents speak other language at home 51 83.6% Speak English very well10 16.4% Speak English less than very well
White (Caucasian) - Speak only English Native:
97.7% (10,314)Foreign-born:
73.6% (58)
White (Caucasian) - Speak another language Native:
2.9% (311)Foreign-born:
45.4% (35)
Two or more races - Speak only English Native:
65.3% (269)Foreign-born:
28.4% (75)
Two or more races - Speak another language Native:
36.7% (151)Foreign-born:
70.9% (187)
White alone - Speak only English Native:
96.5% (10,187)Foreign-born:
64.8% (66)
White alone - Speak another language Native:
3.6% (376)Foreign-born:
36.3% (37)
Hispanic or Latino - Speak another language Native:
34.9% (114)Foreign-born:
100.0% (163)
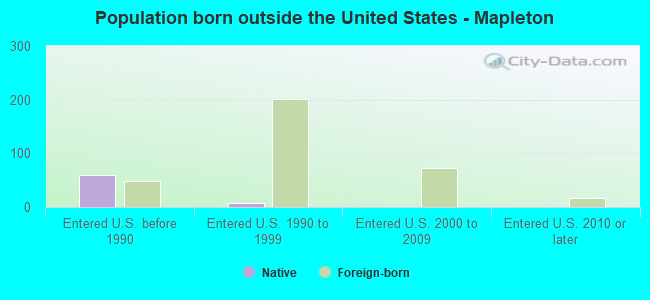
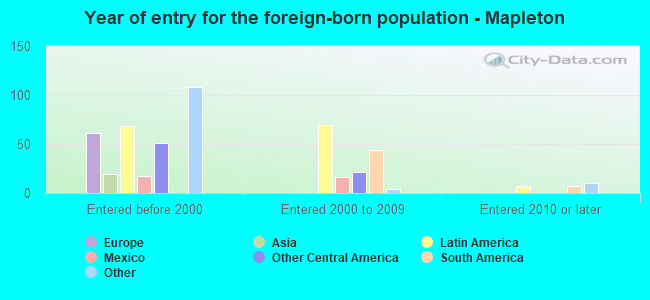
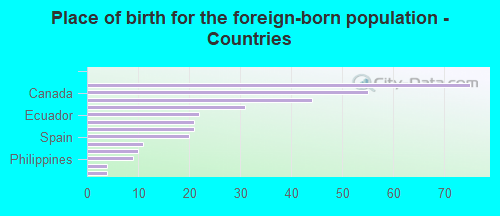
Foreign-born residents in Mapleton 331 residents are foreign born (1.2% Latin America , 0.4% North America , 0.4% Europe , 0.4% Africa ).
Marital status for residents in Mapleton Marital status - White (Caucasian) population 15 years and over
Males 28.8% Never married67.3% Now married0.8% Separated1.3% Widowed1.8% DivorcedFemales 21.3% Never married68.2% Now married1.6% Separated4.8% Widowed4.0% DivorcedWomen who gave birth in the past 12 months Now married:
94.5% (139)Unmarried:
5.5% (8)
Women who did not give birth in the past 12 months Now married:
57.8% (1,276)Unmarried:
42.2% (930)
Marital status - Black or African American population 15 years and over
Males 49.0% Never married0.0% Now married15.7% Separated0.0% Widowed35.3% DivorcedFemales 100.0% Never married0.0% Now married0.0% Separated0.0% Widowed0.0% DivorcedWomen who did not give birth in the past 12 months Now married:
0.0% (0)Unmarried:
100.0% (12)
Marital status - American Indian / Alaska Native population 15 years and over
Males 0.0% Never married100.0% Now married0.0% Separated0.0% Widowed0.0% DivorcedFemales 0.0% Never married100.0% Now married0.0% Separated0.0% Widowed0.0% DivorcedWomen who did not give birth in the past 12 months Now married:
100.0% (4)Unmarried:
0.0% (0)
Marital status - Two or more races population 15 years and over
Males 36.2% Never married63.8% Now married0.0% Separated0.0% Widowed0.0% DivorcedFemales 4.3% Never married79.5% Now married0.0% Separated5.0% Widowed11.2% DivorcedWomen who gave birth in the past 12 months Now married:
100.0% (8)Unmarried:
0.0% (0)
Women who did not give birth in the past 12 months Now married:
78.1% (115)Unmarried:
21.9% (32)
Marital status - White alone, not Hispanic / Latino population 15 years and over
Males 28.7% Never married67.4% Now married0.8% Separated1.3% Widowed1.8% DivorcedFemales 21.5% Never married68.0% Now married1.6% Separated4.9% Widowed4.0% DivorcedWomen who gave birth in the past 12 months Now married:
94.5% (143)Unmarried:
5.5% (8)
Women who did not give birth in the past 12 months Now married:
57.8% (1,315)Unmarried:
42.2% (958)
Marital status - Hispanic or Latino population 15 years and over
Males 33.8% Never married66.2% Now married0.0% Separated0.0% Widowed0.0% DivorcedFemales 0.0% Never married76.4% Now married0.0% Separated7.3% Widowed16.4% DivorcedWomen who did not give birth in the past 12 months Now married:
71.0% (49)Unmarried:
29.0% (20)
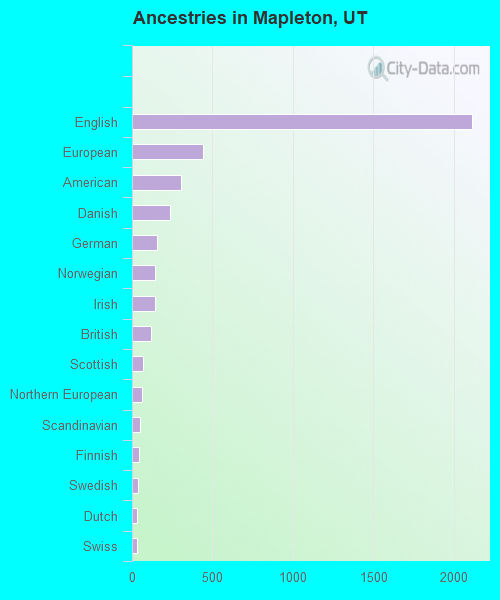
Ancestries in Mapleton
2,112 40.3% English439 8.4% European304 5.8% American239 4.6% Danish155 3.0% German145 2.8% Norwegian141 2.7% Irish118 2.3% British71 1.4% Scottish62 1.2% Northern European52 1.0% Scandinavian42 0.8% Finnish37 0.7% Swedish29 0.6% Dutch29 0.6% Swiss15 0.3% French14 0.3% Austrian14 0.3% Icelander14 0.3% Italian13 0.2% Iranian12 0.2% Ukrainian11 0.2% Scotch-Irish9 0.2% Welsh5 0.10% Canadian
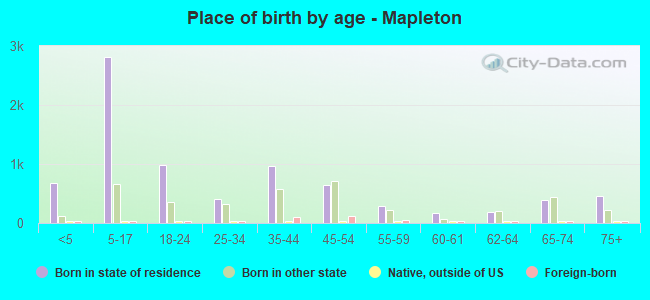
Children Nativity (place of birth) in Mapleton
Children under 6 years - Living with two parents Both parents native 678 100.0% NativeOne native, one foreign-born parent 143 100.0% NativeChildren under 6 years - Living with one parent Native parent 37 100.0% NativeChildren 6 to 17 years - Living with two parents Both parents native 2,617 100.0% NativeBoth parents foreign-born 70 100.0% NativeOne native, one foreign-born parent 283 100.0% NativeChildren 6 to 17 years - Living with one parent Native parent 307 100.0% NativeForeign-born parent 27 49.5% Native27 50.5% Foreign-born
Grandparents responsible for own grandchildren in Mapleton
Grandparents (30 to 59 years) White / Caucasian 111 100.0% Not responsible for grandchildrenWhite alone, not Hispanic / Latino 128 100.0% Not responsible for grandchildrenGrandparents (60 years and over) White / Caucasian 12 12.4% Responsible for grandchildren83 87.6% Not responsible for grandchildrenWhite alone, not Hispanic / Latino 12 12.1% Responsible for grandchildren88 87.9% Not responsible for grandchildren