Races in Marathon, Florida (FL) Detailed Stats
Data:
Races - White alone (%)
Races - White alone (% change since 2000)
Races - Black alone (%)
Races - Black alone (% change since 2000)
Races - American Indian alone (%)
Races - American Indian alone (% change since 2000)
Races - Asian alone (%)
Races - Asian alone (% change since 2000)
Races - Hispanic (%)
Races - Hispanic (% change since 2000)
Races - Native Hawaiian and Other Pacific Islander alone (%)
Races - Native Hawaiian and Other Pacific Islander alone (% change since 2000)
Races - Two or more races(%)
Races - Two or more races(% change since 2000)
Races - Other race alone (%)
Races - Other race alone (% change since 2000)
Racial diversity
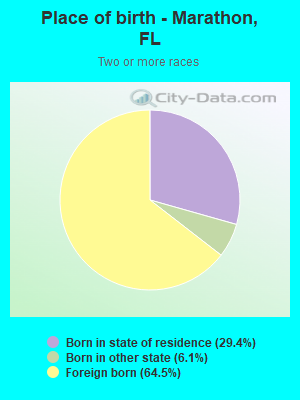
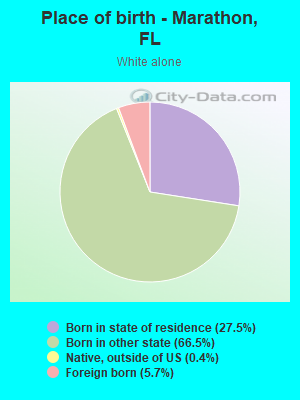
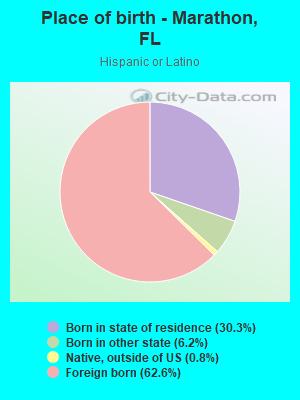
Place of birth - Born in state of residence (%)
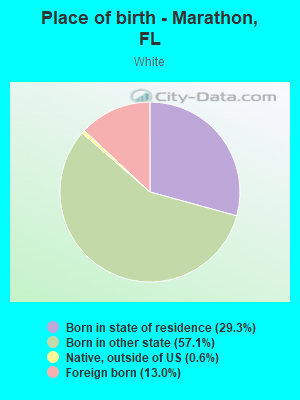
Place of birth - Born in state of residence (%) - White
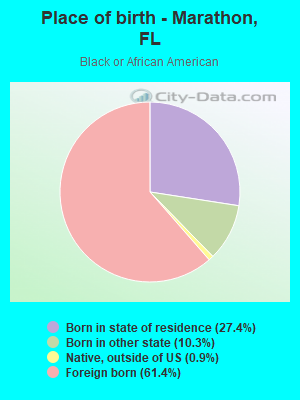
Place of birth - Born in state of residence (%) - Black or African American
Place of birth - Born in state of residence (%) - Asian
Place of birth - Born in state of residence (%) - Hispanic or Latino
Place of birth - Born in state of residence (%) - American Indian and Alaska Native
Place of birth - Born in state of residence (%) - Multirace
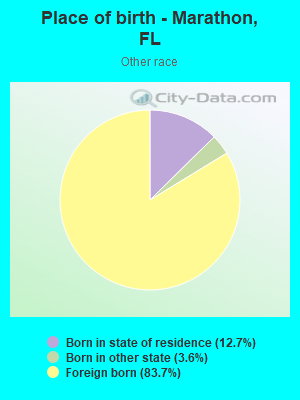
Place of birth - Born in state of residence (%) - Other Race
Place of birth - Born in other state (%)
Place of birth - Born in other state (%) - White
Place of birth - Born in other state (%) - Black or African American
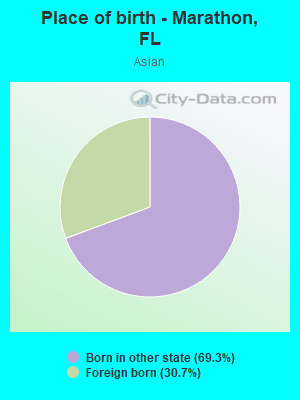
Place of birth - Born in other state (%) - Asian
Place of birth - Born in other state (%) - Hispanic or Latino
Place of birth - Born in other state (%) - American Indian and Alaska Native
Place of birth - Born in other state (%) - Multirace
Place of birth - Born in other state (%) - Other Race
Place of birth - Native, outside of US (%)
Place of birth - Native, outside of US (%) - White
Place of birth - Native, outside of US (%) - Black or African American
Place of birth - Native, outside of US (%) - Asian
Place of birth - Native, outside of US (%) - Hispanic or Latino
Place of birth - Native, outside of US (%) - American Indian and Alaska Native
Place of birth - Native, outside of US (%) - Multirace
Place of birth - Native, outside of US (%) - Other Race
Place of birth - Foreign born (%)
Place of birth - Foreign born (%) - White
Place of birth - Foreign born (%) - Black or African American
Place of birth - Foreign born (%) - Asian
Place of birth - Foreign born (%) - Hispanic or Latino
Place of birth - Foreign born (%) - American Indian and Alaska Native
Place of birth - Foreign born (%) - Multirace
Place of birth - Foreign born (%) - Other Race
Residents speaking English at home (%)
Residents speaking English at home - Born in the United States (%)
Residents speaking English at home - Native, born elsewhere (%)
Residents speaking English at home - Foreign born (%)
Residents speaking Spanish at home (%)
Residents speaking Spanish at home - Born in the United States (%)
Residents speaking Spanish at home - Native, born elsewhere (%)
Residents speaking Spanish at home - Foreign born (%)
Residents speaking other language at home (%)
Residents speaking other language at home - Born in the United States (%)
Residents speaking other language at home - Native, born elsewhere (%)
Residents speaking other language at home - Foreign born (%)
Marital status - Never married (%)
Marital status - Now married (%)
Marital status - Separated (%)
Marital status - Widowed (%)
Marital status - Divorced (%)
Ancestries Reported - Arab (%)
Ancestries Reported - Czech (%)
Ancestries Reported - Danish (%)
Ancestries Reported - Dutch (%)
Ancestries Reported - English (%)
Ancestries Reported - French (%)
Ancestries Reported - French Canadian (%)
Ancestries Reported - German (%)
Ancestries Reported - Greek (%)
Ancestries Reported - Hungarian (%)
Ancestries Reported - Irish (%)
Ancestries Reported - Italian (%)
Ancestries Reported - Lithuanian (%)
Ancestries Reported - Norwegian (%)
Ancestries Reported - Polish (%)
Ancestries Reported - Portuguese (%)
Ancestries Reported - Russian (%)
Ancestries Reported - Scotch-Irish (%)
Ancestries Reported - Scottish (%)
Ancestries Reported - Slovak (%)
Ancestries Reported - Subsaharan African (%)
Ancestries Reported - Swedish (%)
Ancestries Reported - Swiss (%)
Ancestries Reported - Ukrainian (%)
Ancestries Reported - United States (%)
Ancestries Reported - Welsh (%)
Ancestries Reported - West Indian (%)
Ancestries Reported - Other (%)
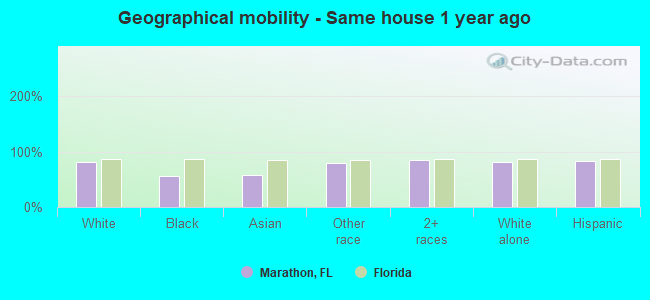
Geographical mobility - Same house 1 year ago (%)
Geographical mobility - Same house 1 year ago (%) - White
Geographical mobility - Same house 1 year ago (%) - Black or African American
Geographical mobility - Same house 1 year ago (%) - Asian
Geographical mobility - Same house 1 year ago (%) - Hispanic or Latino
Geographical mobility - Same house 1 year ago (%) - American Indian and Alaska Native
Geographical mobility - Same house 1 year ago (%) - Multirace
Geographical mobility - Same house 1 year ago (%) - Other Race
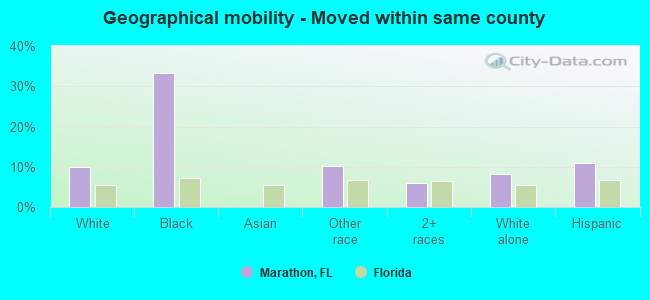
Geographical mobility - Moved within same county (%)
Geographical mobility - Moved within same county (%) - White
Geographical mobility - Moved within same county (%) - Black or African American
Geographical mobility - Moved within same county (%) - Asian
Geographical mobility - Moved within same county (%) - Hispanic or Latino
Geographical mobility - Moved within same county (%) - American Indian and Alaska Native
Geographical mobility - Moved within same county (%) - Multirace
Geographical mobility - Moved within same county (%) - Other Race
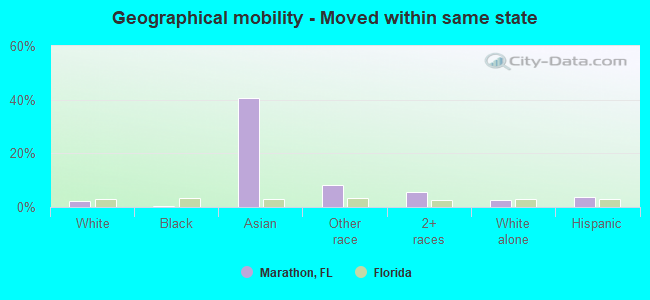
Geographical mobility - Moved from different county within same state (%)
Geographical mobility - Moved from different county within same state (%) - White
Geographical mobility - Moved from different county within same state (%) - Black or African American
Geographical mobility - Moved from different county within same state (%) - Asian
Geographical mobility - Moved from different county within same state (%) - Hispanic or Latino
Geographical mobility - Moved from different county within same state (%) - American Indian and Alaska Native
Geographical mobility - Moved from different county within same state (%) - Multirace
Geographical mobility - Moved from different county within same state (%) - Other Race
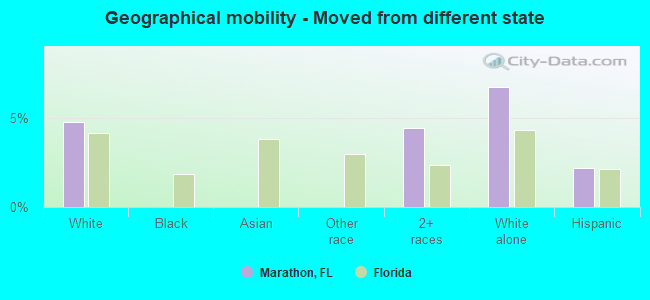
Geographical mobility - Moved from different state (%)
Geographical mobility - Moved from different state (%) - White
Geographical mobility - Moved from different state (%) - Black or African American
Geographical mobility - Moved from different state (%) - Asian
Geographical mobility - Moved from different state (%) - Hispanic or Latino
Geographical mobility - Moved from different state (%) - American Indian and Alaska Native
Geographical mobility - Moved from different state (%) - Multirace
Geographical mobility - Moved from different state (%) - Other Race
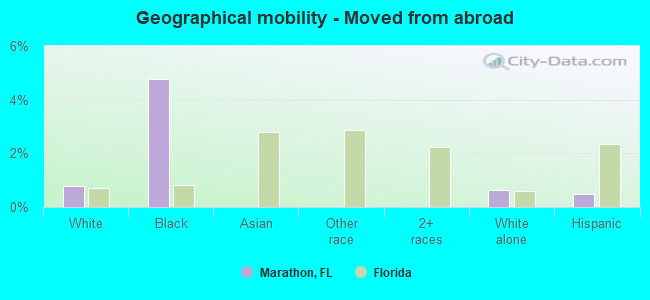
Geographical mobility - Moved from abroad (%)
Geographical mobility - Moved from abroad (%) - White
Geographical mobility - Moved from abroad (%) - Black or African American
Geographical mobility - Moved from abroad (%) - Asian
Geographical mobility - Moved from abroad (%) - Hispanic or Latino
Geographical mobility - Moved from abroad (%) - American Indian and Alaska Native
Geographical mobility - Moved from abroad (%) - Multirace
Geographical mobility - Moved from abroad (%) - Other Race
Place of birth for the foreign-born population - Ireland (%)
Place of birth for the foreign-born population - Denmark (%)
Place of birth for the foreign-born population - Norway (%)
Place of birth for the foreign-born population - Sweden (%)
Place of birth for the foreign-born population - United Kingdom (%)
Place of birth for the foreign-born population - England (%)
Place of birth for the foreign-born population - Scotland (%)
Place of birth for the foreign-born population - Other Northern Europe (%)
Place of birth for the foreign-born population - Austria (%)
Place of birth for the foreign-born population - Belgium (%)
Place of birth for the foreign-born population - France (%)
Place of birth for the foreign-born population - Germany (%)
Place of birth for the foreign-born population - Netherlands (%)
Place of birth for the foreign-born population - Switzerland (%)
Place of birth for the foreign-born population - Other Western Europe (%)
Place of birth for the foreign-born population - Greece (%)
Place of birth for the foreign-born population - Italy (%)
Place of birth for the foreign-born population - Portugal (%)
Place of birth for the foreign-born population - Spain (%)
Place of birth for the foreign-born population - Other Southern Europe (%)
Place of birth for the foreign-born population - Albania (%)
Place of birth for the foreign-born population - Belarus (%)
Place of birth for the foreign-born population - Bosnia and Herzegovina (%)
Place of birth for the foreign-born population - Bulgaria (%)
Place of birth for the foreign-born population - Croatia (%)
Place of birth for the foreign-born population - Czechoslovakia (%)
Place of birth for the foreign-born population - Hungary (%)
Place of birth for the foreign-born population - Latvia (%)
Place of birth for the foreign-born population - Lithuania (%)
Place of birth for the foreign-born population - North Macedonia (Macedonia) (%)
Place of birth for the foreign-born population - Moldova (%)
Place of birth for the foreign-born population - Poland (%)
Place of birth for the foreign-born population - Romania (%)
Place of birth for the foreign-born population - Russia (%)
Place of birth for the foreign-born population - Serbia (%)
Place of birth for the foreign-born population - Ukraine (%)
Place of birth for the foreign-born population - Other Eastern Europe (%)
Place of birth for the foreign-born population - China (%)
Place of birth for the foreign-born population - Hong Kong (%)
Place of birth for the foreign-born population - Taiwan (%)
Place of birth for the foreign-born population - Japan (%)
Place of birth for the foreign-born population - Korea (%)
Place of birth for the foreign-born population - Other Eastern Asia (%)
Place of birth for the foreign-born population - Afghanistan (%)
Place of birth for the foreign-born population - Bangladesh (%)
Place of birth for the foreign-born population - India (%)
Place of birth for the foreign-born population - Iran (%)
Place of birth for the foreign-born population - Kazakhstan (%)
Place of birth for the foreign-born population - Nepal (%)
Place of birth for the foreign-born population - Pakistan (%)
Place of birth for the foreign-born population - Sri Lanka (%)
Place of birth for the foreign-born population - Uzbekistan (%)
Place of birth for the foreign-born population - Other South Central Asia (%)
Place of birth for the foreign-born population - Burma (%)
Place of birth for the foreign-born population - Cambodia (%)
Place of birth for the foreign-born population - Indonesia (%)
Place of birth for the foreign-born population - Laos (%)
Place of birth for the foreign-born population - Malaysia (%)
Place of birth for the foreign-born population - Philippines (%)
Place of birth for the foreign-born population - Singapore (%)
Place of birth for the foreign-born population - Thailand (%)
Place of birth for the foreign-born population - Vietnam (%)
Place of birth for the foreign-born population - Other South Eastern Asia (%)
Place of birth for the foreign-born population - Armenia (%)
Place of birth for the foreign-born population - Iraq (%)
Place of birth for the foreign-born population - Israel (%)
Place of birth for the foreign-born population - Jordan (%)
Place of birth for the foreign-born population - Kuwait (%)
Place of birth for the foreign-born population - Lebanon (%)
Place of birth for the foreign-born population - Saudi Arabia (%)
Place of birth for the foreign-born population - Syria (%)
Place of birth for the foreign-born population - Turkey (%)
Place of birth for the foreign-born population - Yemen (%)
Place of birth for the foreign-born population - Other Western Asia (%)
Place of birth for the foreign-born population - Eritrea (%)
Place of birth for the foreign-born population - Ethiopia (%)
Place of birth for the foreign-born population - Kenya (%)
Place of birth for the foreign-born population - Somalia (%)
Place of birth for the foreign-born population - Uganda (%)
Place of birth for the foreign-born population - Zimbabwe (%)
Place of birth for the foreign-born population - Other Eastern Africa (%)
Place of birth for the foreign-born population - Cameroon (%)
Place of birth for the foreign-born population - Congo (%)
Place of birth for the foreign-born population - Democratic Republic of Congo (Zaire) (%)
Place of birth for the foreign-born population - Other Middle Africa (%)
Place of birth for the foreign-born population - Egypt (%)
Place of birth for the foreign-born population - Morocco (%)
Place of birth for the foreign-born population - Sudan (%)
Place of birth for the foreign-born population - Other Northern Africa (%)
Place of birth for the foreign-born population - South Africa (%)
Place of birth for the foreign-born population - Other Southern Africa (%)
Place of birth for the foreign-born population - Cabo Verde (%)
Place of birth for the foreign-born population - Ghana (%)
Place of birth for the foreign-born population - Liberia (%)
Place of birth for the foreign-born population - Nigeria (%)
Place of birth for the foreign-born population - Senegal (%)
Place of birth for the foreign-born population - Sierra Leone (%)
Place of birth for the foreign-born population - Other Western Africa (%)
Place of birth for the foreign-born population - Australia (%)
Place of birth for the foreign-born population - New Zealand (%)
Place of birth for the foreign-born population - Fiji (%)
Place of birth for the foreign-born population - Micronesia (%)
Place of birth for the foreign-born population - Bahamas (%)
Place of birth for the foreign-born population - Barbados (%)
Place of birth for the foreign-born population - Cuba (%)
Place of birth for the foreign-born population - Dominica (%)
Place of birth for the foreign-born population - Dominican Republic (%)
Place of birth for the foreign-born population - Grenada (%)
Place of birth for the foreign-born population - Haiti (%)
Place of birth for the foreign-born population - Jamaica (%)
Place of birth for the foreign-born population - St. Vincent and the Grenadines (%)
Place of birth for the foreign-born population - Trinidad and Tobago (%)
Place of birth for the foreign-born population - West Indies (%)
Place of birth for the foreign-born population - Other Caribbean (%)
Place of birth for the foreign-born population - Belize (%)
Place of birth for the foreign-born population - Costa Rica (%)
Place of birth for the foreign-born population - El Salvador (%)
Place of birth for the foreign-born population - Guatemala (%)
Place of birth for the foreign-born population - Honduras (%)
Place of birth for the foreign-born population - Mexico (%)
Place of birth for the foreign-born population - Nicaragua (%)
Place of birth for the foreign-born population - Panama (%)
Place of birth for the foreign-born population - Other Central America (%)
Place of birth for the foreign-born population - Argentina (%)
Place of birth for the foreign-born population - Bolivia (%)
Place of birth for the foreign-born population - Brazil (%)
Place of birth for the foreign-born population - Chile (%)
Place of birth for the foreign-born population - Colombia (%)
Place of birth for the foreign-born population - Ecuador (%)
Place of birth for the foreign-born population - Guyana (%)
Place of birth for the foreign-born population - Peru (%)
Place of birth for the foreign-born population - Uruguay (%)
Place of birth for the foreign-born population - Venezuela (%)
Place of birth for the foreign-born population - Other South America (%)
Place of birth for the foreign-born population - Canada (%)
Place of birth for the foreign-born population - Other Northern America (%)
Place of birth for the foreign-born population - Other (%)
Latest news about races in Marathon, FL collected exclusively by city-data.com from local newspapers, TV, and radio stations
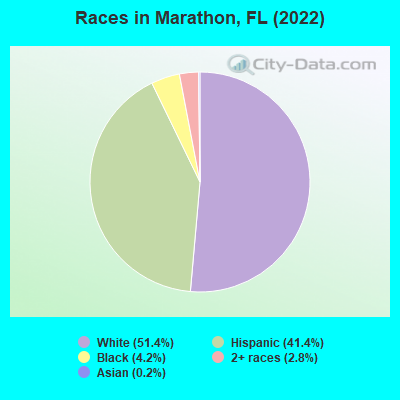
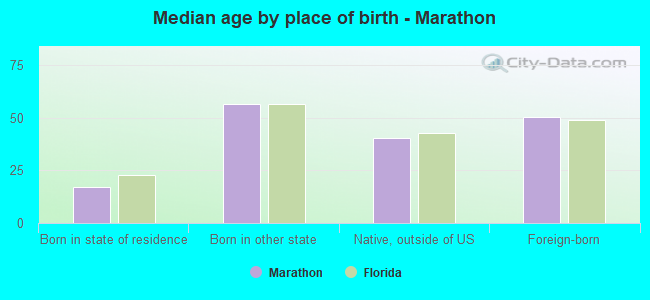
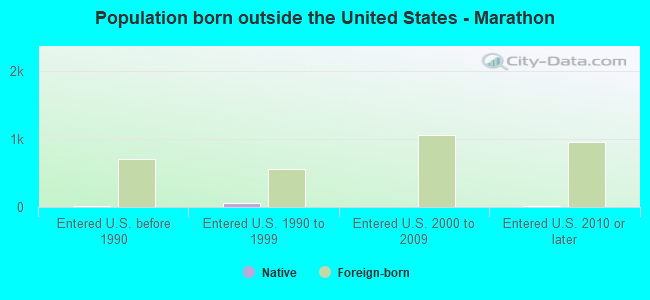
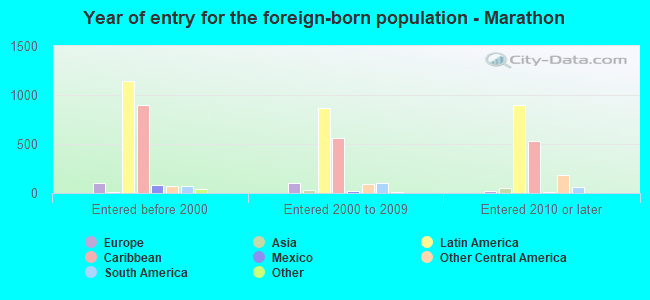
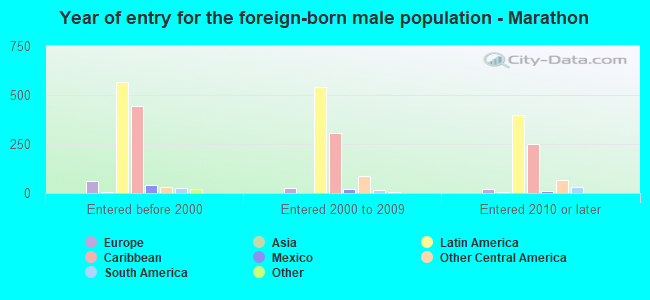
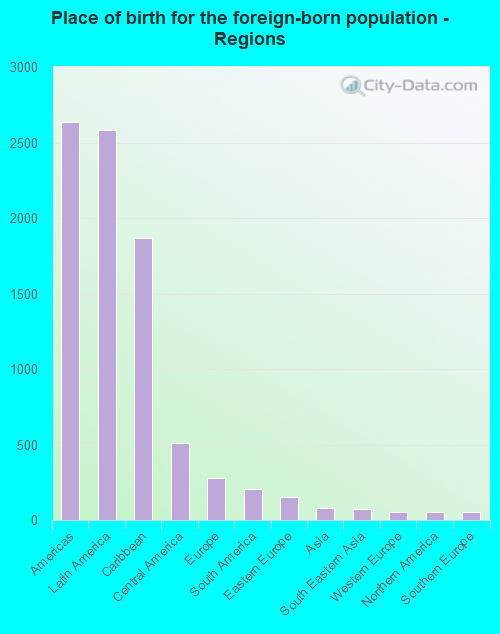
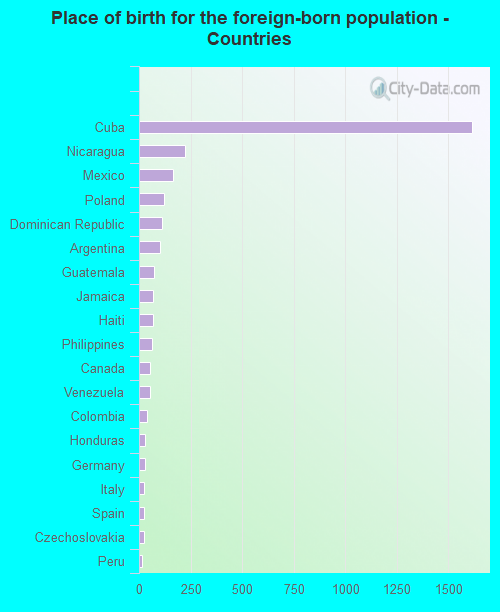
According to 2022 data, the most numerous races in Marathon, FL are White alone (5,010 residents), Hispanic (4,033 residents), and Black alone (413 residents). 69.5% of Marathon residents speak English at home. 30.7% of Marathon, FL residents are foreign-born (25.0% born in Latin America), which is 31.7% greater than the foreign-born rate of 21.0% across the entire state of Florida.
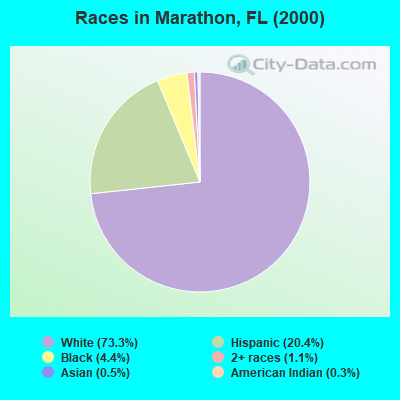
Race distribution in Marathon
2000 2022
10,458,509 65.4% White alone 2,682,715 16.8% Hispanic 2,264,268 14.2% Black alone 261,693 1.6% Asian alone 236,954 1.5% Two or more races 42,358 0.3% American Indian alone 28,994 0.2% Other race alone 6,887 0.04% Native Hawaiian and Other
11,309,403 50.8% White alone 6,025,039 27.1% Hispanic 3,241,015 14.6% Black alone 861,630 3.9% Two or more races 623,692 2.8% Asian alone 152,054 0.7% Other race alone 22,504 0.1% American Indian alone 9,486 0.04% Native Hawaiian and Other
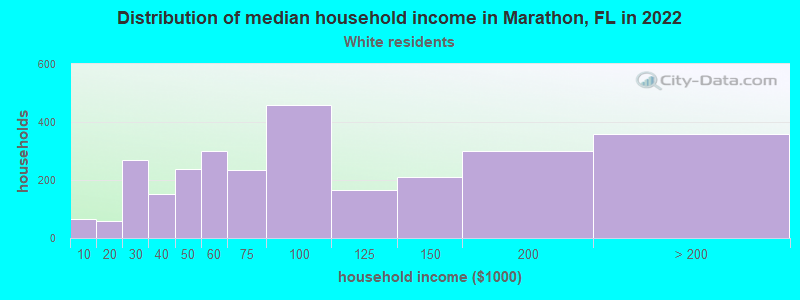
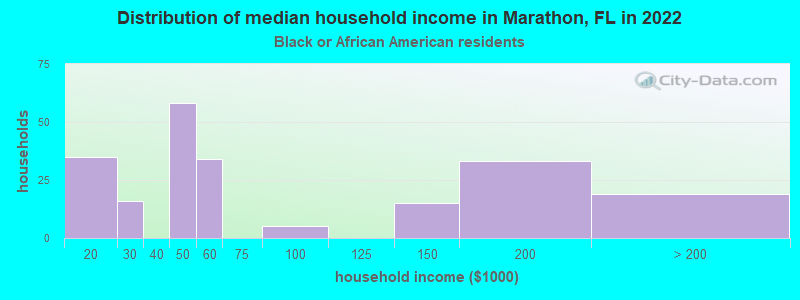
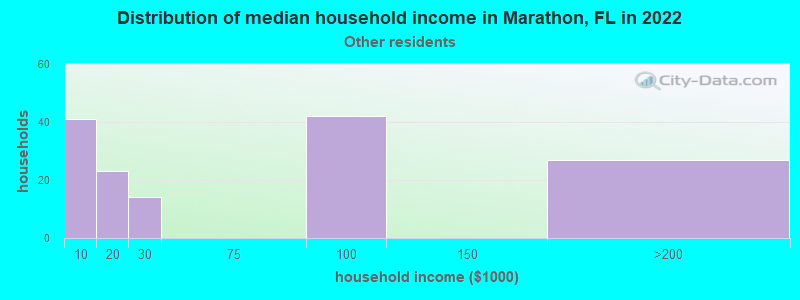
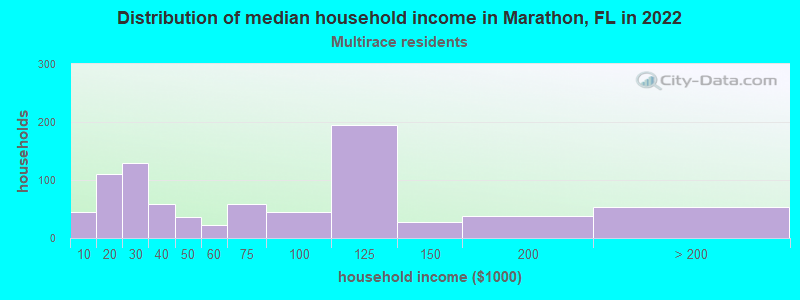
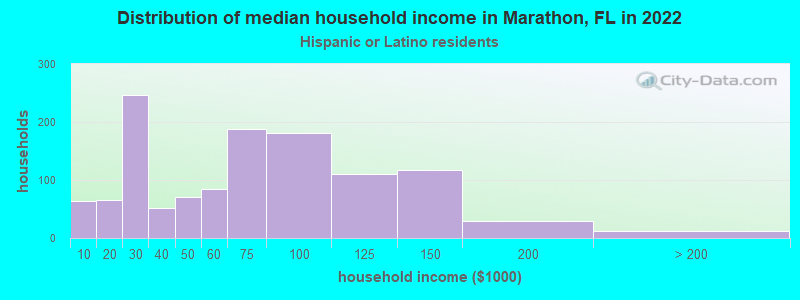
Income and house value in Marathon Median household income in 2022 $82,058 White non-Hispanic householders$43,496 Black householders$64,458 Two or more races householders$67,447 Hispanic or Latino race householdersMedian 2022 house value over $1,000,000 White Non-Hispanic householders$421,802 Black or African American householders$823,180 Some other race householders$749,475 Two or more races householders$792,100 Hispanic or Latino householders
Median age by race in Marathon
49.1 Median age for White residents50.2 47.8 57.6 Median age for Black or African American residents61.9 53.2 -598,566,307.6 Median age for American Indian / Alaska Native residents-611,418,047.3 -594,925,633.7 38.2 Median age for Asian residents-537,588,651.9 48.0 -679,849,340.2 Median age for Native Hawaiian / Pacific Islander residents-858,307,848.3 -666,666,666.0 33.4 Median age for Other race residents37.3 31.3 43.9 Median age for Two or more races residents45.4 45.5 52.9 Median age for White alone residents54.7 50.9 39.8 Median age for Hispanic or Latino residents36.4 42.5
Owner/renter occupied households by race in Marathon
House owners and renters - White residents 1,818 65.1% Owner occupied974 34.9% Renter occupiedHouse owners and renters - Black or African American residents 211 100.0% Renter occupiedHouse owners and renters - Asian residents 23 100.0% Renter occupiedHouse owners and renters - Other race residents 30 27.4% Owner occupied79 72.6% Renter occupiedHouse owners and renters - Two or more races residents 246 25.8% Owner occupied709 74.2% Renter occupiedHouse owners and renters - White alone residents 1,788 72.5% Owner occupied679 27.5% Renter occupiedHouse owners and renters - Hispanic or Latino residents 250 20.3% Owner occupied981 79.7% Renter occupied
Language usage in Marathon
English speakers - Total 69.5% of residents of Marathon speak English at home.
26.9% of residents speak Spanish at home 871 34.4% Speak English very well1,659 65.6% Speak English less than very well2.7% of residents speak other language at home 172 66.7% Speak English very well86 33.3% Speak English less than very well
English speakers - Born in the United States 98.0% of residents of Marathon speak English at home.
3.3% of residents speak Spanish at home 102 82.9% Speak English very well21 17.1% Speak English less than very well1.1% of residents speak other language at home 42 100.0% Speak English very well
English speakers - Native, born elsewhere 42.9% of residents of Marathon speak English at home.
29.9% of residents speak Spanish at home 8 34.8% Speak English very well15 65.2% Speak English less than very well57.1% of residents speak other language at home 44 100.0% Speak English very well
English speakers - Foreign-born 27.7% of residents of Marathon speak English at home.
63.1% of residents speak Spanish at home 538 26.1% Speak English very well1,524 73.9% Speak English less than very well5.3% of residents speak other language at home 95 54.6% Speak English very well79 45.4% Speak English less than very well
White (Caucasian) - Speak only English Native:
93.6% (4,794)Foreign-born:
50.3% (401)
White (Caucasian) - Speak another language Native:
5.0% (254)Foreign-born:
52.6% (419)
Black or African American - Speak only English Native:
89.7% (228)Foreign-born:
82.6% (132)
Black or African American - Speak another language Native:
10.3% (26)Foreign-born:
15.2% (24)
Asian - Speak only English Native:
100.0% (37)Foreign-born:
30.6% (5)
Other race - Speak only English Native:
58.1% (42)Foreign-born:
38.2% (157)
Other race - Speak another language Native:
40.9% (30)Foreign-born:
62.8% (258)
Two or more races - Speak only English Native:
67.9% (650)Foreign-born:
9.9% (202)
Two or more races - Speak another language Native:
34.3% (328)Foreign-born:
90.6% (1,854)
White alone - Speak only English Native:
97.6% (4,391)Foreign-born:
75.7% (216)
White alone - Speak another language Native:
2.4% (107)Foreign-born:
28.5% (81)
Hispanic or Latino - Speak only English Native:
67.6% (942)Foreign-born:
18.1% (468)
Hispanic or Latino - Speak another language Native:
32.8% (457)Foreign-born:
81.8% (2,121)
Foreign-born residents in Marathon 2,996 residents are foreign born (25.0% Latin America ).
This city:
30.7%Florida:
21.1%
Marital status for residents in Marathon Marital status - White (Caucasian) population 15 years and over
Males 30.0% Never married43.4% Now married1.8% Separated4.9% Widowed19.9% DivorcedFemales 23.9% Never married50.9% Now married1.5% Separated10.0% Widowed13.7% DivorcedWomen who gave birth in the past 12 months Now married:
30.1% (36)Unmarried:
69.9% (84)
Women who did not give birth in the past 12 months Now married:
51.5% (542)Unmarried:
48.5% (510)
Marital status - Black or African American population 15 years and over
Males 26.9% Never married47.8% Now married20.9% Separated0.0% Widowed4.4% DivorcedFemales 56.8% Never married18.8% Now married0.0% Separated17.4% Widowed7.0% DivorcedWomen who did not give birth in the past 12 months Now married:
8.8% (7)Unmarried:
91.2% (72)
Marital status - Asian population 15 years and over
Males 100.0% Never married0.0% Now married0.0% Separated0.0% Widowed0.0% DivorcedFemales 31.8% Never married18.2% Now married0.0% Separated0.0% Widowed50.0% DivorcedWomen who did not give birth in the past 12 months Now married:
18.6% (8)Unmarried:
81.4% (36)
Marital status - Other race population 15 years and over
Males 22.0% Never married48.2% Now married0.0% Separated5.7% Widowed24.1% DivorcedFemales 44.2% Never married55.8% Now married0.0% Separated0.0% Widowed0.0% DivorcedWomen who gave birth in the past 12 months Now married:
0.0% (0)Unmarried:
100.0% (14)
Women who did not give birth in the past 12 months Now married:
49.0% (70)Unmarried:
51.0% (73)
Marital status - Two or more races population 15 years and over
Males 36.1% Never married50.1% Now married1.7% Separated0.0% Widowed12.1% DivorcedFemales 25.7% Never married53.3% Now married2.8% Separated3.2% Widowed15.0% DivorcedWomen who gave birth in the past 12 months Now married:
100.0% (21)Unmarried:
0.0% (0)
Women who did not give birth in the past 12 months Now married:
80.7% (430)Unmarried:
19.3% (103)
Marital status - White alone, not Hispanic / Latino population 15 years and over
Males 25.6% Never married46.8% Now married1.5% Separated6.5% Widowed19.6% DivorcedFemales 18.7% Never married54.5% Now married0.0% Separated12.1% Widowed14.7% DivorcedWomen who gave birth in the past 12 months Now married:
31.9% (28)Unmarried:
68.1% (59)
Women who did not give birth in the past 12 months Now married:
55.6% (388)Unmarried:
44.4% (309)
Marital status - Hispanic or Latino population 15 years and over
Males 38.5% Never married41.6% Now married2.2% Separated0.5% Widowed17.2% DivorcedFemales 33.6% Never married46.6% Now married4.0% Separated3.7% Widowed12.2% DivorcedWomen who gave birth in the past 12 months Now married:
36.7% (26)Unmarried:
63.3% (46)
Women who did not give birth in the past 12 months Now married:
55.5% (491)Unmarried:
44.5% (393)
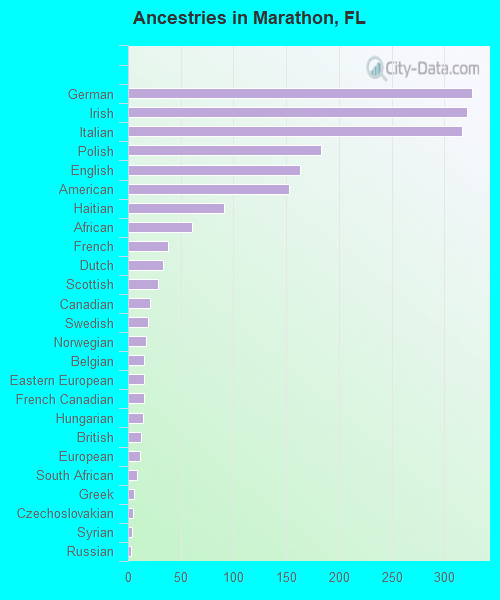
Ancestries in Marathon
326 6.7% German321 6.6% Irish317 6.5% Italian183 3.7% Polish163 3.3% English153 3.1% American91 1.9% Haitian61 1.2% African38 0.8% French33 0.7% Dutch28 0.6% Scottish21 0.4% Canadian19 0.4% Swedish17 0.3% Norwegian15 0.3% Belgian15 0.3% Eastern European15 0.3% French Canadian14 0.3% Hungarian12 0.2% British11 0.2% European9 0.2% South African6 0.1% Greek5 0.1% Czechoslovakian4 0.08% Syrian3 0.06% Russian2 0.04% Scandinavian
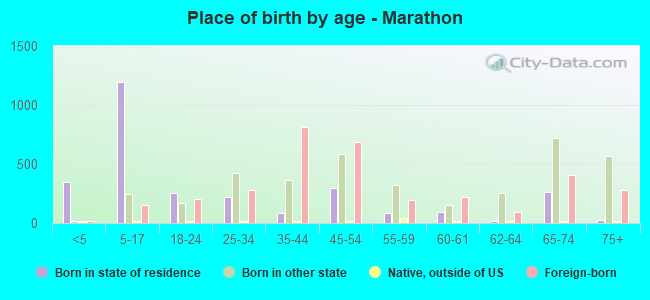
Children Nativity (place of birth) in Marathon
Children under 6 years - Living with two parents Both parents native 125 100.0% NativeBoth parents foreign-born 113 100.0% NativeOne native, one foreign-born parent 41 100.0% NativeChildren under 6 years - Living with one parent Native parent 64 100.0% NativeForeign-born parent 106 100.0% NativeChildren 6 to 17 years - Living with two parents Both parents native 311 100.0% NativeBoth parents foreign-born 421 87.3% Native61 12.7% Foreign-bornOne native, one foreign-born parent 153 100.0% NativeChildren 6 to 17 years - Living with one parent Native parent 168 87.3% Native24 12.7% Foreign-bornForeign-born parent 155 69.7% Native68 30.3% Foreign-born
Grandparents responsible for own grandchildren in Marathon
Grandparents (30 to 59 years) Other race 10 100.0% Not responsible for grandchildrenTwo or more races 54 100.0% Not responsible for grandchildrenHispanic or Latino 39 100.0% Not responsible for grandchildren
Grandparents (60 years and over) Other race 6 100.0% Not responsible for grandchildrenTwo or more races 3 100.0% Not responsible for grandchildrenHispanic or Latino 19 100.0% Not responsible for grandchildren