Races in Marilla, New York (NY) Detailed Stats
Ancestries, Foreign-born residents, place of birth

Recent posts about races in Marilla, New York on our local forum with over 2,400,000 registered users:
 | Plan for Nicklaus-designed golf course stuck in the rough amid city opposition (3 replies) |
| Potential Relocation to Buffalo Area (9 replies) |
| What are the "northtowns" and what are the "southtowns"? (23 replies) |
| What is going on in Hamburg? (28 replies) |
| Save cheektowaga (93 replies) |
| 60 K per year make it? (11 replies) |
2.0% of Marilla, NY residents are foreign-born (1.5% born in Europe, 0.3% born in North America), which is 973.5% less than the foreign-born rate of 22.0% across the entire state of New York.
Race distribution in Marilla

- 5,63498.7%White alone
- 260.5%Hispanic
- 220.4%Two or more races
- 90.2%Asian alone
- 60.1%Black alone
- 70.1%Other race alone
- 40.07%American Indian alone
- 10.02%Native Hawaiian and Other
Pacific Islander alone

2000
2022
-
- 11,760,98162.0%White alone
- 2,867,58315.1%Hispanic
- 2,812,62314.8%Black alone
- 1,035,9265.5%Asian alone
- 366,1161.9%Two or more races
- 75,4990.4%Other race alone
- 52,4990.3%American Indian alone
- 5,2300.03%Native Hawaiian and Other
Pacific Islander alone

-
- 10,408,93352.9%White alone
- 3,867,29919.7%Hispanic
- 2,633,84013.4%Black alone
- 1,776,2869.0%Asian alone
- 732,6703.7%Two or more races
- 216,1101.1%Other race alone
- 35,0820.2%American Indian alone
- 6,9310.04%Native Hawaiian and Other
Pacific Islander alone

Income and house value in Marilla
- Median household income in 2022
- $95,040White non-Hispanic householders
- $111,505American Indian and Alaska Native householders
- $145,938Some other race householders
- $139,128Hispanic or Latino race householders
- Median 2022 house value
- $313,077White Non-Hispanic householders
- $415,646American Indian or Alaska Native householders
- $287,755Some other race householders
- $415,646Hispanic or Latino householders
Household income for White non-Hispanic householders

Household income for American Indian and Alaska Native householders

Household income for Hispanic or Latino race householders

Foreign-born residents in Marilla
117 residents are foreign born (1.5% Europe, 0.3% North America).
| This city: | 2.0% |
| New York: | 20.4% |
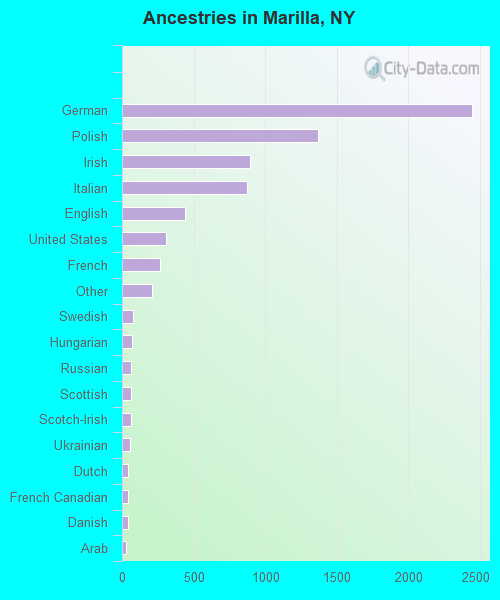
Ancestries in Marilla

- 2,44333.0%German
- 1,36718.4%Polish
- 89612.1%Irish
- 87711.8%Italian
- 4385.9%English
- 3114.2%United States
- 2683.6%French
- 2122.9%Other
- 761.0%Swedish
- 721.0%Hungarian
- 630.9%Russian
- 630.9%Scottish
- 610.8%Scotch-Irish
- 560.8%Ukrainian
- 450.6%Dutch
- 410.6%French Canadian
- 390.5%Danish
- 300.4%Arab
- 140.2%Welsh
- 100.1%Norwegian
- 80.1%Slovak
- 70.09%Subsaharan African
- 70.09%Swiss
- 60.08%Czech
Zip codes: 14052.