Races in Marion, Ohio (OH) Detailed Stats
Data:
Races - White alone (%)
Races - White alone (% change since 2000)
Races - Black alone (%)
Races - Black alone (% change since 2000)
Races - American Indian alone (%)
Races - American Indian alone (% change since 2000)
Races - Asian alone (%)
Races - Asian alone (% change since 2000)
Races - Hispanic (%)
Races - Hispanic (% change since 2000)
Races - Native Hawaiian and Other Pacific Islander alone (%)
Races - Native Hawaiian and Other Pacific Islander alone (% change since 2000)
Races - Two or more races(%)
Races - Two or more races(% change since 2000)
Races - Other race alone (%)
Races - Other race alone (% change since 2000)
Racial diversity
Place of birth - Born in state of residence (%)
Place of birth - Born in state of residence (%) - White
Place of birth - Born in state of residence (%) - Black or African American
Place of birth - Born in state of residence (%) - Asian
Place of birth - Born in state of residence (%) - Hispanic or Latino
Place of birth - Born in state of residence (%) - American Indian and Alaska Native
Place of birth - Born in state of residence (%) - Multirace
Place of birth - Born in state of residence (%) - Other Race
Place of birth - Born in other state (%)
Place of birth - Born in other state (%) - White
Place of birth - Born in other state (%) - Black or African American
Place of birth - Born in other state (%) - Asian
Place of birth - Born in other state (%) - Hispanic or Latino
Place of birth - Born in other state (%) - American Indian and Alaska Native
Place of birth - Born in other state (%) - Multirace
Place of birth - Born in other state (%) - Other Race
Place of birth - Native, outside of US (%)
Place of birth - Native, outside of US (%) - White
Place of birth - Native, outside of US (%) - Black or African American
Place of birth - Native, outside of US (%) - Asian
Place of birth - Native, outside of US (%) - Hispanic or Latino
Place of birth - Native, outside of US (%) - American Indian and Alaska Native
Place of birth - Native, outside of US (%) - Multirace
Place of birth - Native, outside of US (%) - Other Race
Place of birth - Foreign born (%)
Place of birth - Foreign born (%) - White
Place of birth - Foreign born (%) - Black or African American
Place of birth - Foreign born (%) - Asian
Place of birth - Foreign born (%) - Hispanic or Latino
Place of birth - Foreign born (%) - American Indian and Alaska Native
Place of birth - Foreign born (%) - Multirace
Place of birth - Foreign born (%) - Other Race
Residents speaking English at home (%)
Residents speaking English at home - Born in the United States (%)
Residents speaking English at home - Native, born elsewhere (%)
Residents speaking English at home - Foreign born (%)
Residents speaking Spanish at home (%)
Residents speaking Spanish at home - Born in the United States (%)
Residents speaking Spanish at home - Native, born elsewhere (%)
Residents speaking Spanish at home - Foreign born (%)
Residents speaking other language at home (%)
Residents speaking other language at home - Born in the United States (%)
Residents speaking other language at home - Native, born elsewhere (%)
Residents speaking other language at home - Foreign born (%)
Marital status - Never married (%)
Marital status - Now married (%)
Marital status - Separated (%)
Marital status - Widowed (%)
Marital status - Divorced (%)
Ancestries Reported - Arab (%)
Ancestries Reported - Czech (%)
Ancestries Reported - Danish (%)
Ancestries Reported - Dutch (%)
Ancestries Reported - English (%)
Ancestries Reported - French (%)
Ancestries Reported - French Canadian (%)
Ancestries Reported - German (%)
Ancestries Reported - Greek (%)
Ancestries Reported - Hungarian (%)
Ancestries Reported - Irish (%)
Ancestries Reported - Italian (%)
Ancestries Reported - Lithuanian (%)
Ancestries Reported - Norwegian (%)
Ancestries Reported - Polish (%)
Ancestries Reported - Portuguese (%)
Ancestries Reported - Russian (%)
Ancestries Reported - Scotch-Irish (%)
Ancestries Reported - Scottish (%)
Ancestries Reported - Slovak (%)
Ancestries Reported - Subsaharan African (%)
Ancestries Reported - Swedish (%)
Ancestries Reported - Swiss (%)
Ancestries Reported - Ukrainian (%)
Ancestries Reported - United States (%)
Ancestries Reported - Welsh (%)
Ancestries Reported - West Indian (%)
Ancestries Reported - Other (%)
Geographical mobility - Same house 1 year ago (%)
Geographical mobility - Same house 1 year ago (%) - White
Geographical mobility - Same house 1 year ago (%) - Black or African American
Geographical mobility - Same house 1 year ago (%) - Asian
Geographical mobility - Same house 1 year ago (%) - Hispanic or Latino
Geographical mobility - Same house 1 year ago (%) - American Indian and Alaska Native
Geographical mobility - Same house 1 year ago (%) - Multirace
Geographical mobility - Same house 1 year ago (%) - Other Race
Geographical mobility - Moved within same county (%)
Geographical mobility - Moved within same county (%) - White
Geographical mobility - Moved within same county (%) - Black or African American
Geographical mobility - Moved within same county (%) - Asian
Geographical mobility - Moved within same county (%) - Hispanic or Latino
Geographical mobility - Moved within same county (%) - American Indian and Alaska Native
Geographical mobility - Moved within same county (%) - Multirace
Geographical mobility - Moved within same county (%) - Other Race
Geographical mobility - Moved from different county within same state (%)
Geographical mobility - Moved from different county within same state (%) - White
Geographical mobility - Moved from different county within same state (%) - Black or African American
Geographical mobility - Moved from different county within same state (%) - Asian
Geographical mobility - Moved from different county within same state (%) - Hispanic or Latino
Geographical mobility - Moved from different county within same state (%) - American Indian and Alaska Native
Geographical mobility - Moved from different county within same state (%) - Multirace
Geographical mobility - Moved from different county within same state (%) - Other Race
Geographical mobility - Moved from different state (%)
Geographical mobility - Moved from different state (%) - White
Geographical mobility - Moved from different state (%) - Black or African American
Geographical mobility - Moved from different state (%) - Asian
Geographical mobility - Moved from different state (%) - Hispanic or Latino
Geographical mobility - Moved from different state (%) - American Indian and Alaska Native
Geographical mobility - Moved from different state (%) - Multirace
Geographical mobility - Moved from different state (%) - Other Race
Geographical mobility - Moved from abroad (%)
Geographical mobility - Moved from abroad (%) - White
Geographical mobility - Moved from abroad (%) - Black or African American
Geographical mobility - Moved from abroad (%) - Asian
Geographical mobility - Moved from abroad (%) - Hispanic or Latino
Geographical mobility - Moved from abroad (%) - American Indian and Alaska Native
Geographical mobility - Moved from abroad (%) - Multirace
Geographical mobility - Moved from abroad (%) - Other Race
Place of birth for the foreign-born population - Ireland (%)
Place of birth for the foreign-born population - Denmark (%)
Place of birth for the foreign-born population - Norway (%)
Place of birth for the foreign-born population - Sweden (%)
Place of birth for the foreign-born population - United Kingdom (%)
Place of birth for the foreign-born population - England (%)
Place of birth for the foreign-born population - Scotland (%)
Place of birth for the foreign-born population - Other Northern Europe (%)
Place of birth for the foreign-born population - Austria (%)
Place of birth for the foreign-born population - Belgium (%)
Place of birth for the foreign-born population - France (%)
Place of birth for the foreign-born population - Germany (%)
Place of birth for the foreign-born population - Netherlands (%)
Place of birth for the foreign-born population - Switzerland (%)
Place of birth for the foreign-born population - Other Western Europe (%)
Place of birth for the foreign-born population - Greece (%)
Place of birth for the foreign-born population - Italy (%)
Place of birth for the foreign-born population - Portugal (%)
Place of birth for the foreign-born population - Spain (%)
Place of birth for the foreign-born population - Other Southern Europe (%)
Place of birth for the foreign-born population - Albania (%)
Place of birth for the foreign-born population - Belarus (%)
Place of birth for the foreign-born population - Bosnia and Herzegovina (%)
Place of birth for the foreign-born population - Bulgaria (%)
Place of birth for the foreign-born population - Croatia (%)
Place of birth for the foreign-born population - Czechoslovakia (%)
Place of birth for the foreign-born population - Hungary (%)
Place of birth for the foreign-born population - Latvia (%)
Place of birth for the foreign-born population - Lithuania (%)
Place of birth for the foreign-born population - North Macedonia (Macedonia) (%)
Place of birth for the foreign-born population - Moldova (%)
Place of birth for the foreign-born population - Poland (%)
Place of birth for the foreign-born population - Romania (%)
Place of birth for the foreign-born population - Russia (%)
Place of birth for the foreign-born population - Serbia (%)
Place of birth for the foreign-born population - Ukraine (%)
Place of birth for the foreign-born population - Other Eastern Europe (%)
Place of birth for the foreign-born population - China (%)
Place of birth for the foreign-born population - Hong Kong (%)
Place of birth for the foreign-born population - Taiwan (%)
Place of birth for the foreign-born population - Japan (%)
Place of birth for the foreign-born population - Korea (%)
Place of birth for the foreign-born population - Other Eastern Asia (%)
Place of birth for the foreign-born population - Afghanistan (%)
Place of birth for the foreign-born population - Bangladesh (%)
Place of birth for the foreign-born population - India (%)
Place of birth for the foreign-born population - Iran (%)
Place of birth for the foreign-born population - Kazakhstan (%)
Place of birth for the foreign-born population - Nepal (%)
Place of birth for the foreign-born population - Pakistan (%)
Place of birth for the foreign-born population - Sri Lanka (%)
Place of birth for the foreign-born population - Uzbekistan (%)
Place of birth for the foreign-born population - Other South Central Asia (%)
Place of birth for the foreign-born population - Burma (%)
Place of birth for the foreign-born population - Cambodia (%)
Place of birth for the foreign-born population - Indonesia (%)
Place of birth for the foreign-born population - Laos (%)
Place of birth for the foreign-born population - Malaysia (%)
Place of birth for the foreign-born population - Philippines (%)
Place of birth for the foreign-born population - Singapore (%)
Place of birth for the foreign-born population - Thailand (%)
Place of birth for the foreign-born population - Vietnam (%)
Place of birth for the foreign-born population - Other South Eastern Asia (%)
Place of birth for the foreign-born population - Armenia (%)
Place of birth for the foreign-born population - Iraq (%)
Place of birth for the foreign-born population - Israel (%)
Place of birth for the foreign-born population - Jordan (%)
Place of birth for the foreign-born population - Kuwait (%)
Place of birth for the foreign-born population - Lebanon (%)
Place of birth for the foreign-born population - Saudi Arabia (%)
Place of birth for the foreign-born population - Syria (%)
Place of birth for the foreign-born population - Turkey (%)
Place of birth for the foreign-born population - Yemen (%)
Place of birth for the foreign-born population - Other Western Asia (%)
Place of birth for the foreign-born population - Eritrea (%)
Place of birth for the foreign-born population - Ethiopia (%)
Place of birth for the foreign-born population - Kenya (%)
Place of birth for the foreign-born population - Somalia (%)
Place of birth for the foreign-born population - Uganda (%)
Place of birth for the foreign-born population - Zimbabwe (%)
Place of birth for the foreign-born population - Other Eastern Africa (%)
Place of birth for the foreign-born population - Cameroon (%)
Place of birth for the foreign-born population - Congo (%)
Place of birth for the foreign-born population - Democratic Republic of Congo (Zaire) (%)
Place of birth for the foreign-born population - Other Middle Africa (%)
Place of birth for the foreign-born population - Egypt (%)
Place of birth for the foreign-born population - Morocco (%)
Place of birth for the foreign-born population - Sudan (%)
Place of birth for the foreign-born population - Other Northern Africa (%)
Place of birth for the foreign-born population - South Africa (%)
Place of birth for the foreign-born population - Other Southern Africa (%)
Place of birth for the foreign-born population - Cabo Verde (%)
Place of birth for the foreign-born population - Ghana (%)
Place of birth for the foreign-born population - Liberia (%)
Place of birth for the foreign-born population - Nigeria (%)
Place of birth for the foreign-born population - Senegal (%)
Place of birth for the foreign-born population - Sierra Leone (%)
Place of birth for the foreign-born population - Other Western Africa (%)
Place of birth for the foreign-born population - Australia (%)
Place of birth for the foreign-born population - New Zealand (%)
Place of birth for the foreign-born population - Fiji (%)
Place of birth for the foreign-born population - Micronesia (%)
Place of birth for the foreign-born population - Bahamas (%)
Place of birth for the foreign-born population - Barbados (%)
Place of birth for the foreign-born population - Cuba (%)
Place of birth for the foreign-born population - Dominica (%)
Place of birth for the foreign-born population - Dominican Republic (%)
Place of birth for the foreign-born population - Grenada (%)
Place of birth for the foreign-born population - Haiti (%)
Place of birth for the foreign-born population - Jamaica (%)
Place of birth for the foreign-born population - St. Vincent and the Grenadines (%)
Place of birth for the foreign-born population - Trinidad and Tobago (%)
Place of birth for the foreign-born population - West Indies (%)
Place of birth for the foreign-born population - Other Caribbean (%)
Place of birth for the foreign-born population - Belize (%)
Place of birth for the foreign-born population - Costa Rica (%)
Place of birth for the foreign-born population - El Salvador (%)
Place of birth for the foreign-born population - Guatemala (%)
Place of birth for the foreign-born population - Honduras (%)
Place of birth for the foreign-born population - Mexico (%)
Place of birth for the foreign-born population - Nicaragua (%)
Place of birth for the foreign-born population - Panama (%)
Place of birth for the foreign-born population - Other Central America (%)
Place of birth for the foreign-born population - Argentina (%)
Place of birth for the foreign-born population - Bolivia (%)
Place of birth for the foreign-born population - Brazil (%)
Place of birth for the foreign-born population - Chile (%)
Place of birth for the foreign-born population - Colombia (%)
Place of birth for the foreign-born population - Ecuador (%)
Place of birth for the foreign-born population - Guyana (%)
Place of birth for the foreign-born population - Peru (%)
Place of birth for the foreign-born population - Uruguay (%)
Place of birth for the foreign-born population - Venezuela (%)
Place of birth for the foreign-born population - Other South America (%)
Place of birth for the foreign-born population - Canada (%)
Place of birth for the foreign-born population - Other Northern America (%)
Place of birth for the foreign-born population - Other (%)
Latest news about races in Marion, OH collected exclusively by city-data.com from local newspapers, TV, and radio stations
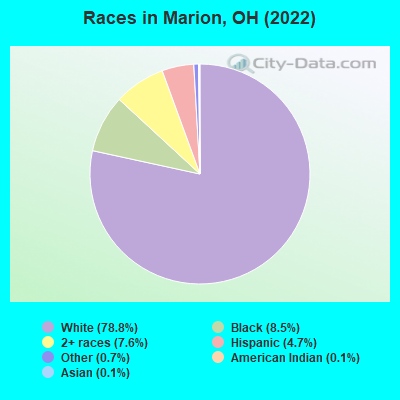
According to 2022 data, the most numerous races in Marion, OH are White alone (28,254 residents), Black alone (3,041 residents), and Two or more races (2,725 residents). 95.3% of Marion residents speak English at home. 1.7% of Marion, OH residents are foreign-born , which is 138.9% less than the foreign-born rate of 4.0% across the entire state of Ohio.
Race distribution in Marion
2000 2022
9,538,111 84.0% White alone 1,290,662 11.4% Black alone 217,123 1.9% Hispanic 137,770 1.2% Two or more races 131,670 1.2% Asian alone 21,985 0.2% American Indian alone 13,483 0.1% Other race alone 2,336 0.02% Native Hawaiian and Other
8,948,793 76.1% White alone 1,401,403 11.9% Black alone 529,291 4.5% Two or more races 517,232 4.4% Hispanic 293,387 2.5% Asian alone 52,805 0.4% Other race alone 9,785 0.08% American Indian alone 3,362 0.03% Native Hawaiian and Other
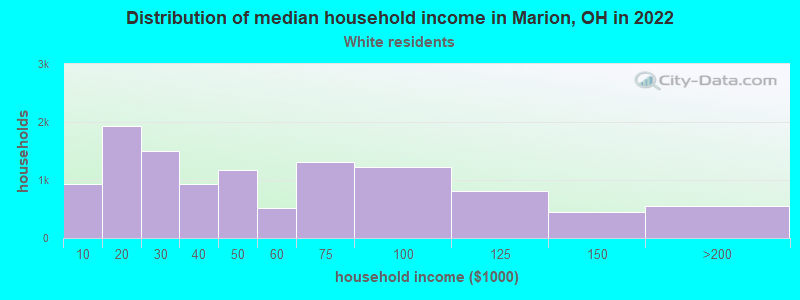
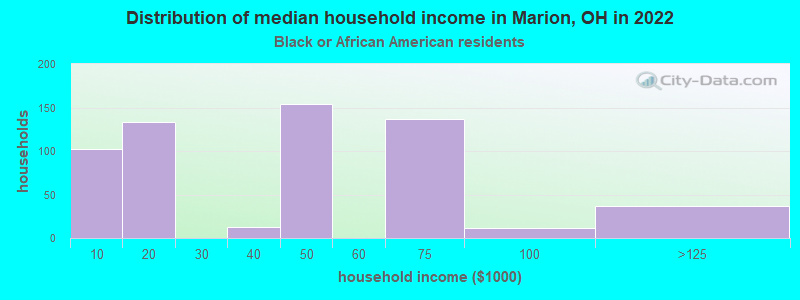
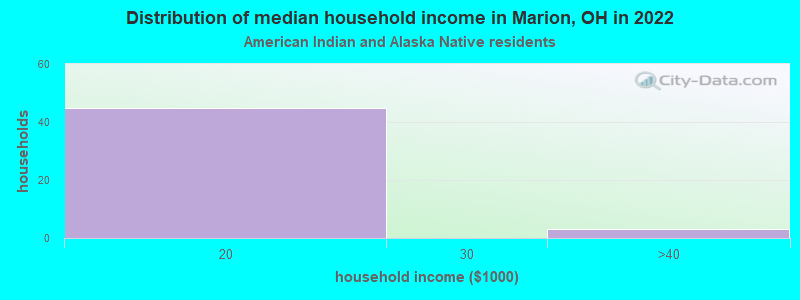
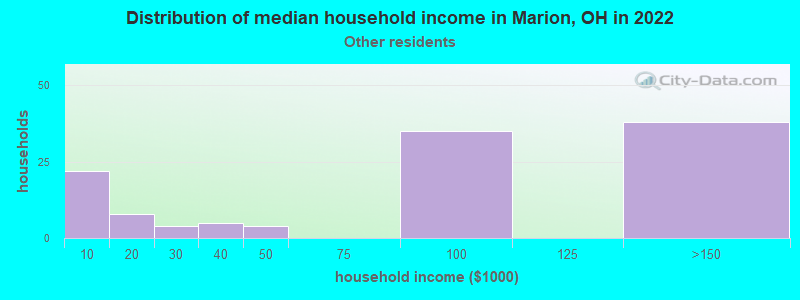
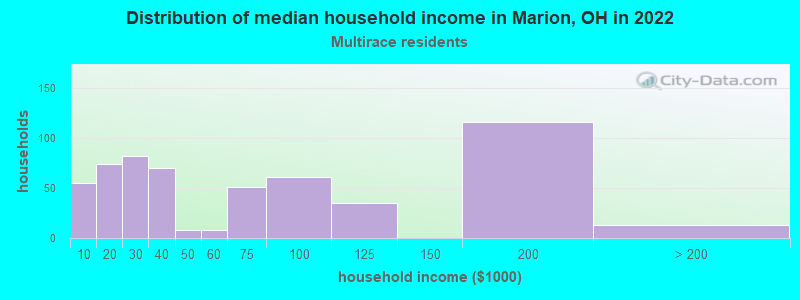
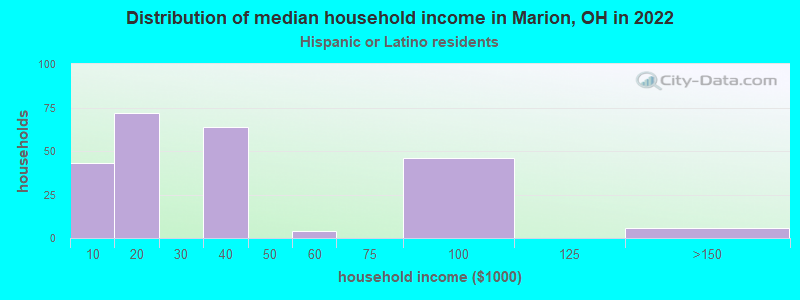
Income and house value in Marion Median household income in 2022 $45,293 White non-Hispanic householders$60,260 Black householders$10,854 American Indian and Alaska Native householders$74,866 Some other race householders$51,992 Two or more races householdersMedian 2022 house value $103,060 White Non-Hispanic householders$99,049 Black or African American householders$115,711 American Indian or Alaska Native householders $192,853 Asian householders$78,838 Some other race householders$81,924 Two or more races householders$83,004 Hispanic or Latino householders
Median age by race in Marion
37.7 Median age for White residents37.8 37.2 41.1 Median age for Black or African American residents39.6 58.0 34.4 Median age for American Indian / Alaska Native residents34.5 58.9 34.3 Median age for Asian residents31.3 34.3 43.0 Median age for Native Hawaiian / Pacific Islander residents40.3 -666,666,666.0 26.4 Median age for Other race residents25.5 37.3 24.2 Median age for Two or more races residents24.2 20.7 37.8 Median age for White alone residents38.0 37.7 26.1 Median age for Hispanic or Latino residents20.4 25.8
Owner/renter occupied households by race in Marion
House owners and renters - White residents 6,365 57.0% Owner occupied4,806 43.0% Renter occupiedHouse owners and renters - Black or African American residents 118 20.1% Owner occupied467 79.9% Renter occupiedHouse owners and renters - American Indian / Alaska Native residents 55 100.0% Renter occupiedHouse owners and renters - Asian residents 4 100.0% Renter occupiedHouse owners and renters - Other race residents 70 53.4% Owner occupied61 46.6% Renter occupiedHouse owners and renters - Two or more races residents 372 42.0% Owner occupied513 58.0% Renter occupiedHouse owners and renters - White alone residents 6,358 57.5% Owner occupied4,702 42.5% Renter occupiedHouse owners and renters - Hispanic or Latino residents 30 13.2% Owner occupied198 86.8% Renter occupied
Language usage in Marion
English speakers - Total 95.3% of residents of Marion speak English at home.
2.8% of residents speak Spanish at home 685 72.8% Speak English very well256 27.2% Speak English less than very well1.7% of residents speak other language at home 453 77.2% Speak English very well134 22.8% Speak English less than very well
English speakers - Born in the United States 95.3% of residents of Marion speak English at home.
3.4% of residents speak Spanish at home 150 76.1% Speak English very well47 23.9% Speak English less than very well1.4% of residents speak other language at home 80 100.0% Speak English very well
English speakers - Native, born elsewhere 74.4% of residents of Marion speak English at home.
26.5% of residents speak Spanish at home 22 35.5% Speak English very well40 64.5% Speak English less than very well
English speakers - Foreign-born 19.0% of residents of Marion speak English at home.
35.1% of residents speak Spanish at home 101 48.3% Speak English very well108 51.7% Speak English less than very well46.1% of residents speak other language at home 176 64.0% Speak English very well99 36.0% Speak English less than very well
White (Caucasian) - Speak only English Native:
98.2% (26,191)Foreign-born:
28.7% (76)
White (Caucasian) - Speak another language Native:
1.9% (495)Foreign-born:
70.5% (187)
Black or African American - Speak another language Native:
5.0% (156)Foreign-born:
97.3% (46)
Other race - Speak only English Native:
70.3% (411)Foreign-born:
18.9% (18)
Other race - Speak another language Native:
28.7% (168)Foreign-born:
77.9% (75)
Two or more races - Speak only English Native:
93.1% (2,642)Foreign-born:
9.2% (10)
Two or more races - Speak another language Native:
6.4% (183)Foreign-born:
92.3% (97)
White alone - Speak only English Native:
98.2% (25,875)Foreign-born:
34.6% (78)
White alone - Speak another language Native:
1.8% (473)Foreign-born:
65.4% (148)
Hispanic or Latino - Speak only English Native:
73.3% (979)Foreign-born:
9.2% (19)
Hispanic or Latino - Speak another language Native:
26.1% (349)Foreign-born:
90.8% (190)
Foreign-born residents in Marion 595 residents are foreign born
Marital status for residents in Marion Marital status - White (Caucasian) population 15 years and over
Males 39.7% Never married35.0% Now married2.7% Separated3.1% Widowed19.5% DivorcedFemales 26.3% Never married38.4% Now married3.7% Separated12.4% Widowed19.2% DivorcedWomen who gave birth in the past 12 months Now married:
52.4% (245)Unmarried:
47.6% (223)
Women who did not give birth in the past 12 months Now married:
40.4% (2,194)Unmarried:
59.6% (3,241)
Marital status - Black or African American population 15 years and over
Males 65.9% Never married13.6% Now married4.0% Separated1.6% Widowed14.9% DivorcedFemales 29.8% Never married25.7% Now married1.6% Separated9.6% Widowed33.3% DivorcedWomen who gave birth in the past 12 months Now married:
100.0% (11)Unmarried:
0.0% (0)
Women who did not give birth in the past 12 months Now married:
0.0% (0)Unmarried:
100.0% (286)
Marital status - American Indian / Alaska Native population 15 years and over
Males 53.7% Never married30.5% Now married0.0% Separated0.0% Widowed15.8% DivorcedFemales 7.7% Never married30.8% Now married0.0% Separated61.5% Widowed0.0% DivorcedWomen who did not give birth in the past 12 months Now married:
0.0% (0)Unmarried:
100.0% (1)
Marital status - Asian population 15 years and over
Males 0.0% Never married30.0% Now married0.0% Separated0.0% Widowed70.0% DivorcedFemales 0.0% Never married100.0% Now married0.0% Separated0.0% Widowed0.0% DivorcedWomen who did not give birth in the past 12 months Now married:
100.0% (26)Unmarried:
0.0% (0)
Marital status - Other race population 15 years and over
Males 43.9% Never married43.5% Now married3.3% Separated0.0% Widowed9.3% DivorcedFemales 13.4% Never married70.4% Now married0.0% Separated0.0% Widowed16.1% DivorcedWomen who gave birth in the past 12 months Now married:
0.0% (0)Unmarried:
100.0% (12)
Women who did not give birth in the past 12 months Now married:
35.7% (26)Unmarried:
64.3% (48)
Marital status - Two or more races population 15 years and over
Males 59.6% Never married22.9% Now married6.3% Separated1.5% Widowed9.7% DivorcedFemales 61.7% Never married17.7% Now married0.0% Separated7.5% Widowed13.1% DivorcedWomen who gave birth in the past 12 months Now married:
0.0% (0)Unmarried:
100.0% (5)
Women who did not give birth in the past 12 months Now married:
15.4% (87)Unmarried:
84.6% (477)
Marital status - White alone, not Hispanic / Latino population 15 years and over
Males 40.1% Never married34.5% Now married2.8% Separated3.1% Widowed19.5% DivorcedFemales 26.3% Never married38.4% Now married3.8% Separated12.5% Widowed19.1% DivorcedWomen who gave birth in the past 12 months Now married:
54.6% (246)Unmarried:
45.4% (204)
Women who did not give birth in the past 12 months Now married:
40.0% (2,160)Unmarried:
60.0% (3,240)
Marital status - Hispanic or Latino population 15 years and over
Males 32.1% Never married39.4% Now married9.9% Separated2.6% Widowed15.9% DivorcedFemales 38.3% Never married38.6% Now married0.0% Separated0.0% Widowed23.1% DivorcedWomen who gave birth in the past 12 months Now married:
0.0% (0)Unmarried:
100.0% (30)
Women who did not give birth in the past 12 months Now married:
50.5% (101)Unmarried:
49.5% (99)
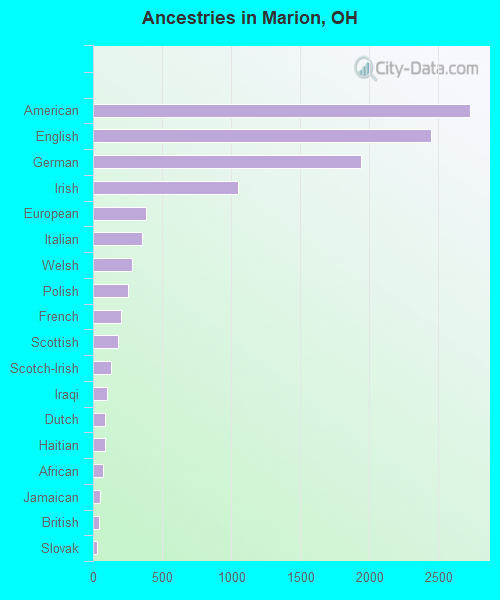
Ancestries in Marion
2,732 17.9% American2,450 16.1% English1,943 12.7% German1,052 6.9% Irish384 2.5% European357 2.3% Italian282 1.9% Welsh256 1.7% Polish200 1.3% French183 1.2% Scottish133 0.9% Scotch-Irish105 0.7% Iraqi84 0.6% Dutch84 0.6% Haitian75 0.5% African49 0.3% Jamaican45 0.3% British28 0.2% Slovak21 0.1% Greek19 0.1% Czechoslovakian17 0.1% Danish16 0.1% Lithuanian15 0.10% Swedish15 0.10% Swiss9 0.06% Czech8 0.05% Austrian7 0.05% Ukrainian6 0.04% Lebanese6 0.04% Ethiopian6 0.04% Nigerian5 0.03% Australian5 0.03% Latvian4 0.03% Jordanian1 0.01% Arab
Geographical mobility in Marion Same house 1 year ago 23,829 84.6% White (Caucasian)1,817 74.5% Black or African American77 58.1% American Indian / Alaska Native41 39.0% Asian611 86.8% Other race2,738 86.0% Two or more races23,593 85.0% White alone, not Hispanic / Latino1,291 80.1% Hispanic or LatinoMoved within same county 2,900 10.3% White / Caucasian223 9.1% Black or African American8 5.9% American Indian / Alaska Native4 3.7% Asian8 1.1% Other race177 5.6% Two or more races2,759 9.9% White alone, not Hispanic / Latino103 6.4% Hispanic or LatinoMoved within same state 991 3.5% White / Caucasian368 15.1% Black or African American33 24.6% American Indian / Alaska Native64 59.8% Asian18 64.5% Native Hawaiian / Pacific Islander83 11.8% Other race234 7.3% Two or more races937 3.4% White alone, not Hispanic / Latino235 14.6% Hispanic or LatinoMoved from different state 342 1.2% White / Caucasian8 0.3% Black or African American1 1.1% American Indian / Alaska Native2 2.3% Asian11 38.2% Native Hawaiian / Pacific Islander13 1.8% Other race13 0.4% Two or more races350 1.3% White alone, not Hispanic / Latino10 0.6% Hispanic or LatinoMoved from abroad 45 0.2% White50 0.2% White alone, not Hispanic / Latino
Children Nativity (place of birth) in Marion
Children under 6 years - Living with two parents Both parents native 1,129 100.0% NativeOne native, one foreign-born parent 45 100.0% NativeChildren under 6 years - Living with one parent Native parent 1,169 100.0% NativeForeign-born parent 11 100.0% NativeChildren 6 to 17 years - Living with two parents Both parents native 1,765 100.0% NativeBoth parents foreign-born 20 59.2% Native14 40.8% Foreign-bornOne native, one foreign-born parent 14 100.0% NativeChildren 6 to 17 years - Living with one parent Native parent 2,541 100.0% NativeForeign-born parent 85 57.8% Native62 42.2% Foreign-born
Grandparents responsible for own grandchildren in Marion
Grandparents (30 to 59 years) White / Caucasian 95 44.3% Responsible for grandchildren120 55.7% Not responsible for grandchildrenOther race 9 53.7% Responsible for grandchildren8 46.3% Not responsible for grandchildrenTwo or more races 11 100.0% Responsible for grandchildrenWhite alone, not Hispanic / Latino 94 43.7% Responsible for grandchildren122 56.3% Not responsible for grandchildrenHispanic or Latino 6 100.0% Not responsible for grandchildrenGrandparents (60 years and over) White / Caucasian 157 54.8% Responsible for grandchildren130 45.2% Not responsible for grandchildrenOther race 9 100.0% Not responsible for grandchildrenWhite alone, not Hispanic / Latino 157 54.6% Responsible for grandchildren131 45.4% Not responsible for grandchildrenHispanic or Latino 10 100.0% Not responsible for grandchildren