Races in Marlboro Meadows, Maryland (MD) Detailed Stats
Data:
Races - White alone (%)
Races - White alone (% change since 2000)
Races - Black alone (%)
Races - Black alone (% change since 2000)
Races - American Indian alone (%)
Races - American Indian alone (% change since 2000)
Races - Asian alone (%)
Races - Asian alone (% change since 2000)
Races - Hispanic (%)
Races - Hispanic (% change since 2000)
Races - Native Hawaiian and Other Pacific Islander alone (%)
Races - Native Hawaiian and Other Pacific Islander alone (% change since 2000)
Races - Two or more races(%)
Races - Two or more races(% change since 2000)
Races - Other race alone (%)
Races - Other race alone (% change since 2000)
Racial diversity
Place of birth - Born in state of residence (%)
Place of birth - Born in state of residence (%) - White
Place of birth - Born in state of residence (%) - Black or African American
Place of birth - Born in state of residence (%) - Asian
Place of birth - Born in state of residence (%) - Hispanic or Latino
Place of birth - Born in state of residence (%) - American Indian and Alaska Native
Place of birth - Born in state of residence (%) - Multirace
Place of birth - Born in state of residence (%) - Other Race
Place of birth - Born in other state (%)
Place of birth - Born in other state (%) - White
Place of birth - Born in other state (%) - Black or African American
Place of birth - Born in other state (%) - Asian
Place of birth - Born in other state (%) - Hispanic or Latino
Place of birth - Born in other state (%) - American Indian and Alaska Native
Place of birth - Born in other state (%) - Multirace
Place of birth - Born in other state (%) - Other Race
Place of birth - Native, outside of US (%)
Place of birth - Native, outside of US (%) - White
Place of birth - Native, outside of US (%) - Black or African American
Place of birth - Native, outside of US (%) - Asian
Place of birth - Native, outside of US (%) - Hispanic or Latino
Place of birth - Native, outside of US (%) - American Indian and Alaska Native
Place of birth - Native, outside of US (%) - Multirace
Place of birth - Native, outside of US (%) - Other Race
Place of birth - Foreign born (%)
Place of birth - Foreign born (%) - White
Place of birth - Foreign born (%) - Black or African American
Place of birth - Foreign born (%) - Asian
Place of birth - Foreign born (%) - Hispanic or Latino
Place of birth - Foreign born (%) - American Indian and Alaska Native
Place of birth - Foreign born (%) - Multirace
Place of birth - Foreign born (%) - Other Race
Residents speaking English at home (%)
Residents speaking English at home - Born in the United States (%)
Residents speaking English at home - Native, born elsewhere (%)
Residents speaking English at home - Foreign born (%)
Residents speaking Spanish at home (%)
Residents speaking Spanish at home - Born in the United States (%)
Residents speaking Spanish at home - Native, born elsewhere (%)
Residents speaking Spanish at home - Foreign born (%)
Residents speaking other language at home (%)
Residents speaking other language at home - Born in the United States (%)
Residents speaking other language at home - Native, born elsewhere (%)
Residents speaking other language at home - Foreign born (%)
Marital status - Never married (%)
Marital status - Now married (%)
Marital status - Separated (%)
Marital status - Widowed (%)
Marital status - Divorced (%)
Ancestries Reported - Arab (%)
Ancestries Reported - Czech (%)
Ancestries Reported - Danish (%)
Ancestries Reported - Dutch (%)
Ancestries Reported - English (%)
Ancestries Reported - French (%)
Ancestries Reported - French Canadian (%)
Ancestries Reported - German (%)
Ancestries Reported - Greek (%)
Ancestries Reported - Hungarian (%)
Ancestries Reported - Irish (%)
Ancestries Reported - Italian (%)
Ancestries Reported - Lithuanian (%)
Ancestries Reported - Norwegian (%)
Ancestries Reported - Polish (%)
Ancestries Reported - Portuguese (%)
Ancestries Reported - Russian (%)
Ancestries Reported - Scotch-Irish (%)
Ancestries Reported - Scottish (%)
Ancestries Reported - Slovak (%)
Ancestries Reported - Subsaharan African (%)
Ancestries Reported - Swedish (%)
Ancestries Reported - Swiss (%)
Ancestries Reported - Ukrainian (%)
Ancestries Reported - United States (%)
Ancestries Reported - Welsh (%)
Ancestries Reported - West Indian (%)
Ancestries Reported - Other (%)
Geographical mobility - Same house 1 year ago (%)
Geographical mobility - Same house 1 year ago (%) - White
Geographical mobility - Same house 1 year ago (%) - Black or African American
Geographical mobility - Same house 1 year ago (%) - Asian
Geographical mobility - Same house 1 year ago (%) - Hispanic or Latino
Geographical mobility - Same house 1 year ago (%) - American Indian and Alaska Native
Geographical mobility - Same house 1 year ago (%) - Multirace
Geographical mobility - Same house 1 year ago (%) - Other Race
Geographical mobility - Moved within same county (%)
Geographical mobility - Moved within same county (%) - White
Geographical mobility - Moved within same county (%) - Black or African American
Geographical mobility - Moved within same county (%) - Asian
Geographical mobility - Moved within same county (%) - Hispanic or Latino
Geographical mobility - Moved within same county (%) - American Indian and Alaska Native
Geographical mobility - Moved within same county (%) - Multirace
Geographical mobility - Moved within same county (%) - Other Race
Geographical mobility - Moved from different county within same state (%)
Geographical mobility - Moved from different county within same state (%) - White
Geographical mobility - Moved from different county within same state (%) - Black or African American
Geographical mobility - Moved from different county within same state (%) - Asian
Geographical mobility - Moved from different county within same state (%) - Hispanic or Latino
Geographical mobility - Moved from different county within same state (%) - American Indian and Alaska Native
Geographical mobility - Moved from different county within same state (%) - Multirace
Geographical mobility - Moved from different county within same state (%) - Other Race
Geographical mobility - Moved from different state (%)
Geographical mobility - Moved from different state (%) - White
Geographical mobility - Moved from different state (%) - Black or African American
Geographical mobility - Moved from different state (%) - Asian
Geographical mobility - Moved from different state (%) - Hispanic or Latino
Geographical mobility - Moved from different state (%) - American Indian and Alaska Native
Geographical mobility - Moved from different state (%) - Multirace
Geographical mobility - Moved from different state (%) - Other Race
Geographical mobility - Moved from abroad (%)
Geographical mobility - Moved from abroad (%) - White
Geographical mobility - Moved from abroad (%) - Black or African American
Geographical mobility - Moved from abroad (%) - Asian
Geographical mobility - Moved from abroad (%) - Hispanic or Latino
Geographical mobility - Moved from abroad (%) - American Indian and Alaska Native
Geographical mobility - Moved from abroad (%) - Multirace
Geographical mobility - Moved from abroad (%) - Other Race
Place of birth for the foreign-born population - Ireland (%)
Place of birth for the foreign-born population - Denmark (%)
Place of birth for the foreign-born population - Norway (%)
Place of birth for the foreign-born population - Sweden (%)
Place of birth for the foreign-born population - United Kingdom (%)
Place of birth for the foreign-born population - England (%)
Place of birth for the foreign-born population - Scotland (%)
Place of birth for the foreign-born population - Other Northern Europe (%)
Place of birth for the foreign-born population - Austria (%)
Place of birth for the foreign-born population - Belgium (%)
Place of birth for the foreign-born population - France (%)
Place of birth for the foreign-born population - Germany (%)
Place of birth for the foreign-born population - Netherlands (%)
Place of birth for the foreign-born population - Switzerland (%)
Place of birth for the foreign-born population - Other Western Europe (%)
Place of birth for the foreign-born population - Greece (%)
Place of birth for the foreign-born population - Italy (%)
Place of birth for the foreign-born population - Portugal (%)
Place of birth for the foreign-born population - Spain (%)
Place of birth for the foreign-born population - Other Southern Europe (%)
Place of birth for the foreign-born population - Albania (%)
Place of birth for the foreign-born population - Belarus (%)
Place of birth for the foreign-born population - Bosnia and Herzegovina (%)
Place of birth for the foreign-born population - Bulgaria (%)
Place of birth for the foreign-born population - Croatia (%)
Place of birth for the foreign-born population - Czechoslovakia (%)
Place of birth for the foreign-born population - Hungary (%)
Place of birth for the foreign-born population - Latvia (%)
Place of birth for the foreign-born population - Lithuania (%)
Place of birth for the foreign-born population - North Macedonia (Macedonia) (%)
Place of birth for the foreign-born population - Moldova (%)
Place of birth for the foreign-born population - Poland (%)
Place of birth for the foreign-born population - Romania (%)
Place of birth for the foreign-born population - Russia (%)
Place of birth for the foreign-born population - Serbia (%)
Place of birth for the foreign-born population - Ukraine (%)
Place of birth for the foreign-born population - Other Eastern Europe (%)
Place of birth for the foreign-born population - China (%)
Place of birth for the foreign-born population - Hong Kong (%)
Place of birth for the foreign-born population - Taiwan (%)
Place of birth for the foreign-born population - Japan (%)
Place of birth for the foreign-born population - Korea (%)
Place of birth for the foreign-born population - Other Eastern Asia (%)
Place of birth for the foreign-born population - Afghanistan (%)
Place of birth for the foreign-born population - Bangladesh (%)
Place of birth for the foreign-born population - India (%)
Place of birth for the foreign-born population - Iran (%)
Place of birth for the foreign-born population - Kazakhstan (%)
Place of birth for the foreign-born population - Nepal (%)
Place of birth for the foreign-born population - Pakistan (%)
Place of birth for the foreign-born population - Sri Lanka (%)
Place of birth for the foreign-born population - Uzbekistan (%)
Place of birth for the foreign-born population - Other South Central Asia (%)
Place of birth for the foreign-born population - Burma (%)
Place of birth for the foreign-born population - Cambodia (%)
Place of birth for the foreign-born population - Indonesia (%)
Place of birth for the foreign-born population - Laos (%)
Place of birth for the foreign-born population - Malaysia (%)
Place of birth for the foreign-born population - Philippines (%)
Place of birth for the foreign-born population - Singapore (%)
Place of birth for the foreign-born population - Thailand (%)
Place of birth for the foreign-born population - Vietnam (%)
Place of birth for the foreign-born population - Other South Eastern Asia (%)
Place of birth for the foreign-born population - Armenia (%)
Place of birth for the foreign-born population - Iraq (%)
Place of birth for the foreign-born population - Israel (%)
Place of birth for the foreign-born population - Jordan (%)
Place of birth for the foreign-born population - Kuwait (%)
Place of birth for the foreign-born population - Lebanon (%)
Place of birth for the foreign-born population - Saudi Arabia (%)
Place of birth for the foreign-born population - Syria (%)
Place of birth for the foreign-born population - Turkey (%)
Place of birth for the foreign-born population - Yemen (%)
Place of birth for the foreign-born population - Other Western Asia (%)
Place of birth for the foreign-born population - Eritrea (%)
Place of birth for the foreign-born population - Ethiopia (%)
Place of birth for the foreign-born population - Kenya (%)
Place of birth for the foreign-born population - Somalia (%)
Place of birth for the foreign-born population - Uganda (%)
Place of birth for the foreign-born population - Zimbabwe (%)
Place of birth for the foreign-born population - Other Eastern Africa (%)
Place of birth for the foreign-born population - Cameroon (%)
Place of birth for the foreign-born population - Congo (%)
Place of birth for the foreign-born population - Democratic Republic of Congo (Zaire) (%)
Place of birth for the foreign-born population - Other Middle Africa (%)
Place of birth for the foreign-born population - Egypt (%)
Place of birth for the foreign-born population - Morocco (%)
Place of birth for the foreign-born population - Sudan (%)
Place of birth for the foreign-born population - Other Northern Africa (%)
Place of birth for the foreign-born population - South Africa (%)
Place of birth for the foreign-born population - Other Southern Africa (%)
Place of birth for the foreign-born population - Cabo Verde (%)
Place of birth for the foreign-born population - Ghana (%)
Place of birth for the foreign-born population - Liberia (%)
Place of birth for the foreign-born population - Nigeria (%)
Place of birth for the foreign-born population - Senegal (%)
Place of birth for the foreign-born population - Sierra Leone (%)
Place of birth for the foreign-born population - Other Western Africa (%)
Place of birth for the foreign-born population - Australia (%)
Place of birth for the foreign-born population - New Zealand (%)
Place of birth for the foreign-born population - Fiji (%)
Place of birth for the foreign-born population - Micronesia (%)
Place of birth for the foreign-born population - Bahamas (%)
Place of birth for the foreign-born population - Barbados (%)
Place of birth for the foreign-born population - Cuba (%)
Place of birth for the foreign-born population - Dominica (%)
Place of birth for the foreign-born population - Dominican Republic (%)
Place of birth for the foreign-born population - Grenada (%)
Place of birth for the foreign-born population - Haiti (%)
Place of birth for the foreign-born population - Jamaica (%)
Place of birth for the foreign-born population - St. Vincent and the Grenadines (%)
Place of birth for the foreign-born population - Trinidad and Tobago (%)
Place of birth for the foreign-born population - West Indies (%)
Place of birth for the foreign-born population - Other Caribbean (%)
Place of birth for the foreign-born population - Belize (%)
Place of birth for the foreign-born population - Costa Rica (%)
Place of birth for the foreign-born population - El Salvador (%)
Place of birth for the foreign-born population - Guatemala (%)
Place of birth for the foreign-born population - Honduras (%)
Place of birth for the foreign-born population - Mexico (%)
Place of birth for the foreign-born population - Nicaragua (%)
Place of birth for the foreign-born population - Panama (%)
Place of birth for the foreign-born population - Other Central America (%)
Place of birth for the foreign-born population - Argentina (%)
Place of birth for the foreign-born population - Bolivia (%)
Place of birth for the foreign-born population - Brazil (%)
Place of birth for the foreign-born population - Chile (%)
Place of birth for the foreign-born population - Colombia (%)
Place of birth for the foreign-born population - Ecuador (%)
Place of birth for the foreign-born population - Guyana (%)
Place of birth for the foreign-born population - Peru (%)
Place of birth for the foreign-born population - Uruguay (%)
Place of birth for the foreign-born population - Venezuela (%)
Place of birth for the foreign-born population - Other South America (%)
Place of birth for the foreign-born population - Canada (%)
Place of birth for the foreign-born population - Other Northern America (%)
Place of birth for the foreign-born population - Other (%)
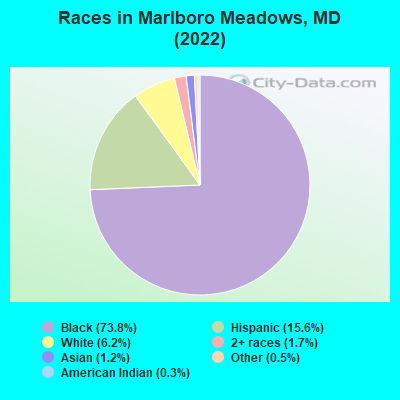
According to 2022 data, the most numerous races in Marlboro Meadows, MD are White alone (231 residents), Black alone (2,742 residents), and Hispanic (580 residents). 82.5% of Marlboro Meadows residents speak English at home.
Race distribution in Marlboro Meadows 2,742 73.8% Black alone 580 15.6% Hispanic 231 6.2% White alone 63 1.7% Two or more races 46 1.2% Asian alone 17 0.5% Other race alone 11 0.3% American Indian alone
2000 2022
3,286,547 62.1% White alone 1,464,735 27.7% Black alone 227,916 4.3% Hispanic 209,738 4.0% Asian alone 82,946 1.6% Two or more races 13,312 0.3% American Indian alone 9,379 0.2% Other race alone 1,913 0.04% Native Hawaiian and Other
2,906,492 47.1% White alone 1,800,914 29.2% Black alone 705,842 11.4% Hispanic 401,818 6.5% Asian alone 291,317 4.7% Two or more races 46,930 0.8% Other race alone 8,930 0.1% American Indian alone 2,417 0.04% Native Hawaiian and Other
Income and house value in Marlboro Meadows Median household income in 2022 $87,114 White non-Hispanic householders$101,295 Black householders$65,418 Two or more races householders
Median age by race in Marlboro Meadows
57.3 Median age for White residents41.5 59.9 47.1 Median age for Black or African American residents48.1 47.7 46.2 Median age for American Indian / Alaska Native residents52.6 -689,905,591.2 48.1 Median age for Asian residents27.0 48.8 -571,600,480.8 Median age for Native Hawaiian / Pacific Islander residents-720,061,021.4 -760,942,760.2 22.9 Median age for Other race residents18.7 35.8 37.5 Median age for Two or more races residents-669,135,801.8 39.9 55.0 Median age for White alone residents39.4 60.2 23.3 Median age for Hispanic or Latino residents19.6 35.6
Owner/renter occupied households by race in Marlboro Meadows
House owners and renters - White residents 92 89.3% Owner occupied11 10.7% Renter occupiedHouse owners and renters - Black or African American residents 1,079 94.3% Owner occupied66 5.7% Renter occupiedHouse owners and renters - Asian residents 16 100.0% Owner occupiedHouse owners and renters - Other race residents 122 84.9% Owner occupied22 15.1% Renter occupiedHouse owners and renters - Two or more races residents 58 79.3% Owner occupied15 20.7% Renter occupiedHouse owners and renters - White alone residents 91 89.1% Owner occupied11 10.9% Renter occupiedHouse owners and renters - Hispanic or Latino residents 132 86.2% Owner occupied21 13.8% Renter occupied
Language usage in Marlboro Meadows
English speakers - Total 82.5% of residents of Marlboro Meadows speak English at home.
13.0% of residents speak Spanish at home 208 44.3% Speak English very well262 55.7% Speak English less than very well2.2% of residents speak other language at home 70 86.4% Speak English very well11 13.6% Speak English less than very well
English speakers - Born in the United States 90.0% of residents of Marlboro Meadows speak English at home.
9.2% of residents speak Spanish at home 169 100.0% Speak English very well0.4% of residents speak other language at home 7 100.0% Speak English very well
All residents speak only English at home
English speakers - Foreign-born 13.7% of residents of Marlboro Meadows speak English at home.
66.1% of residents speak Spanish at home 18 7.3% Speak English very well228 92.7% Speak English less than very well19.9% of residents speak other language at home 63 85.1% Speak English very well11 14.9% Speak English less than very well
White (Caucasian) - Speak another language Native:
10.4% (25)Foreign-born:
90.7% (9)
Black or African American - Speak only English Native:
99.3% (2,518)Foreign-born:
38.9% (14)
Black or African American - Speak another language Native:
0.3% (6)Foreign-born:
60.9% (22)
Asian - Speak only English Native:
78.1% (5)Foreign-born:
11.6% (5)
Other race - Speak only English Native:
5.8% (12)Foreign-born:
10.4% (28)
Other race - Speak another language Native:
92.6% (191)Foreign-born:
88.4% (241)
White alone - Speak another language Native:
7.2% (15)Foreign-born:
98.2% (7)
Hispanic or Latino - Speak only English Native:
31.3% (96)Foreign-born:
9.8% (27)
Hispanic or Latino - Speak another language Native:
69.4% (213)Foreign-born:
89.0% (246)
Foreign-born residents in Marlboro Meadows
Marital status for residents in Marlboro Meadows Marital status - White (Caucasian) population 15 years and over
Males 29.1% Never married53.8% Now married6.8% Separated0.0% Widowed10.3% DivorcedFemales 4.5% Never married62.9% Now married0.0% Separated32.6% Widowed0.0% DivorcedWomen who gave birth in the past 12 months Now married:
100.0% (5)Unmarried:
0.0% (0)
Women who did not give birth in the past 12 months Now married:
72.2% (11)Unmarried:
27.8% (4)
Marital status - Black or African American population 15 years and over
Males 36.3% Never married45.5% Now married4.4% Separated3.2% Widowed10.7% DivorcedFemales 49.9% Never married26.1% Now married3.1% Separated7.2% Widowed13.7% DivorcedWomen who gave birth in the past 12 months Now married:
6.1% (2)Unmarried:
93.9% (29)
Women who did not give birth in the past 12 months Now married:
24.2% (159)Unmarried:
75.8% (498)
Marital status - Asian population 15 years and over
Males 36.8% Never married63.2% Now married0.0% Separated0.0% Widowed0.0% DivorcedFemales 39.1% Never married60.9% Now married0.0% Separated0.0% Widowed0.0% DivorcedWomen who did not give birth in the past 12 months Now married:
40.0% (6)Unmarried:
60.0% (9)
Marital status - Other race population 15 years and over
Males 81.1% Never married18.9% Now married0.0% Separated0.0% Widowed0.0% DivorcedFemales 54.9% Never married15.6% Now married9.0% Separated20.5% Widowed0.0% DivorcedWomen who did not give birth in the past 12 months Now married:
30.9% (67)Unmarried:
69.1% (149)
Marital status - Two or more races population 15 years and over
Males 100.0% Never married0.0% Now married0.0% Separated0.0% Widowed0.0% DivorcedFemales 34.9% Never married15.7% Now married9.6% Separated7.2% Widowed32.5% DivorcedWomen who did not give birth in the past 12 months Now married:
24.1% (14)Unmarried:
75.9% (45)
Marital status - White alone, not Hispanic / Latino population 15 years and over
Males 30.4% Never married51.8% Now married7.1% Separated0.0% Widowed10.7% DivorcedFemales 6.1% Never married50.5% Now married0.0% Separated43.4% Widowed0.0% DivorcedWomen who gave birth in the past 12 months Now married:
100.0% (6)Unmarried:
0.0% (0)
Women who did not give birth in the past 12 months Now married:
64.3% (9)Unmarried:
35.7% (5)
Marital status - Hispanic or Latino population 15 years and over
Males 76.3% Never married19.7% Now married0.0% Separated0.0% Widowed4.0% DivorcedFemales 51.9% Never married22.6% Now married7.0% Separated15.9% Widowed2.5% DivorcedWomen who did not give birth in the past 12 months Now married:
28.2% (66)Unmarried:
71.8% (168)
Ancestries in Marlboro Meadows
62 2.5% American42 1.7% Irish19 0.8% European19 0.8% Nigerian15 0.6% English14 0.6% Italian7 0.3% Scottish7 0.3% Jamaican6 0.2% French4 0.2% African
Children Nativity (place of birth) in Marlboro Meadows
Children under 6 years - Living with two parents Both parents native 78 100.0% NativeBoth parents foreign-born 5 100.0% NativeChildren under 6 years - Living with one parent Native parent 107 100.0% NativeChildren 6 to 17 years - Living with two parents Both parents native 145 100.0% Native0 0.0% Foreign-bornBoth parents foreign-born 38 87.5% Native5 12.5% Foreign-bornChildren 6 to 17 years - Living with one parent Native parent 101 66.8% Native50 33.2% Foreign-bornForeign-born parent 87 78.1% Native24 21.9% Foreign-born
Grandparents responsible for own grandchildren in Marlboro Meadows
Grandparents (30 to 59 years) Black or African American 53 49.8% Responsible for grandchildren54 50.2% Not responsible for grandchildrenGrandparents (60 years and over) Black or African American 14 35.1% Responsible for grandchildren26 64.9% Not responsible for grandchildren