Races in Marlboro Village, Maryland (MD) Detailed Stats
Data:
Races - White alone (%)
Races - White alone (% change since 2000)
Races - Black alone (%)
Races - Black alone (% change since 2000)
Races - American Indian alone (%)
Races - American Indian alone (% change since 2000)
Races - Asian alone (%)
Races - Asian alone (% change since 2000)
Races - Hispanic (%)
Races - Hispanic (% change since 2000)
Races - Native Hawaiian and Other Pacific Islander alone (%)
Races - Native Hawaiian and Other Pacific Islander alone (% change since 2000)
Races - Two or more races(%)
Races - Two or more races(% change since 2000)
Races - Other race alone (%)
Races - Other race alone (% change since 2000)
Racial diversity
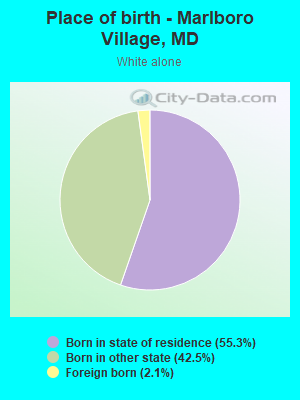
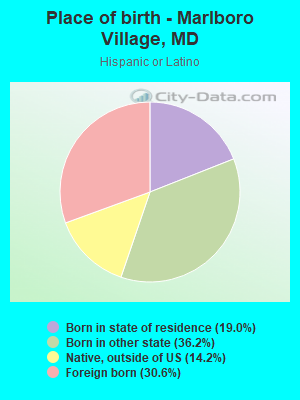
Place of birth - Born in state of residence (%)
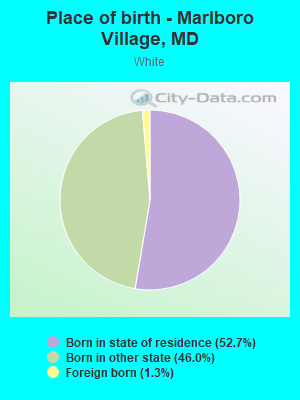
Place of birth - Born in state of residence (%) - White
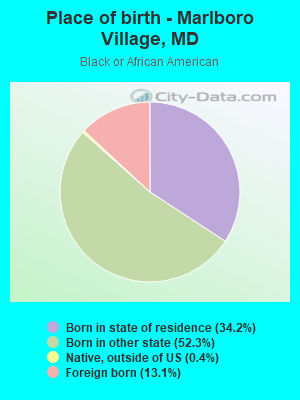
Place of birth - Born in state of residence (%) - Black or African American
Place of birth - Born in state of residence (%) - Asian
Place of birth - Born in state of residence (%) - Hispanic or Latino
Place of birth - Born in state of residence (%) - American Indian and Alaska Native
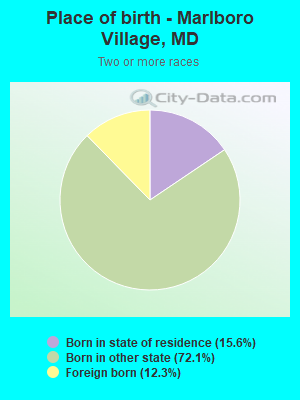
Place of birth - Born in state of residence (%) - Multirace
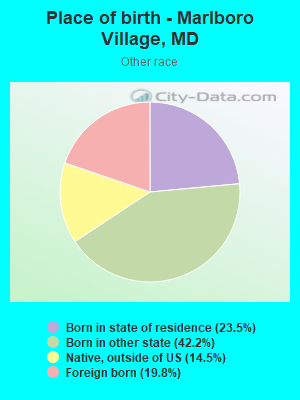
Place of birth - Born in state of residence (%) - Other Race
Place of birth - Born in other state (%)
Place of birth - Born in other state (%) - White
Place of birth - Born in other state (%) - Black or African American
Place of birth - Born in other state (%) - Asian
Place of birth - Born in other state (%) - Hispanic or Latino
Place of birth - Born in other state (%) - American Indian and Alaska Native
Place of birth - Born in other state (%) - Multirace
Place of birth - Born in other state (%) - Other Race
Place of birth - Native, outside of US (%)
Place of birth - Native, outside of US (%) - White
Place of birth - Native, outside of US (%) - Black or African American
Place of birth - Native, outside of US (%) - Asian
Place of birth - Native, outside of US (%) - Hispanic or Latino
Place of birth - Native, outside of US (%) - American Indian and Alaska Native
Place of birth - Native, outside of US (%) - Multirace
Place of birth - Native, outside of US (%) - Other Race
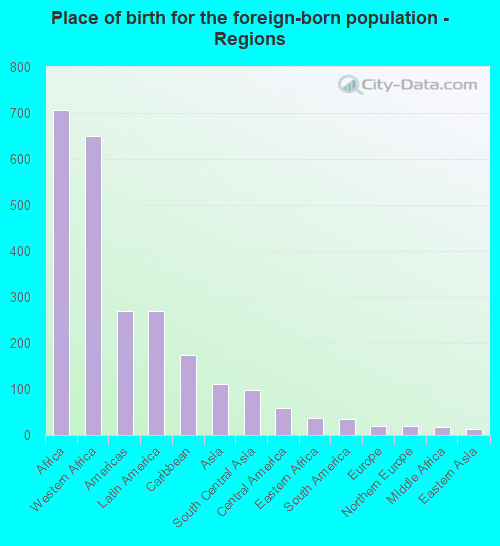
Place of birth - Foreign born (%)
Place of birth - Foreign born (%) - White
Place of birth - Foreign born (%) - Black or African American
Place of birth - Foreign born (%) - Asian
Place of birth - Foreign born (%) - Hispanic or Latino
Place of birth - Foreign born (%) - American Indian and Alaska Native
Place of birth - Foreign born (%) - Multirace
Place of birth - Foreign born (%) - Other Race
Residents speaking English at home (%)
Residents speaking English at home - Born in the United States (%)
Residents speaking English at home - Native, born elsewhere (%)
Residents speaking English at home - Foreign born (%)
Residents speaking Spanish at home (%)
Residents speaking Spanish at home - Born in the United States (%)
Residents speaking Spanish at home - Native, born elsewhere (%)
Residents speaking Spanish at home - Foreign born (%)
Residents speaking other language at home (%)
Residents speaking other language at home - Born in the United States (%)
Residents speaking other language at home - Native, born elsewhere (%)
Residents speaking other language at home - Foreign born (%)
Marital status - Never married (%)
Marital status - Now married (%)
Marital status - Separated (%)
Marital status - Widowed (%)
Marital status - Divorced (%)
Ancestries Reported - Arab (%)
Ancestries Reported - Czech (%)
Ancestries Reported - Danish (%)
Ancestries Reported - Dutch (%)
Ancestries Reported - English (%)
Ancestries Reported - French (%)
Ancestries Reported - French Canadian (%)
Ancestries Reported - German (%)
Ancestries Reported - Greek (%)
Ancestries Reported - Hungarian (%)
Ancestries Reported - Irish (%)
Ancestries Reported - Italian (%)
Ancestries Reported - Lithuanian (%)
Ancestries Reported - Norwegian (%)
Ancestries Reported - Polish (%)
Ancestries Reported - Portuguese (%)
Ancestries Reported - Russian (%)
Ancestries Reported - Scotch-Irish (%)
Ancestries Reported - Scottish (%)
Ancestries Reported - Slovak (%)
Ancestries Reported - Subsaharan African (%)
Ancestries Reported - Swedish (%)
Ancestries Reported - Swiss (%)
Ancestries Reported - Ukrainian (%)
Ancestries Reported - United States (%)
Ancestries Reported - Welsh (%)
Ancestries Reported - West Indian (%)
Ancestries Reported - Other (%)
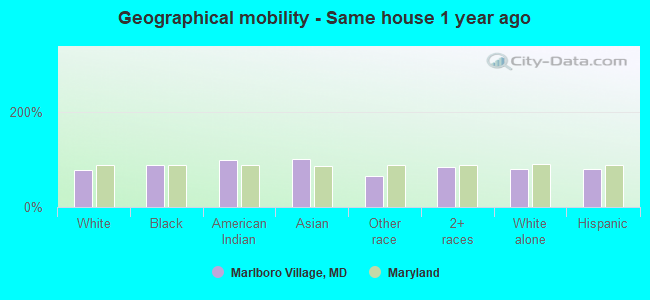
Geographical mobility - Same house 1 year ago (%)
Geographical mobility - Same house 1 year ago (%) - White
Geographical mobility - Same house 1 year ago (%) - Black or African American
Geographical mobility - Same house 1 year ago (%) - Asian
Geographical mobility - Same house 1 year ago (%) - Hispanic or Latino
Geographical mobility - Same house 1 year ago (%) - American Indian and Alaska Native
Geographical mobility - Same house 1 year ago (%) - Multirace
Geographical mobility - Same house 1 year ago (%) - Other Race
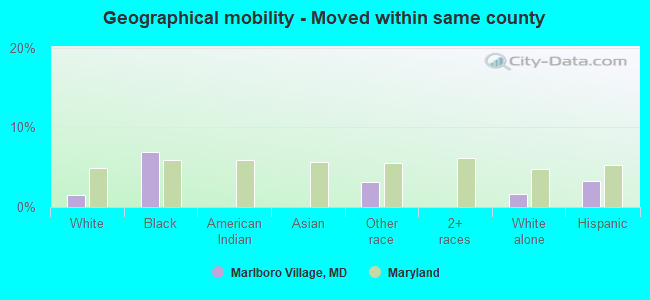
Geographical mobility - Moved within same county (%)
Geographical mobility - Moved within same county (%) - White
Geographical mobility - Moved within same county (%) - Black or African American
Geographical mobility - Moved within same county (%) - Asian
Geographical mobility - Moved within same county (%) - Hispanic or Latino
Geographical mobility - Moved within same county (%) - American Indian and Alaska Native
Geographical mobility - Moved within same county (%) - Multirace
Geographical mobility - Moved within same county (%) - Other Race
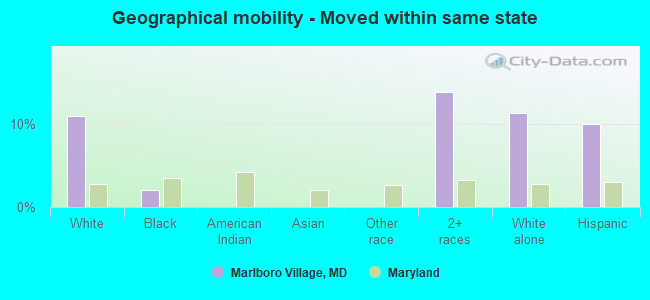
Geographical mobility - Moved from different county within same state (%)
Geographical mobility - Moved from different county within same state (%) - White
Geographical mobility - Moved from different county within same state (%) - Black or African American
Geographical mobility - Moved from different county within same state (%) - Asian
Geographical mobility - Moved from different county within same state (%) - Hispanic or Latino
Geographical mobility - Moved from different county within same state (%) - American Indian and Alaska Native
Geographical mobility - Moved from different county within same state (%) - Multirace
Geographical mobility - Moved from different county within same state (%) - Other Race
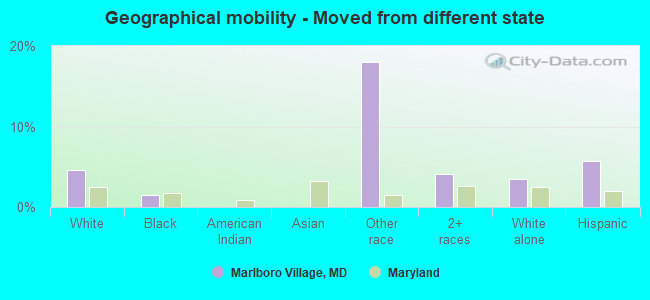
Geographical mobility - Moved from different state (%)
Geographical mobility - Moved from different state (%) - White
Geographical mobility - Moved from different state (%) - Black or African American
Geographical mobility - Moved from different state (%) - Asian
Geographical mobility - Moved from different state (%) - Hispanic or Latino
Geographical mobility - Moved from different state (%) - American Indian and Alaska Native
Geographical mobility - Moved from different state (%) - Multirace
Geographical mobility - Moved from different state (%) - Other Race
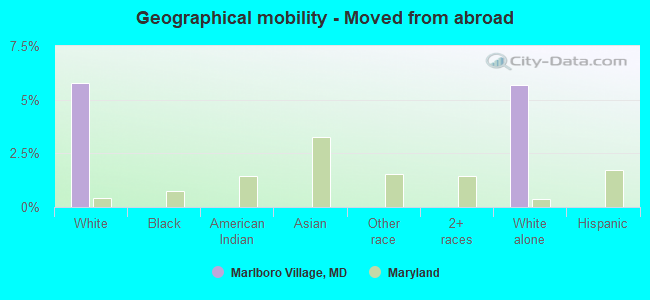
Geographical mobility - Moved from abroad (%)
Geographical mobility - Moved from abroad (%) - White
Geographical mobility - Moved from abroad (%) - Black or African American
Geographical mobility - Moved from abroad (%) - Asian
Geographical mobility - Moved from abroad (%) - Hispanic or Latino
Geographical mobility - Moved from abroad (%) - American Indian and Alaska Native
Geographical mobility - Moved from abroad (%) - Multirace
Geographical mobility - Moved from abroad (%) - Other Race
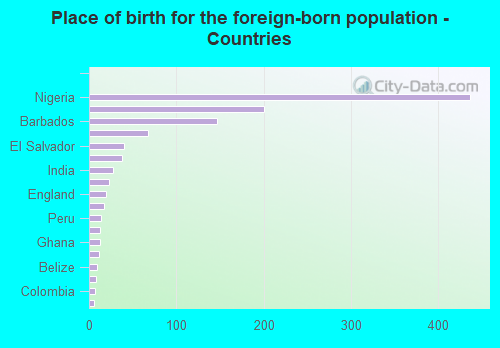
Place of birth for the foreign-born population - Ireland (%)
Place of birth for the foreign-born population - Denmark (%)
Place of birth for the foreign-born population - Norway (%)
Place of birth for the foreign-born population - Sweden (%)
Place of birth for the foreign-born population - United Kingdom (%)
Place of birth for the foreign-born population - England (%)
Place of birth for the foreign-born population - Scotland (%)
Place of birth for the foreign-born population - Other Northern Europe (%)
Place of birth for the foreign-born population - Austria (%)
Place of birth for the foreign-born population - Belgium (%)
Place of birth for the foreign-born population - France (%)
Place of birth for the foreign-born population - Germany (%)
Place of birth for the foreign-born population - Netherlands (%)
Place of birth for the foreign-born population - Switzerland (%)
Place of birth for the foreign-born population - Other Western Europe (%)
Place of birth for the foreign-born population - Greece (%)
Place of birth for the foreign-born population - Italy (%)
Place of birth for the foreign-born population - Portugal (%)
Place of birth for the foreign-born population - Spain (%)
Place of birth for the foreign-born population - Other Southern Europe (%)
Place of birth for the foreign-born population - Albania (%)
Place of birth for the foreign-born population - Belarus (%)
Place of birth for the foreign-born population - Bosnia and Herzegovina (%)
Place of birth for the foreign-born population - Bulgaria (%)
Place of birth for the foreign-born population - Croatia (%)
Place of birth for the foreign-born population - Czechoslovakia (%)
Place of birth for the foreign-born population - Hungary (%)
Place of birth for the foreign-born population - Latvia (%)
Place of birth for the foreign-born population - Lithuania (%)
Place of birth for the foreign-born population - North Macedonia (Macedonia) (%)
Place of birth for the foreign-born population - Moldova (%)
Place of birth for the foreign-born population - Poland (%)
Place of birth for the foreign-born population - Romania (%)
Place of birth for the foreign-born population - Russia (%)
Place of birth for the foreign-born population - Serbia (%)
Place of birth for the foreign-born population - Ukraine (%)
Place of birth for the foreign-born population - Other Eastern Europe (%)
Place of birth for the foreign-born population - China (%)
Place of birth for the foreign-born population - Hong Kong (%)
Place of birth for the foreign-born population - Taiwan (%)
Place of birth for the foreign-born population - Japan (%)
Place of birth for the foreign-born population - Korea (%)
Place of birth for the foreign-born population - Other Eastern Asia (%)
Place of birth for the foreign-born population - Afghanistan (%)
Place of birth for the foreign-born population - Bangladesh (%)
Place of birth for the foreign-born population - India (%)
Place of birth for the foreign-born population - Iran (%)
Place of birth for the foreign-born population - Kazakhstan (%)
Place of birth for the foreign-born population - Nepal (%)
Place of birth for the foreign-born population - Pakistan (%)
Place of birth for the foreign-born population - Sri Lanka (%)
Place of birth for the foreign-born population - Uzbekistan (%)
Place of birth for the foreign-born population - Other South Central Asia (%)
Place of birth for the foreign-born population - Burma (%)
Place of birth for the foreign-born population - Cambodia (%)
Place of birth for the foreign-born population - Indonesia (%)
Place of birth for the foreign-born population - Laos (%)
Place of birth for the foreign-born population - Malaysia (%)
Place of birth for the foreign-born population - Philippines (%)
Place of birth for the foreign-born population - Singapore (%)
Place of birth for the foreign-born population - Thailand (%)
Place of birth for the foreign-born population - Vietnam (%)
Place of birth for the foreign-born population - Other South Eastern Asia (%)
Place of birth for the foreign-born population - Armenia (%)
Place of birth for the foreign-born population - Iraq (%)
Place of birth for the foreign-born population - Israel (%)
Place of birth for the foreign-born population - Jordan (%)
Place of birth for the foreign-born population - Kuwait (%)
Place of birth for the foreign-born population - Lebanon (%)
Place of birth for the foreign-born population - Saudi Arabia (%)
Place of birth for the foreign-born population - Syria (%)
Place of birth for the foreign-born population - Turkey (%)
Place of birth for the foreign-born population - Yemen (%)
Place of birth for the foreign-born population - Other Western Asia (%)
Place of birth for the foreign-born population - Eritrea (%)
Place of birth for the foreign-born population - Ethiopia (%)
Place of birth for the foreign-born population - Kenya (%)
Place of birth for the foreign-born population - Somalia (%)
Place of birth for the foreign-born population - Uganda (%)
Place of birth for the foreign-born population - Zimbabwe (%)
Place of birth for the foreign-born population - Other Eastern Africa (%)
Place of birth for the foreign-born population - Cameroon (%)
Place of birth for the foreign-born population - Congo (%)
Place of birth for the foreign-born population - Democratic Republic of Congo (Zaire) (%)
Place of birth for the foreign-born population - Other Middle Africa (%)
Place of birth for the foreign-born population - Egypt (%)
Place of birth for the foreign-born population - Morocco (%)
Place of birth for the foreign-born population - Sudan (%)
Place of birth for the foreign-born population - Other Northern Africa (%)
Place of birth for the foreign-born population - South Africa (%)
Place of birth for the foreign-born population - Other Southern Africa (%)
Place of birth for the foreign-born population - Cabo Verde (%)
Place of birth for the foreign-born population - Ghana (%)
Place of birth for the foreign-born population - Liberia (%)
Place of birth for the foreign-born population - Nigeria (%)
Place of birth for the foreign-born population - Senegal (%)
Place of birth for the foreign-born population - Sierra Leone (%)
Place of birth for the foreign-born population - Other Western Africa (%)
Place of birth for the foreign-born population - Australia (%)
Place of birth for the foreign-born population - New Zealand (%)
Place of birth for the foreign-born population - Fiji (%)
Place of birth for the foreign-born population - Micronesia (%)
Place of birth for the foreign-born population - Bahamas (%)
Place of birth for the foreign-born population - Barbados (%)
Place of birth for the foreign-born population - Cuba (%)
Place of birth for the foreign-born population - Dominica (%)
Place of birth for the foreign-born population - Dominican Republic (%)
Place of birth for the foreign-born population - Grenada (%)
Place of birth for the foreign-born population - Haiti (%)
Place of birth for the foreign-born population - Jamaica (%)
Place of birth for the foreign-born population - St. Vincent and the Grenadines (%)
Place of birth for the foreign-born population - Trinidad and Tobago (%)
Place of birth for the foreign-born population - West Indies (%)
Place of birth for the foreign-born population - Other Caribbean (%)
Place of birth for the foreign-born population - Belize (%)
Place of birth for the foreign-born population - Costa Rica (%)
Place of birth for the foreign-born population - El Salvador (%)
Place of birth for the foreign-born population - Guatemala (%)
Place of birth for the foreign-born population - Honduras (%)
Place of birth for the foreign-born population - Mexico (%)
Place of birth for the foreign-born population - Nicaragua (%)
Place of birth for the foreign-born population - Panama (%)
Place of birth for the foreign-born population - Other Central America (%)
Place of birth for the foreign-born population - Argentina (%)
Place of birth for the foreign-born population - Bolivia (%)
Place of birth for the foreign-born population - Brazil (%)
Place of birth for the foreign-born population - Chile (%)
Place of birth for the foreign-born population - Colombia (%)
Place of birth for the foreign-born population - Ecuador (%)
Place of birth for the foreign-born population - Guyana (%)
Place of birth for the foreign-born population - Peru (%)
Place of birth for the foreign-born population - Uruguay (%)
Place of birth for the foreign-born population - Venezuela (%)
Place of birth for the foreign-born population - Other South America (%)
Place of birth for the foreign-born population - Canada (%)
Place of birth for the foreign-born population - Other Northern America (%)
Place of birth for the foreign-born population - Other (%)
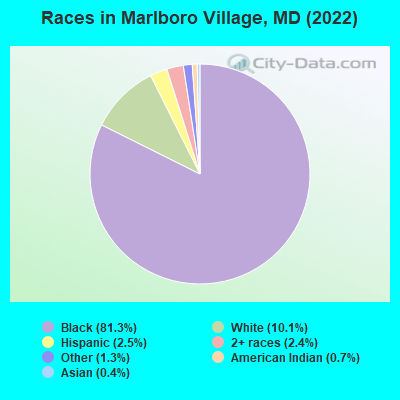
According to 2022 data, the most numerous races in Marlboro Village, MD are White alone (911 residents), Black alone (7,339 residents), and Hispanic (227 residents). 86.7% of Marlboro Village residents speak English at home.
Race distribution in Marlboro Village 7,339 81.3% Black alone 911 10.1% White alone 227 2.5% Hispanic 218 2.4% Two or more races 115 1.3% Other race alone 59 0.7% American Indian alone 38 0.4% Asian alone
2000 2022
3,286,547 62.1% White alone 1,464,735 27.7% Black alone 227,916 4.3% Hispanic 209,738 4.0% Asian alone 82,946 1.6% Two or more races 13,312 0.3% American Indian alone 9,379 0.2% Other race alone 1,913 0.04% Native Hawaiian and Other
2,906,492 47.1% White alone 1,800,914 29.2% Black alone 705,842 11.4% Hispanic 401,818 6.5% Asian alone 291,317 4.7% Two or more races 46,930 0.8% Other race alone 8,930 0.1% American Indian alone 2,417 0.04% Native Hawaiian and Other
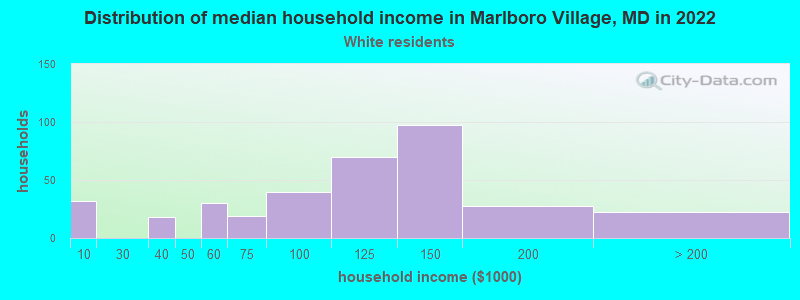
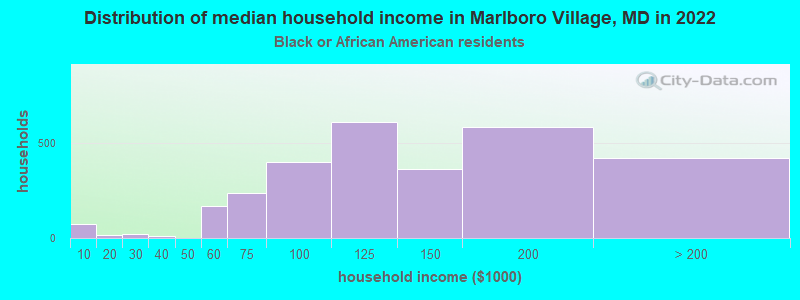
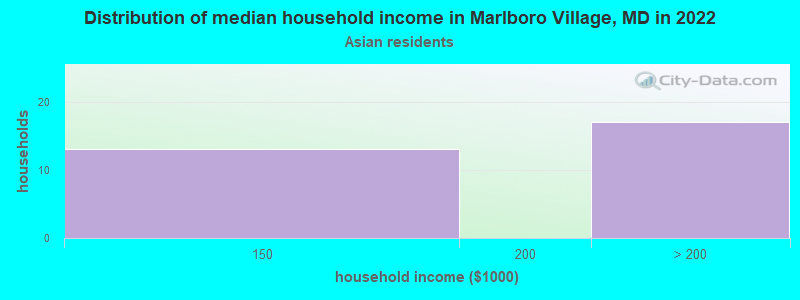
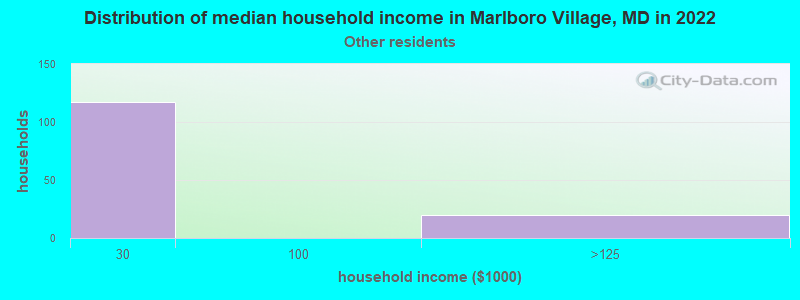
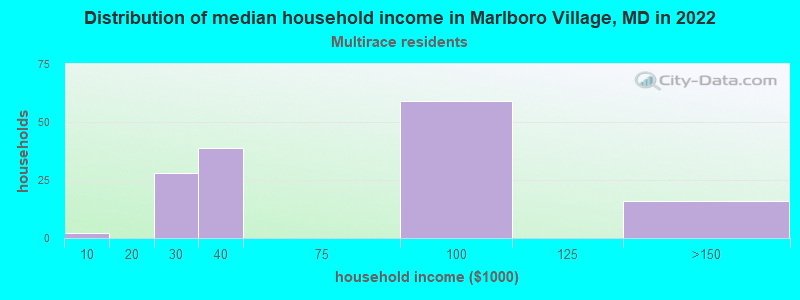
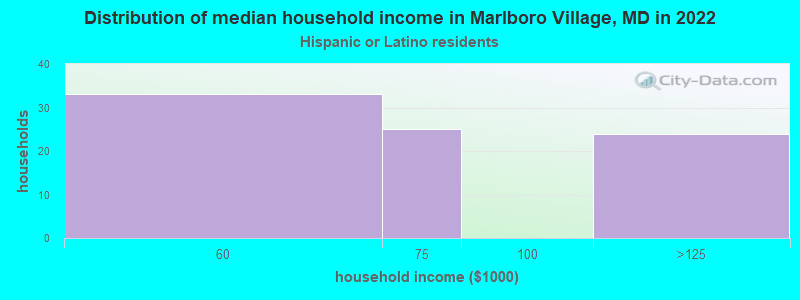
Income and house value in Marlboro Village Median household income in 2022 $110,179 White non-Hispanic householders$118,683 Black householders$65,189 Hispanic or Latino race householders
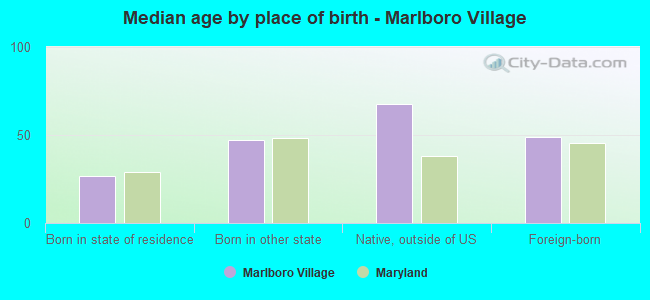
Median age by race in Marlboro Village
41.0 Median age for White residents36.6 52.4 39.2 Median age for Black or African American residents38.4 41.2 -780,410,741.7 Median age for American Indian / Alaska Native residents-888,297,871.5 -689,905,591.2 -707,379,134.2 Median age for Asian residents-668,430,334.4 -716,586,150.7 -571,600,480.8 Median age for Native Hawaiian / Pacific Islander residents-720,061,021.4 -760,942,760.2 54.6 Median age for Other race residents54.6 -678,921,567.9 30.8 Median age for Two or more races residents30.6 36.9 39.1 Median age for White alone residents32.9 50.9 49.5 Median age for Hispanic or Latino residents49.0 55.3
Owner/renter occupied households by race in Marlboro Village
House owners and renters - White residents 144 38.8% Owner occupied227 61.2% Renter occupiedHouse owners and renters - Black or African American residents 2,436 81.6% Owner occupied549 18.4% Renter occupiedHouse owners and renters - Asian residents 47 100.0% Owner occupiedHouse owners and renters - Other race residents 106 100.0% Owner occupiedHouse owners and renters - Two or more races residents 79 60.9% Owner occupied51 39.1% Renter occupiedHouse owners and renters - White alone residents 124 37.4% Owner occupied208 62.6% Renter occupiedHouse owners and renters - Hispanic or Latino residents 61 72.3% Owner occupied24 27.7% Renter occupied
Language usage in Marlboro Village
English speakers - Total 86.7% of residents of Marlboro Village speak English at home.
2.1% of residents speak Spanish at home 128 71.1% Speak English very well52 28.9% Speak English less than very well9.9% of residents speak other language at home 829 95.9% Speak English very well35 4.1% Speak English less than very well
English speakers - Born in the United States 94.0% of residents of Marlboro Village speak English at home.
0.7% of residents speak Spanish at home 33 100.0% Speak English very well5.5% of residents speak other language at home 237 93.3% Speak English very well17 6.7% Speak English less than very well
English speakers - Native, born elsewhere 50.0% of residents of Marlboro Village speak English at home.
90.0% of residents speak Spanish at home 54 100.0% Speak English less than very well
English speakers - Foreign-born 46.4% of residents of Marlboro Village speak English at home.
6.7% of residents speak Spanish at home 51 68.0% Speak English very well24 32.0% Speak English less than very well51.8% of residents speak other language at home 564 97.1% Speak English very well17 2.9% Speak English less than very well
White (Caucasian) - Speak only English Native:
100.0% (928)Foreign-born:
100.0% (12)
Black or African American - Speak only English Native:
95.7% (5,717)Foreign-born:
40.5% (389)
Black or African American - Speak another language Native:
4.3% (259)Foreign-born:
59.1% (566)
Other race - Speak another language Native:
51.1% (89)Foreign-born:
100.0% (42)
Two or more races - Speak another language Native:
4.5% (11)Foreign-born:
100.0% (34)
White alone - Speak only English Native:
99.0% (888)Foreign-born:
100.0% (18)
Hispanic or Latino - Speak another language Native:
67.1% (106)Foreign-born:
100.0% (70)
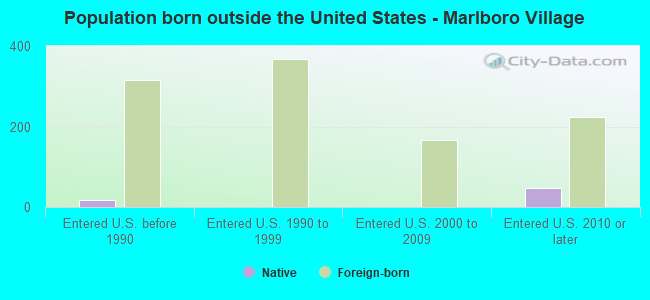
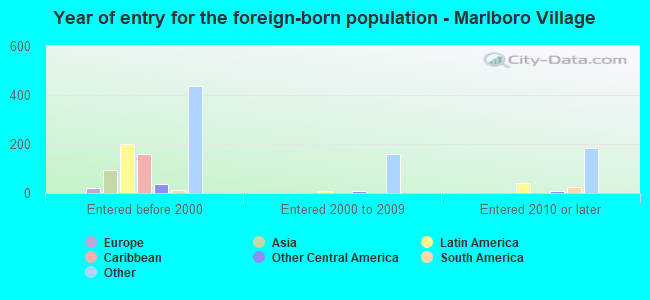
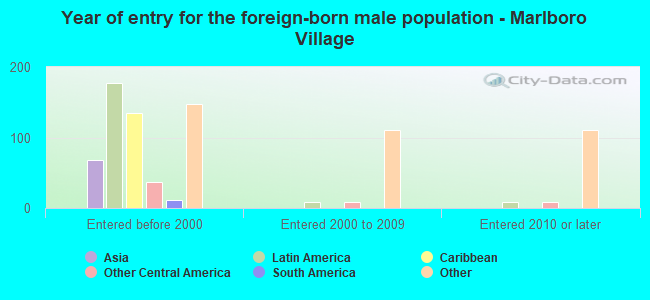
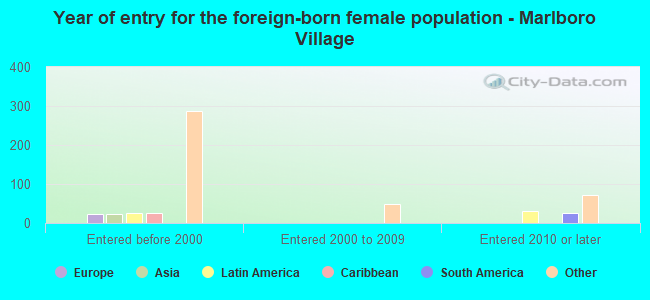
Foreign-born residents in Marlboro Village
Marital status for residents in Marlboro Village Marital status - White (Caucasian) population 15 years and over
Males 48.1% Never married37.6% Now married0.0% Separated0.0% Widowed14.3% DivorcedFemales 38.6% Never married55.0% Now married0.0% Separated6.4% Widowed0.0% DivorcedWomen who did not give birth in the past 12 months Now married:
11.0% (13)Unmarried:
89.0% (104)
Marital status - Black or African American population 15 years and over
Males 50.4% Never married40.1% Now married0.0% Separated2.5% Widowed7.0% DivorcedFemales 41.0% Never married34.1% Now married4.4% Separated5.6% Widowed14.8% DivorcedWomen who gave birth in the past 12 months Now married:
100.0% (116)Unmarried:
0.0% (0)
Women who did not give birth in the past 12 months Now married:
31.6% (546)Unmarried:
68.4% (1,182)
Marital status - American Indian / Alaska Native population 15 years and over
Males 100.0% Never married0.0% Now married0.0% Separated0.0% Widowed0.0% DivorcedFemales 0.0% Never married100.0% Now married0.0% Separated0.0% Widowed0.0% DivorcedMarital status - Asian population 15 years and over
Males 100.0% Never married0.0% Now married0.0% Separated0.0% Widowed0.0% DivorcedFemales 0.0% Never married100.0% Now married0.0% Separated0.0% Widowed0.0% DivorcedMarital status - Other race population 15 years and over
Males 31.2% Never married25.3% Now married0.0% Separated0.0% Widowed43.5% DivorcedFemales 47.1% Never married52.9% Now married0.0% Separated0.0% Widowed0.0% DivorcedWomen who did not give birth in the past 12 months Now married:
0.0% (0)Unmarried:
100.0% (27)
Marital status - Two or more races population 15 years and over
Males 71.0% Never married19.3% Now married0.0% Separated9.7% Widowed0.0% DivorcedFemales 51.4% Never married47.1% Now married0.0% Separated1.4% Widowed0.0% DivorcedWomen who did not give birth in the past 12 months Now married:
41.9% (28)Unmarried:
58.1% (39)
Marital status - White alone, not Hispanic / Latino population 15 years and over
Males 48.6% Never married40.7% Now married0.0% Separated0.0% Widowed10.7% DivorcedFemales 38.6% Never married55.0% Now married0.0% Separated6.4% Widowed0.0% DivorcedWomen who did not give birth in the past 12 months Now married:
11.0% (14)Unmarried:
89.0% (115)
Marital status - Hispanic or Latino population 15 years and over
Males 55.1% Never married25.9% Now married0.0% Separated0.0% Widowed19.0% DivorcedFemales 33.3% Never married66.7% Now married0.0% Separated0.0% Widowed0.0% DivorcedWomen who did not give birth in the past 12 months Now married:
0.0% (0)Unmarried:
100.0% (25)
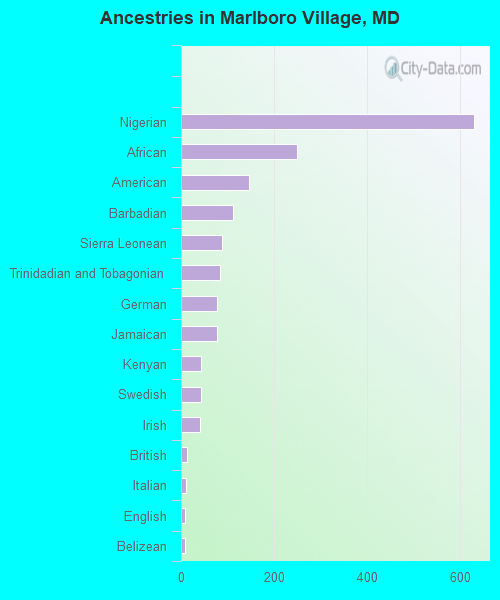
Ancestries in Marlboro Village
630 9.5% Nigerian250 3.8% African146 2.2% American111 1.7% Barbadian87 1.3% Sierra Leonean84 1.3% Trinidadian and Tobagonian78 1.2% German78 1.2% Jamaican43 0.7% Kenyan42 0.6% Swedish41 0.6% Irish12 0.2% British10 0.2% Italian9 0.1% English9 0.1% Belizean
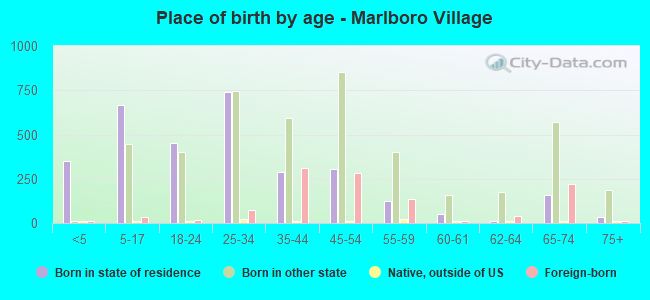
Children Nativity (place of birth) in Marlboro Village
Children under 6 years - Living with two parents Both parents native 297 100.0% NativeBoth parents foreign-born 7 100.0% NativeChildren under 6 years - Living with one parent Native parent 24 100.0% NativeForeign-born parent 76 100.0% NativeChildren 6 to 17 years - Living with two parents Both parents native 366 100.0% Native0 0.0% Foreign-bornBoth parents foreign-born 94 72.6% Native35 27.4% Foreign-bornOne native, one foreign-born parent 205 100.0% NativeChildren 6 to 17 years - Living with one parent Native parent 340 100.0% NativeForeign-born parent 22 51.9% Native20 48.1% Foreign-born
Grandparents responsible for own grandchildren in Marlboro Village
Grandparents (30 to 59 years) Black or African American 13 100.0% Responsible for grandchildrenGrandparents (60 years and over) Black or African American 23 20.8% Responsible for grandchildren89 79.2% Not responsible for grandchildren