Races in Marshall, Missouri (MO) Detailed Stats
Data:
Races - White alone (%)
Races - White alone (% change since 2000)
Races - Black alone (%)
Races - Black alone (% change since 2000)
Races - American Indian alone (%)
Races - American Indian alone (% change since 2000)
Races - Asian alone (%)
Races - Asian alone (% change since 2000)
Races - Hispanic (%)
Races - Hispanic (% change since 2000)
Races - Native Hawaiian and Other Pacific Islander alone (%)
Races - Native Hawaiian and Other Pacific Islander alone (% change since 2000)
Races - Two or more races(%)
Races - Two or more races(% change since 2000)
Races - Other race alone (%)
Races - Other race alone (% change since 2000)
Racial diversity
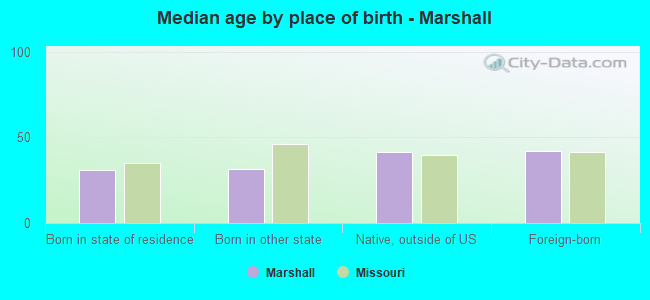
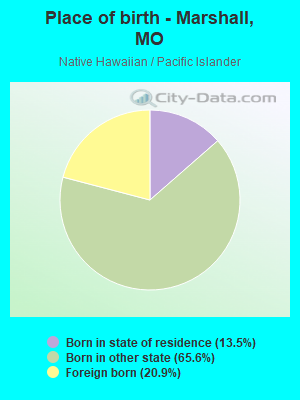
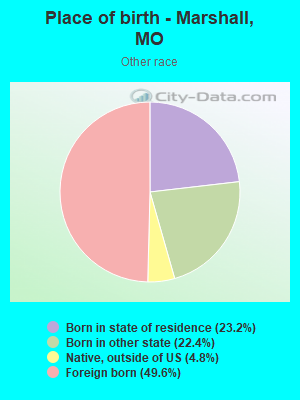
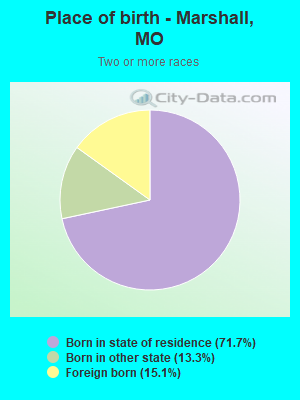
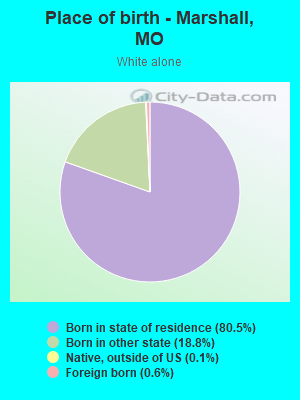
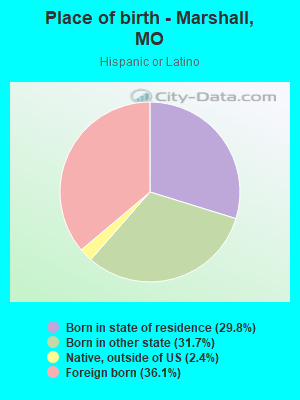
Place of birth - Born in state of residence (%)
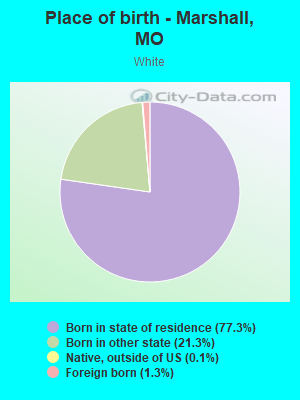
Place of birth - Born in state of residence (%) - White
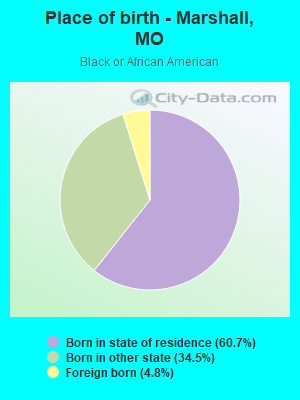
Place of birth - Born in state of residence (%) - Black or African American
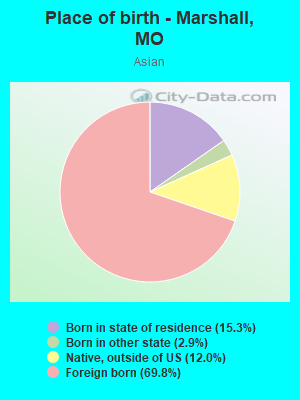
Place of birth - Born in state of residence (%) - Asian
Place of birth - Born in state of residence (%) - Hispanic or Latino
Place of birth - Born in state of residence (%) - American Indian and Alaska Native
Place of birth - Born in state of residence (%) - Multirace
Place of birth - Born in state of residence (%) - Other Race
Place of birth - Born in other state (%)
Place of birth - Born in other state (%) - White
Place of birth - Born in other state (%) - Black or African American
Place of birth - Born in other state (%) - Asian
Place of birth - Born in other state (%) - Hispanic or Latino
Place of birth - Born in other state (%) - American Indian and Alaska Native
Place of birth - Born in other state (%) - Multirace
Place of birth - Born in other state (%) - Other Race
Place of birth - Native, outside of US (%)
Place of birth - Native, outside of US (%) - White
Place of birth - Native, outside of US (%) - Black or African American
Place of birth - Native, outside of US (%) - Asian
Place of birth - Native, outside of US (%) - Hispanic or Latino
Place of birth - Native, outside of US (%) - American Indian and Alaska Native
Place of birth - Native, outside of US (%) - Multirace
Place of birth - Native, outside of US (%) - Other Race
Place of birth - Foreign born (%)
Place of birth - Foreign born (%) - White
Place of birth - Foreign born (%) - Black or African American
Place of birth - Foreign born (%) - Asian
Place of birth - Foreign born (%) - Hispanic or Latino
Place of birth - Foreign born (%) - American Indian and Alaska Native
Place of birth - Foreign born (%) - Multirace
Place of birth - Foreign born (%) - Other Race
Residents speaking English at home (%)
Residents speaking English at home - Born in the United States (%)
Residents speaking English at home - Native, born elsewhere (%)
Residents speaking English at home - Foreign born (%)
Residents speaking Spanish at home (%)
Residents speaking Spanish at home - Born in the United States (%)
Residents speaking Spanish at home - Native, born elsewhere (%)
Residents speaking Spanish at home - Foreign born (%)
Residents speaking other language at home (%)
Residents speaking other language at home - Born in the United States (%)
Residents speaking other language at home - Native, born elsewhere (%)
Residents speaking other language at home - Foreign born (%)
Marital status - Never married (%)
Marital status - Now married (%)
Marital status - Separated (%)
Marital status - Widowed (%)
Marital status - Divorced (%)
Ancestries Reported - Arab (%)
Ancestries Reported - Czech (%)
Ancestries Reported - Danish (%)
Ancestries Reported - Dutch (%)
Ancestries Reported - English (%)
Ancestries Reported - French (%)
Ancestries Reported - French Canadian (%)
Ancestries Reported - German (%)
Ancestries Reported - Greek (%)
Ancestries Reported - Hungarian (%)
Ancestries Reported - Irish (%)
Ancestries Reported - Italian (%)
Ancestries Reported - Lithuanian (%)
Ancestries Reported - Norwegian (%)
Ancestries Reported - Polish (%)
Ancestries Reported - Portuguese (%)
Ancestries Reported - Russian (%)
Ancestries Reported - Scotch-Irish (%)
Ancestries Reported - Scottish (%)
Ancestries Reported - Slovak (%)
Ancestries Reported - Subsaharan African (%)
Ancestries Reported - Swedish (%)
Ancestries Reported - Swiss (%)
Ancestries Reported - Ukrainian (%)
Ancestries Reported - United States (%)
Ancestries Reported - Welsh (%)
Ancestries Reported - West Indian (%)
Ancestries Reported - Other (%)
Geographical mobility - Same house 1 year ago (%)
Geographical mobility - Same house 1 year ago (%) - White
Geographical mobility - Same house 1 year ago (%) - Black or African American
Geographical mobility - Same house 1 year ago (%) - Asian
Geographical mobility - Same house 1 year ago (%) - Hispanic or Latino
Geographical mobility - Same house 1 year ago (%) - American Indian and Alaska Native
Geographical mobility - Same house 1 year ago (%) - Multirace
Geographical mobility - Same house 1 year ago (%) - Other Race
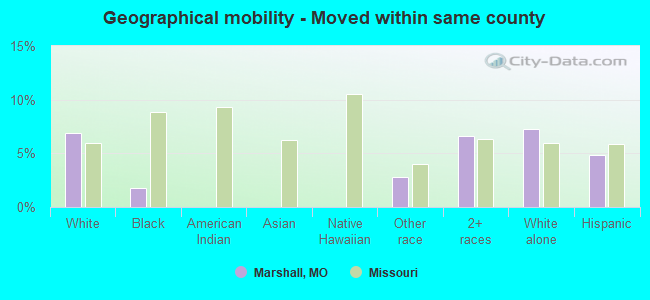
Geographical mobility - Moved within same county (%)
Geographical mobility - Moved within same county (%) - White
Geographical mobility - Moved within same county (%) - Black or African American
Geographical mobility - Moved within same county (%) - Asian
Geographical mobility - Moved within same county (%) - Hispanic or Latino
Geographical mobility - Moved within same county (%) - American Indian and Alaska Native
Geographical mobility - Moved within same county (%) - Multirace
Geographical mobility - Moved within same county (%) - Other Race
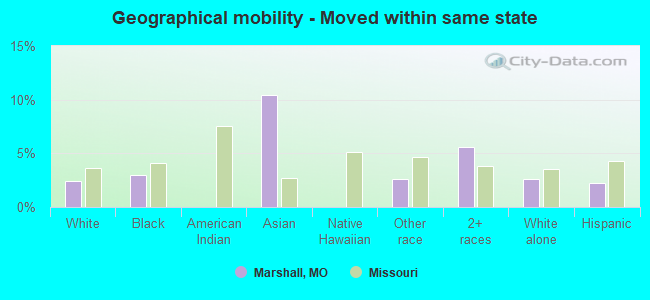
Geographical mobility - Moved from different county within same state (%)
Geographical mobility - Moved from different county within same state (%) - White
Geographical mobility - Moved from different county within same state (%) - Black or African American
Geographical mobility - Moved from different county within same state (%) - Asian
Geographical mobility - Moved from different county within same state (%) - Hispanic or Latino
Geographical mobility - Moved from different county within same state (%) - American Indian and Alaska Native
Geographical mobility - Moved from different county within same state (%) - Multirace
Geographical mobility - Moved from different county within same state (%) - Other Race
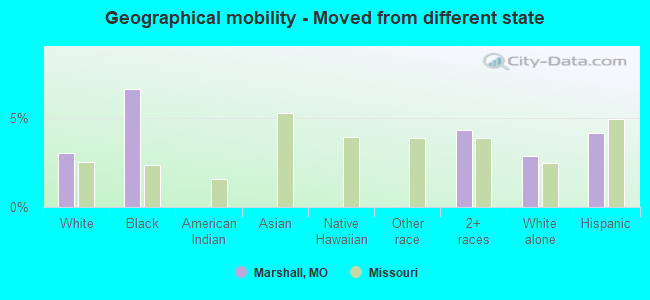
Geographical mobility - Moved from different state (%)
Geographical mobility - Moved from different state (%) - White
Geographical mobility - Moved from different state (%) - Black or African American
Geographical mobility - Moved from different state (%) - Asian
Geographical mobility - Moved from different state (%) - Hispanic or Latino
Geographical mobility - Moved from different state (%) - American Indian and Alaska Native
Geographical mobility - Moved from different state (%) - Multirace
Geographical mobility - Moved from different state (%) - Other Race
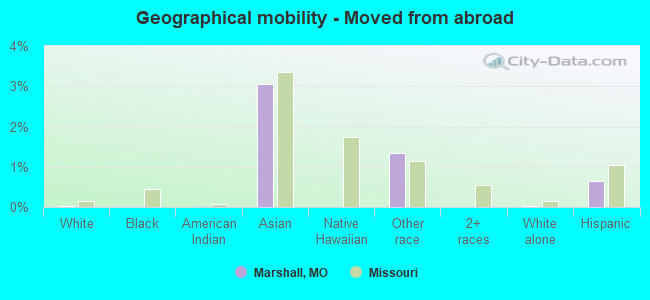
Geographical mobility - Moved from abroad (%)
Geographical mobility - Moved from abroad (%) - White
Geographical mobility - Moved from abroad (%) - Black or African American
Geographical mobility - Moved from abroad (%) - Asian
Geographical mobility - Moved from abroad (%) - Hispanic or Latino
Geographical mobility - Moved from abroad (%) - American Indian and Alaska Native
Geographical mobility - Moved from abroad (%) - Multirace
Geographical mobility - Moved from abroad (%) - Other Race
Place of birth for the foreign-born population - Ireland (%)
Place of birth for the foreign-born population - Denmark (%)
Place of birth for the foreign-born population - Norway (%)
Place of birth for the foreign-born population - Sweden (%)
Place of birth for the foreign-born population - United Kingdom (%)
Place of birth for the foreign-born population - England (%)
Place of birth for the foreign-born population - Scotland (%)
Place of birth for the foreign-born population - Other Northern Europe (%)
Place of birth for the foreign-born population - Austria (%)
Place of birth for the foreign-born population - Belgium (%)
Place of birth for the foreign-born population - France (%)
Place of birth for the foreign-born population - Germany (%)
Place of birth for the foreign-born population - Netherlands (%)
Place of birth for the foreign-born population - Switzerland (%)
Place of birth for the foreign-born population - Other Western Europe (%)
Place of birth for the foreign-born population - Greece (%)
Place of birth for the foreign-born population - Italy (%)
Place of birth for the foreign-born population - Portugal (%)
Place of birth for the foreign-born population - Spain (%)
Place of birth for the foreign-born population - Other Southern Europe (%)
Place of birth for the foreign-born population - Albania (%)
Place of birth for the foreign-born population - Belarus (%)
Place of birth for the foreign-born population - Bosnia and Herzegovina (%)
Place of birth for the foreign-born population - Bulgaria (%)
Place of birth for the foreign-born population - Croatia (%)
Place of birth for the foreign-born population - Czechoslovakia (%)
Place of birth for the foreign-born population - Hungary (%)
Place of birth for the foreign-born population - Latvia (%)
Place of birth for the foreign-born population - Lithuania (%)
Place of birth for the foreign-born population - North Macedonia (Macedonia) (%)
Place of birth for the foreign-born population - Moldova (%)
Place of birth for the foreign-born population - Poland (%)
Place of birth for the foreign-born population - Romania (%)
Place of birth for the foreign-born population - Russia (%)
Place of birth for the foreign-born population - Serbia (%)
Place of birth for the foreign-born population - Ukraine (%)
Place of birth for the foreign-born population - Other Eastern Europe (%)
Place of birth for the foreign-born population - China (%)
Place of birth for the foreign-born population - Hong Kong (%)
Place of birth for the foreign-born population - Taiwan (%)
Place of birth for the foreign-born population - Japan (%)
Place of birth for the foreign-born population - Korea (%)
Place of birth for the foreign-born population - Other Eastern Asia (%)
Place of birth for the foreign-born population - Afghanistan (%)
Place of birth for the foreign-born population - Bangladesh (%)
Place of birth for the foreign-born population - India (%)
Place of birth for the foreign-born population - Iran (%)
Place of birth for the foreign-born population - Kazakhstan (%)
Place of birth for the foreign-born population - Nepal (%)
Place of birth for the foreign-born population - Pakistan (%)
Place of birth for the foreign-born population - Sri Lanka (%)
Place of birth for the foreign-born population - Uzbekistan (%)
Place of birth for the foreign-born population - Other South Central Asia (%)
Place of birth for the foreign-born population - Burma (%)
Place of birth for the foreign-born population - Cambodia (%)
Place of birth for the foreign-born population - Indonesia (%)
Place of birth for the foreign-born population - Laos (%)
Place of birth for the foreign-born population - Malaysia (%)
Place of birth for the foreign-born population - Philippines (%)
Place of birth for the foreign-born population - Singapore (%)
Place of birth for the foreign-born population - Thailand (%)
Place of birth for the foreign-born population - Vietnam (%)
Place of birth for the foreign-born population - Other South Eastern Asia (%)
Place of birth for the foreign-born population - Armenia (%)
Place of birth for the foreign-born population - Iraq (%)
Place of birth for the foreign-born population - Israel (%)
Place of birth for the foreign-born population - Jordan (%)
Place of birth for the foreign-born population - Kuwait (%)
Place of birth for the foreign-born population - Lebanon (%)
Place of birth for the foreign-born population - Saudi Arabia (%)
Place of birth for the foreign-born population - Syria (%)
Place of birth for the foreign-born population - Turkey (%)
Place of birth for the foreign-born population - Yemen (%)
Place of birth for the foreign-born population - Other Western Asia (%)
Place of birth for the foreign-born population - Eritrea (%)
Place of birth for the foreign-born population - Ethiopia (%)
Place of birth for the foreign-born population - Kenya (%)
Place of birth for the foreign-born population - Somalia (%)
Place of birth for the foreign-born population - Uganda (%)
Place of birth for the foreign-born population - Zimbabwe (%)
Place of birth for the foreign-born population - Other Eastern Africa (%)
Place of birth for the foreign-born population - Cameroon (%)
Place of birth for the foreign-born population - Congo (%)
Place of birth for the foreign-born population - Democratic Republic of Congo (Zaire) (%)
Place of birth for the foreign-born population - Other Middle Africa (%)
Place of birth for the foreign-born population - Egypt (%)
Place of birth for the foreign-born population - Morocco (%)
Place of birth for the foreign-born population - Sudan (%)
Place of birth for the foreign-born population - Other Northern Africa (%)
Place of birth for the foreign-born population - South Africa (%)
Place of birth for the foreign-born population - Other Southern Africa (%)
Place of birth for the foreign-born population - Cabo Verde (%)
Place of birth for the foreign-born population - Ghana (%)
Place of birth for the foreign-born population - Liberia (%)
Place of birth for the foreign-born population - Nigeria (%)
Place of birth for the foreign-born population - Senegal (%)
Place of birth for the foreign-born population - Sierra Leone (%)
Place of birth for the foreign-born population - Other Western Africa (%)
Place of birth for the foreign-born population - Australia (%)
Place of birth for the foreign-born population - New Zealand (%)
Place of birth for the foreign-born population - Fiji (%)
Place of birth for the foreign-born population - Micronesia (%)
Place of birth for the foreign-born population - Bahamas (%)
Place of birth for the foreign-born population - Barbados (%)
Place of birth for the foreign-born population - Cuba (%)
Place of birth for the foreign-born population - Dominica (%)
Place of birth for the foreign-born population - Dominican Republic (%)
Place of birth for the foreign-born population - Grenada (%)
Place of birth for the foreign-born population - Haiti (%)
Place of birth for the foreign-born population - Jamaica (%)
Place of birth for the foreign-born population - St. Vincent and the Grenadines (%)
Place of birth for the foreign-born population - Trinidad and Tobago (%)
Place of birth for the foreign-born population - West Indies (%)
Place of birth for the foreign-born population - Other Caribbean (%)
Place of birth for the foreign-born population - Belize (%)
Place of birth for the foreign-born population - Costa Rica (%)
Place of birth for the foreign-born population - El Salvador (%)
Place of birth for the foreign-born population - Guatemala (%)
Place of birth for the foreign-born population - Honduras (%)
Place of birth for the foreign-born population - Mexico (%)
Place of birth for the foreign-born population - Nicaragua (%)
Place of birth for the foreign-born population - Panama (%)
Place of birth for the foreign-born population - Other Central America (%)
Place of birth for the foreign-born population - Argentina (%)
Place of birth for the foreign-born population - Bolivia (%)
Place of birth for the foreign-born population - Brazil (%)
Place of birth for the foreign-born population - Chile (%)
Place of birth for the foreign-born population - Colombia (%)
Place of birth for the foreign-born population - Ecuador (%)
Place of birth for the foreign-born population - Guyana (%)
Place of birth for the foreign-born population - Peru (%)
Place of birth for the foreign-born population - Uruguay (%)
Place of birth for the foreign-born population - Venezuela (%)
Place of birth for the foreign-born population - Other South America (%)
Place of birth for the foreign-born population - Canada (%)
Place of birth for the foreign-born population - Other Northern America (%)
Place of birth for the foreign-born population - Other (%)
Latest news about races in Marshall, MO collected exclusively by city-data.com from local newspapers, TV, and radio stations
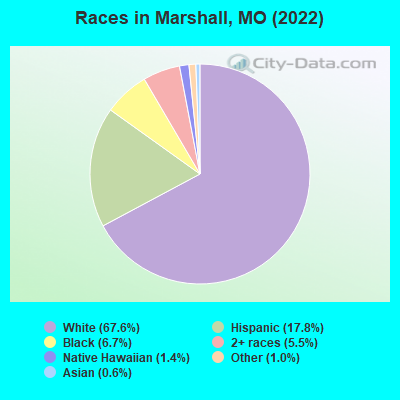
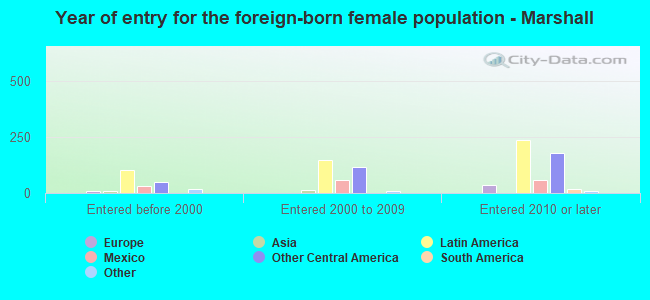
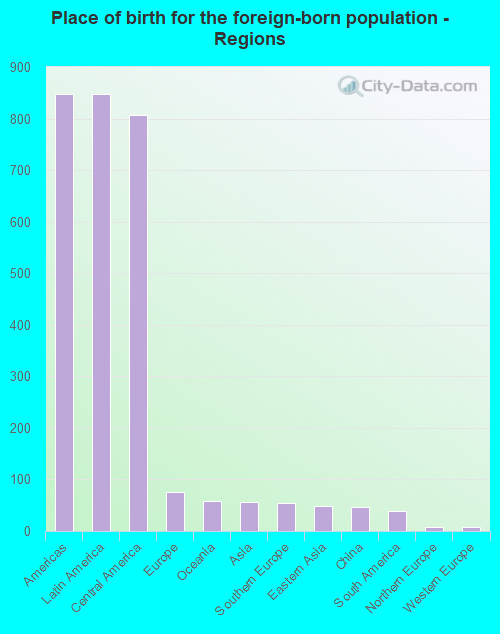
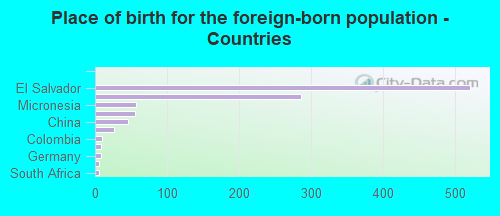
According to 2022 data, the most numerous races in Marshall, MO are White alone (9,290 residents), Black alone (926 residents), and Two or more races (760 residents). 86.9% of Marshall residents speak English at home. 7.6% of Marshall, MO residents are foreign-born (6.3% born in Latin America), which is 47.4% greater than the foreign-born rate of 4.0% across the entire state of Missouri.
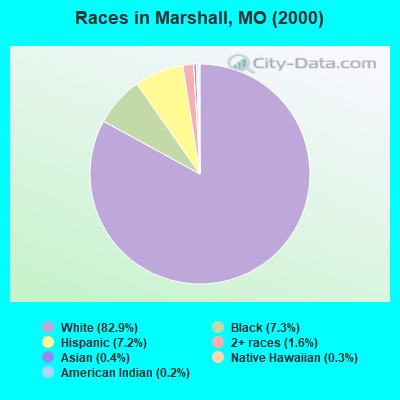
Race distribution in Marshall
2000 2022
4,686,474 83.8% White alone 625,667 11.2% Black alone 118,592 2.1% Hispanic 71,905 1.3% Two or more races 61,041 1.1% Asian alone 23,302 0.4% American Indian alone 5,291 0.09% Other race alone 2,939 0.05% Native Hawaiian and Other
4,733,411 76.6% White alone 656,739 10.6% Black alone 316,300 5.1% Two or more races 291,763 4.7% Hispanic 132,436 2.1% Asian alone 27,467 0.4% Other race alone 12,313 0.2% American Indian alone 7,528 0.1% Native Hawaiian and Other
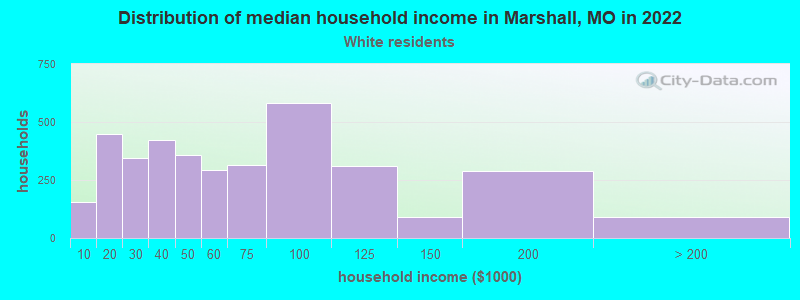
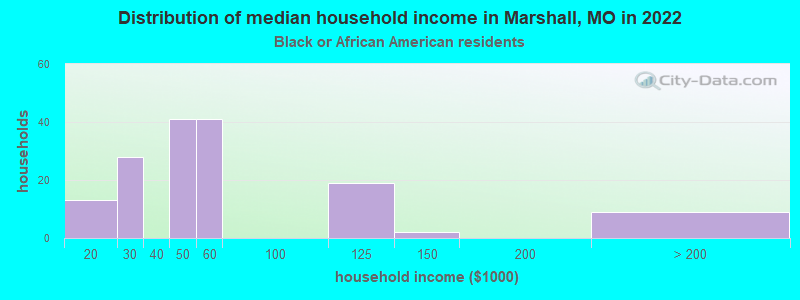
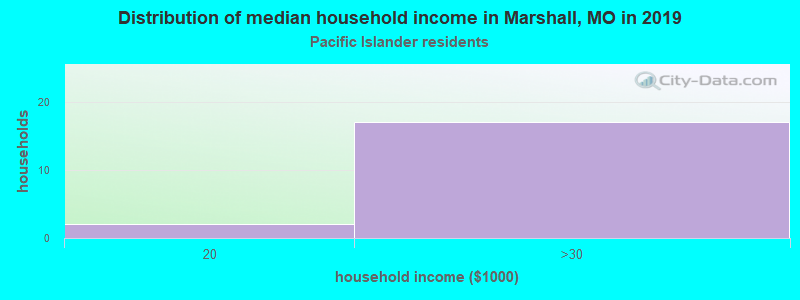
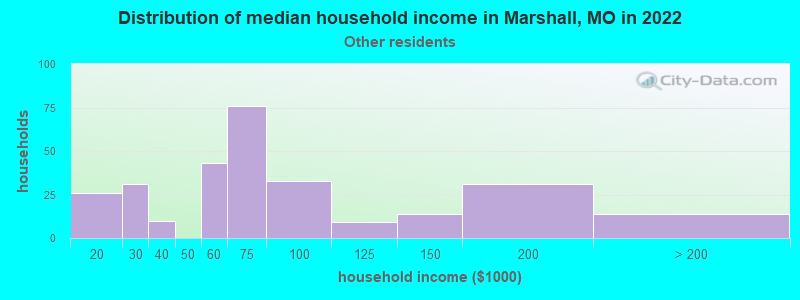
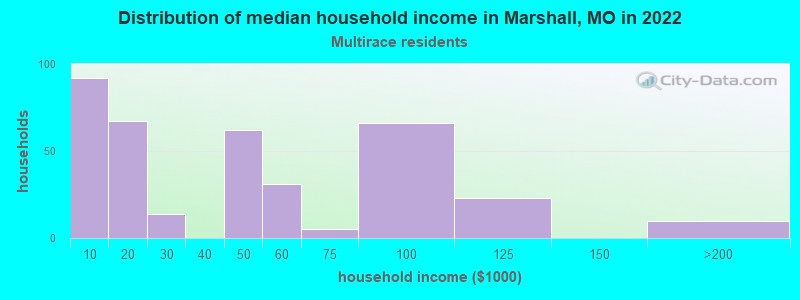
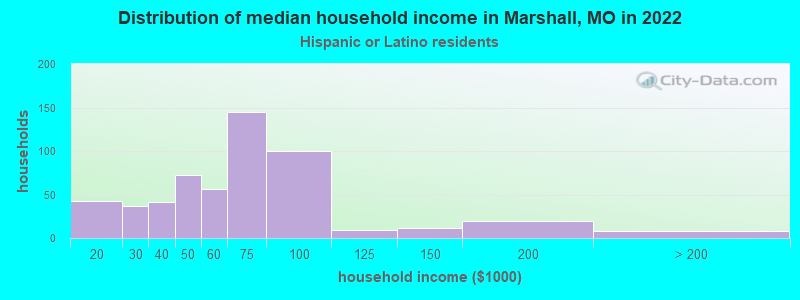
Income and house value in Marshall Median household income in 2022 $51,670 White non-Hispanic householders$48,886 Black householders$32,144 Native Hawaiian and other Pacific Islander householders$71,167 Some other race householders$46,441 Two or more races householders$64,172 Hispanic or Latino race householdersMedian 2022 house value $156,114 White Non-Hispanic householders$70,900 Black or African American householders $131,959 Asian householders$84,096 Some other race householders$138,445 Two or more races householders$86,332 Hispanic or Latino householders
Median age by race in Marshall
38.2 Median age for White residents39.6 37.0 30.6 Median age for Black or African American residents30.8 23.0 -605,424,321.4 Median age for American Indian / Alaska Native residents-652,291,104.5 -576,856,648.8 31.6 Median age for Asian residents31.8 59.3 21.8 Median age for Native Hawaiian / Pacific Islander residents20.3 23.9 26.9 Median age for Other race residents24.0 26.7 22.5 Median age for Two or more races residents26.6 17.3 40.3 Median age for White alone residents41.0 39.1 26.1 Median age for Hispanic or Latino residents27.7 25.2
Owner/renter occupied households by race in Marshall
House owners and renters - White residents 2,600 70.3% Owner occupied1,096 29.7% Renter occupiedHouse owners and renters - Black or African American residents 92 58.6% Owner occupied65 41.4% Renter occupiedHouse owners and renters - Asian residents 12 100.0% Owner occupiedHouse owners and renters - Native Hawaiian / Pacific Islander residents 11 20.7% Owner occupied44 79.3% Renter occupiedHouse owners and renters - Other race residents 260 91.4% Owner occupied24 8.6% Renter occupiedHouse owners and renters - Two or more races residents 112 30.6% Owner occupied253 69.4% Renter occupiedHouse owners and renters - White alone residents 2,439 68.7% Owner occupied1,110 31.3% Renter occupiedHouse owners and renters - Hispanic or Latino residents 457 82.0% Owner occupied100 18.0% Renter occupied
Language usage in Marshall
English speakers - Total 86.9% of residents of Marshall speak English at home.
12.3% of residents speak Spanish at home 710 44.0% Speak English very well903 56.0% Speak English less than very well1.0% of residents speak other language at home 57 44.2% Speak English very well72 55.8% Speak English less than very well
English speakers - Born in the United States 87.7% of residents of Marshall speak English at home.
13.0% of residents speak Spanish at home 346 88.0% Speak English very well47 12.0% Speak English less than very well0.3% of residents speak other language at home 9 100.0% Speak English very well
English speakers - Native, born elsewhere 81.0% of residents of Marshall speak English at home.
12.7% of residents speak Spanish at home 10 100.0% Speak English very well2.5% of residents speak other language at home 2 100.0% Speak English very well
English speakers - Foreign-born 7.4% of residents of Marshall speak English at home.
84.0% of residents speak Spanish at home 162 18.4% Speak English very well717 81.6% Speak English less than very well11.0% of residents speak other language at home 43 37.4% Speak English very well72 62.6% Speak English less than very well
White (Caucasian) - Speak only English Native:
98.1% (9,145)Foreign-born:
27.1% (34)
White (Caucasian) - Speak another language Native:
1.9% (178)Foreign-born:
72.8% (92)
Black or African American - Speak only English Native:
98.2% (896)Foreign-born:
20.2% (9)
Black or African American - Speak another language Native:
1.5% (14)Foreign-born:
79.6% (36)
Asian - Speak only English Native:
69.7% (18)Foreign-born:
3.4% (2)
Asian - Speak another language Native:
32.4% (8)Foreign-born:
96.8% (57)
Other race - Speak only English Native:
28.5% (179)Foreign-born:
7.7% (50)
Other race - Speak another language Native:
63.8% (400)Foreign-born:
89.9% (587)
Two or more races - Speak another language Native:
15.1% (195)Foreign-born:
100.0% (259)
White alone - Speak only English Native:
99.1% (8,834)Foreign-born:
59.2% (35)
White alone - Speak another language Native:
0.8% (73)Foreign-born:
34.6% (20)
Hispanic or Latino - Speak only English Native:
60.3% (877)Foreign-born:
3.6% (32)
Hispanic or Latino - Speak another language Native:
39.3% (570)Foreign-born:
96.0% (848)
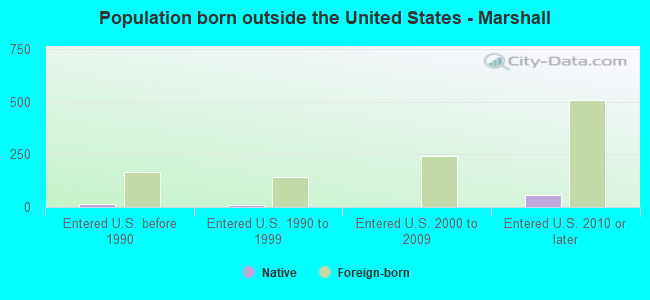
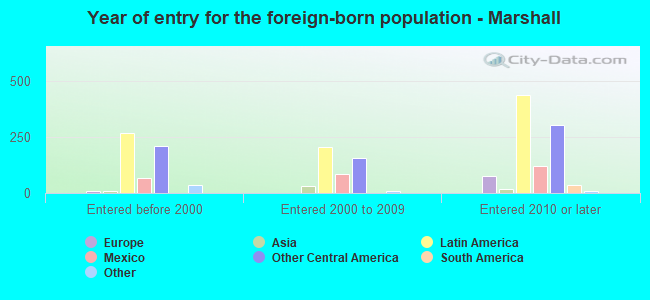
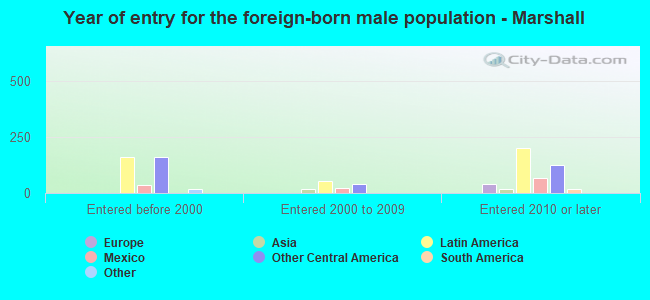
Foreign-born residents in Marshall 1,045 residents are foreign born (6.3% Latin America ).
This city:
7.6%Missouri:
4.2%
Marital status for residents in Marshall Marital status - White (Caucasian) population 15 years and over
Males 43.7% Never married37.9% Now married0.2% Separated5.5% Widowed12.7% DivorcedFemales 34.2% Never married36.8% Now married1.4% Separated7.3% Widowed20.4% DivorcedWomen who gave birth in the past 12 months Now married:
45.3% (33)Unmarried:
54.7% (40)
Women who did not give birth in the past 12 months Now married:
35.3% (836)Unmarried:
64.7% (1,533)
Marital status - Black or African American population 15 years and over
Males 65.0% Never married21.3% Now married0.0% Separated4.7% Widowed9.0% DivorcedFemales 54.3% Never married14.2% Now married0.0% Separated11.9% Widowed19.6% DivorcedWomen who gave birth in the past 12 months Now married:
0.0% (0)Unmarried:
100.0% (22)
Women who did not give birth in the past 12 months Now married:
0.4% (1)Unmarried:
99.6% (209)
Marital status - Asian population 15 years and over
Males 100.0% Never married0.0% Now married0.0% Separated0.0% Widowed0.0% DivorcedFemales 40.6% Never married59.4% Now married0.0% Separated0.0% Widowed0.0% DivorcedWomen who did not give birth in the past 12 months Now married:
0.0% (0)Unmarried:
100.0% (14)
Marital status - Native Hawaiian / Pacific Islander population 15 years and over
Males 69.0% Never married31.0% Now married0.0% Separated0.0% Widowed0.0% DivorcedFemales 61.3% Never married38.7% Now married0.0% Separated0.0% Widowed0.0% DivorcedWomen who did not give birth in the past 12 months Now married:
38.7% (19)Unmarried:
61.3% (31)
Marital status - Other race population 15 years and over
Males 28.9% Never married61.2% Now married0.0% Separated4.8% Widowed5.2% DivorcedFemales 27.4% Never married37.3% Now married0.0% Separated0.0% Widowed35.3% DivorcedWomen who gave birth in the past 12 months Now married:
0.0% (0)Unmarried:
100.0% (17)
Women who did not give birth in the past 12 months Now married:
18.4% (63)Unmarried:
81.6% (281)
Marital status - Two or more races population 15 years and over
Males 33.2% Never married64.3% Now married0.0% Separated0.0% Widowed2.5% DivorcedFemales 46.5% Never married34.1% Now married0.0% Separated0.0% Widowed19.4% DivorcedWomen who gave birth in the past 12 months Now married:
0.0% (0)Unmarried:
100.0% (32)
Women who did not give birth in the past 12 months Now married:
42.3% (180)Unmarried:
57.7% (245)
Marital status - White alone, not Hispanic / Latino population 15 years and over
Males 43.3% Never married37.1% Now married0.3% Separated5.8% Widowed13.5% DivorcedFemales 34.4% Never married35.9% Now married1.5% Separated7.6% Widowed20.6% DivorcedWomen who gave birth in the past 12 months Now married:
66.7% (34)Unmarried:
33.3% (17)
Women who did not give birth in the past 12 months Now married:
33.2% (747)Unmarried:
66.8% (1,500)
Marital status - Hispanic or Latino population 15 years and over
Males 35.0% Never married61.7% Now married0.0% Separated1.5% Widowed1.8% DivorcedFemales 29.2% Never married43.2% Now married0.0% Separated1.2% Widowed26.5% DivorcedWomen who gave birth in the past 12 months Now married:
0.0% (0)Unmarried:
100.0% (67)
Women who did not give birth in the past 12 months Now married:
40.5% (264)Unmarried:
59.5% (388)
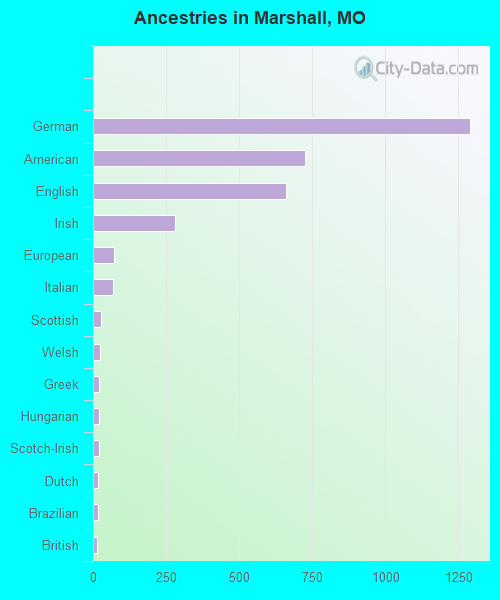
Ancestries in Marshall
1,290 20.9% German726 11.7% American661 10.7% English279 4.5% Irish72 1.2% European70 1.1% Italian29 0.5% Scottish23 0.4% Welsh20 0.3% Greek20 0.3% Hungarian20 0.3% Scotch-Irish18 0.3% Dutch16 0.3% Brazilian14 0.2% British8 0.1% Danish8 0.1% Northern European7 0.1% Norwegian5 0.08% African2 0.03% Russian
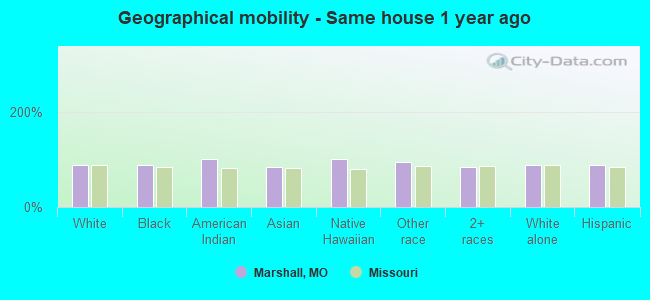
Geographical mobility in Marshall Same house 1 year ago 8,576 87.6% White (Caucasian)851 89.4% Black or African American11 100.0% American Indian / Alaska Native71 83.7% Asian199 100.0% Native Hawaiian / Pacific Islander1,248 93.7% Other race1,367 83.2% Two or more races8,090 87.3% White alone, not Hispanic / Latino2,112 87.8% Hispanic or LatinoMoved within same county 677 6.9% White / Caucasian17 1.8% Black or African American37 2.8% Other race108 6.6% Two or more races671 7.2% White alone, not Hispanic / Latino117 4.8% Hispanic or LatinoMoved within same state 241 2.5% White / Caucasian28 3.0% Black or African American9 10.4% Asian34 2.6% Other race92 5.6% Two or more races239 2.6% White alone, not Hispanic / Latino55 2.3% Hispanic or LatinoMoved from different state 298 3.0% White / Caucasian63 6.6% Black or African American71 4.3% Two or more races265 2.9% White alone, not Hispanic / Latino99 4.1% Hispanic or LatinoMoved from abroad 2 0.0% White3 3.0% Asian18 1.3% Other race2 0.0% White alone, not Hispanic / Latino16 0.7% Hispanic or Latino
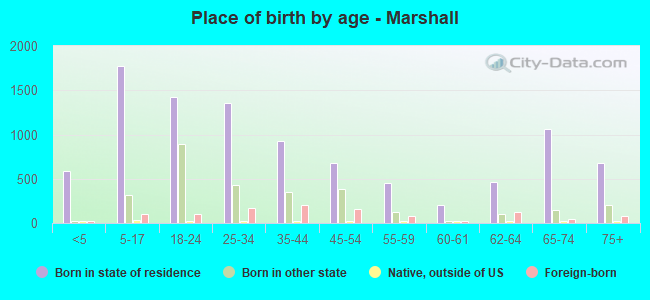
Children Nativity (place of birth) in Marshall
Children under 6 years - Living with two parents Both parents native 518 99.7% Native1 0.3% Foreign-bornBoth parents foreign-born 101 92.8% Native8 7.2% Foreign-bornChildren under 6 years - Living with one parent Native parent 148 100.0% NativeForeign-born parent 29 100.0% NativeChildren 6 to 17 years - Living with two parents Both parents native 576 100.0% NativeBoth parents foreign-born 114 67.9% Native54 32.1% Foreign-bornOne native, one foreign-born parent 61 100.0% NativeChildren 6 to 17 years - Living with one parent Native parent 794 97.7% Native18 2.3% Foreign-bornForeign-born parent 49 72.9% Native18 27.1% Foreign-born
Grandparents responsible for own grandchildren in Marshall
Grandparents (30 to 59 years) White / Caucasian 74 74.1% Responsible for grandchildren26 25.9% Not responsible for grandchildrenBlack or African American 11 38.4% Responsible for grandchildren18 61.6% Not responsible for grandchildrenOther race 28 100.0% Not responsible for grandchildrenWhite alone, not Hispanic / Latino 75 74.0% Responsible for grandchildren26 26.0% Not responsible for grandchildrenHispanic or Latino 19 100.0% Not responsible for grandchildrenGrandparents (60 years and over) White / Caucasian 35 67.1% Responsible for grandchildren17 32.9% Not responsible for grandchildrenOther race 40 41.9% Responsible for grandchildren55 58.1% Not responsible for grandchildrenWhite alone, not Hispanic / Latino 36 66.8% Responsible for grandchildren18 33.2% Not responsible for grandchildrenHispanic or Latino 31 28.5% Responsible for grandchildren77 71.5% Not responsible for grandchildren