Races in Martinsville, Virginia (VA) Detailed Stats
Data:
Races - White alone (%)
Races - White alone (% change since 2000)
Races - Black alone (%)
Races - Black alone (% change since 2000)
Races - American Indian alone (%)
Races - American Indian alone (% change since 2000)
Races - Asian alone (%)
Races - Asian alone (% change since 2000)
Races - Hispanic (%)
Races - Hispanic (% change since 2000)
Races - Native Hawaiian and Other Pacific Islander alone (%)
Races - Native Hawaiian and Other Pacific Islander alone (% change since 2000)
Races - Two or more races(%)
Races - Two or more races(% change since 2000)
Races - Other race alone (%)
Races - Other race alone (% change since 2000)
Racial diversity
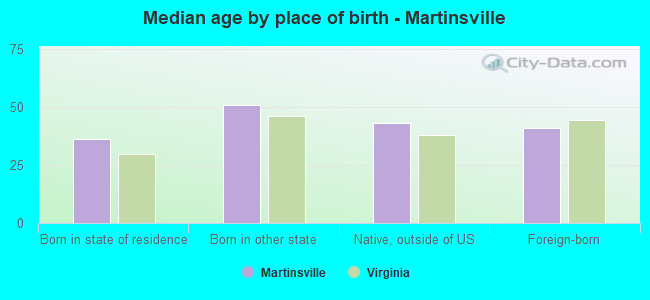
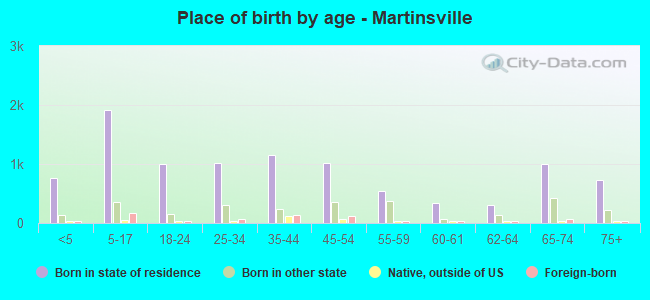
Place of birth - Born in state of residence (%)
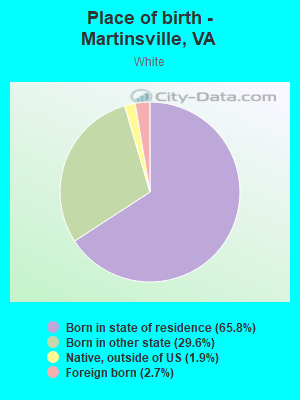
Place of birth - Born in state of residence (%) - White
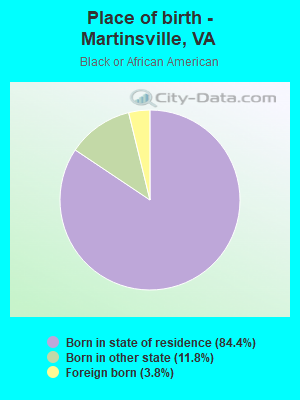
Place of birth - Born in state of residence (%) - Black or African American
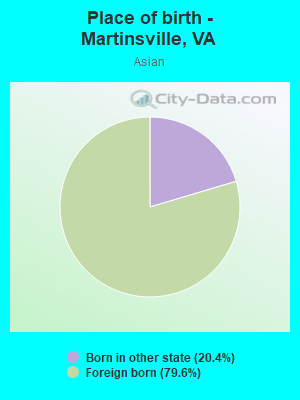
Place of birth - Born in state of residence (%) - Asian
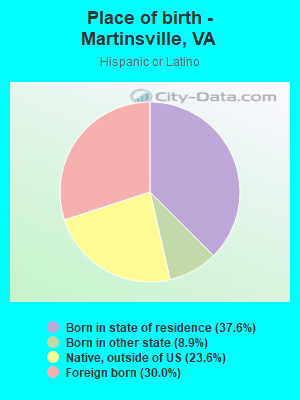
Place of birth - Born in state of residence (%) - Hispanic or Latino
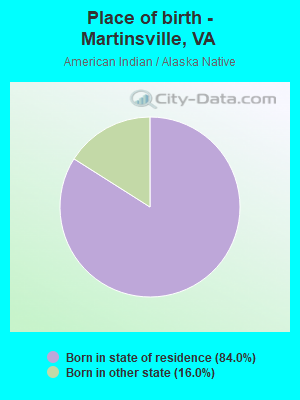
Place of birth - Born in state of residence (%) - American Indian and Alaska Native
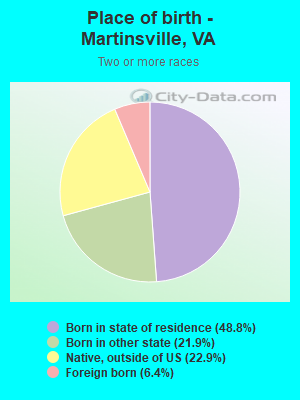
Place of birth - Born in state of residence (%) - Multirace
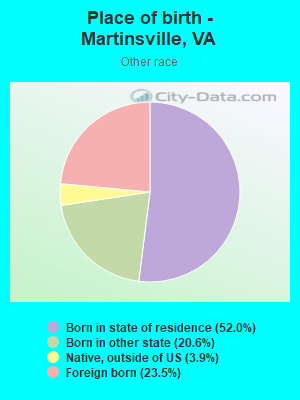
Place of birth - Born in state of residence (%) - Other Race
Place of birth - Born in other state (%)
Place of birth - Born in other state (%) - White
Place of birth - Born in other state (%) - Black or African American
Place of birth - Born in other state (%) - Asian
Place of birth - Born in other state (%) - Hispanic or Latino
Place of birth - Born in other state (%) - American Indian and Alaska Native
Place of birth - Born in other state (%) - Multirace
Place of birth - Born in other state (%) - Other Race
Place of birth - Native, outside of US (%)
Place of birth - Native, outside of US (%) - White
Place of birth - Native, outside of US (%) - Black or African American
Place of birth - Native, outside of US (%) - Asian
Place of birth - Native, outside of US (%) - Hispanic or Latino
Place of birth - Native, outside of US (%) - American Indian and Alaska Native
Place of birth - Native, outside of US (%) - Multirace
Place of birth - Native, outside of US (%) - Other Race
Place of birth - Foreign born (%)
Place of birth - Foreign born (%) - White
Place of birth - Foreign born (%) - Black or African American
Place of birth - Foreign born (%) - Asian
Place of birth - Foreign born (%) - Hispanic or Latino
Place of birth - Foreign born (%) - American Indian and Alaska Native
Place of birth - Foreign born (%) - Multirace
Place of birth - Foreign born (%) - Other Race
Residents speaking English at home (%)
Residents speaking English at home - Born in the United States (%)
Residents speaking English at home - Native, born elsewhere (%)
Residents speaking English at home - Foreign born (%)
Residents speaking Spanish at home (%)
Residents speaking Spanish at home - Born in the United States (%)
Residents speaking Spanish at home - Native, born elsewhere (%)
Residents speaking Spanish at home - Foreign born (%)
Residents speaking other language at home (%)
Residents speaking other language at home - Born in the United States (%)
Residents speaking other language at home - Native, born elsewhere (%)
Residents speaking other language at home - Foreign born (%)
Marital status - Never married (%)
Marital status - Now married (%)
Marital status - Separated (%)
Marital status - Widowed (%)
Marital status - Divorced (%)
Ancestries Reported - Arab (%)
Ancestries Reported - Czech (%)
Ancestries Reported - Danish (%)
Ancestries Reported - Dutch (%)
Ancestries Reported - English (%)
Ancestries Reported - French (%)
Ancestries Reported - French Canadian (%)
Ancestries Reported - German (%)
Ancestries Reported - Greek (%)
Ancestries Reported - Hungarian (%)
Ancestries Reported - Irish (%)
Ancestries Reported - Italian (%)
Ancestries Reported - Lithuanian (%)
Ancestries Reported - Norwegian (%)
Ancestries Reported - Polish (%)
Ancestries Reported - Portuguese (%)
Ancestries Reported - Russian (%)
Ancestries Reported - Scotch-Irish (%)
Ancestries Reported - Scottish (%)
Ancestries Reported - Slovak (%)
Ancestries Reported - Subsaharan African (%)
Ancestries Reported - Swedish (%)
Ancestries Reported - Swiss (%)
Ancestries Reported - Ukrainian (%)
Ancestries Reported - United States (%)
Ancestries Reported - Welsh (%)
Ancestries Reported - West Indian (%)
Ancestries Reported - Other (%)
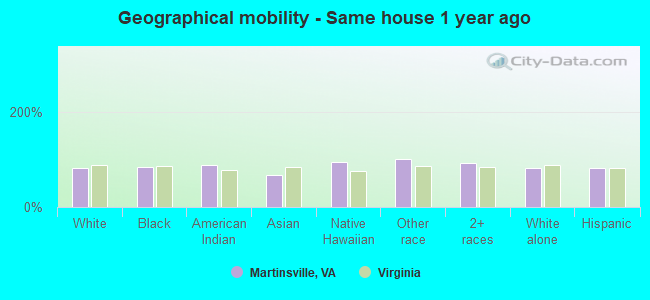
Geographical mobility - Same house 1 year ago (%)
Geographical mobility - Same house 1 year ago (%) - White
Geographical mobility - Same house 1 year ago (%) - Black or African American
Geographical mobility - Same house 1 year ago (%) - Asian
Geographical mobility - Same house 1 year ago (%) - Hispanic or Latino
Geographical mobility - Same house 1 year ago (%) - American Indian and Alaska Native
Geographical mobility - Same house 1 year ago (%) - Multirace
Geographical mobility - Same house 1 year ago (%) - Other Race
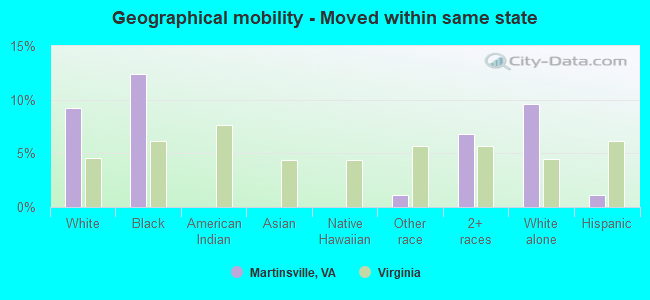
Geographical mobility - Moved within same county (%)
Geographical mobility - Moved within same county (%) - White
Geographical mobility - Moved within same county (%) - Black or African American
Geographical mobility - Moved within same county (%) - Asian
Geographical mobility - Moved within same county (%) - Hispanic or Latino
Geographical mobility - Moved within same county (%) - American Indian and Alaska Native
Geographical mobility - Moved within same county (%) - Multirace
Geographical mobility - Moved within same county (%) - Other Race
Geographical mobility - Moved from different county within same state (%)
Geographical mobility - Moved from different county within same state (%) - White
Geographical mobility - Moved from different county within same state (%) - Black or African American
Geographical mobility - Moved from different county within same state (%) - Asian
Geographical mobility - Moved from different county within same state (%) - Hispanic or Latino
Geographical mobility - Moved from different county within same state (%) - American Indian and Alaska Native
Geographical mobility - Moved from different county within same state (%) - Multirace
Geographical mobility - Moved from different county within same state (%) - Other Race
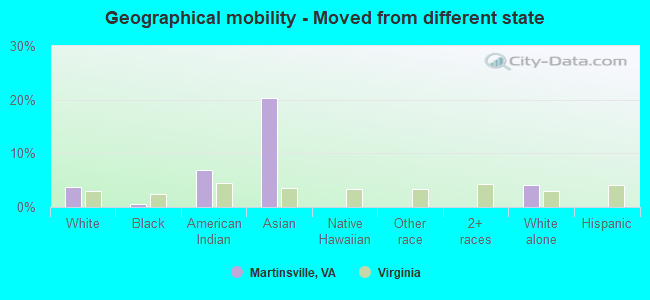
Geographical mobility - Moved from different state (%)
Geographical mobility - Moved from different state (%) - White
Geographical mobility - Moved from different state (%) - Black or African American
Geographical mobility - Moved from different state (%) - Asian
Geographical mobility - Moved from different state (%) - Hispanic or Latino
Geographical mobility - Moved from different state (%) - American Indian and Alaska Native
Geographical mobility - Moved from different state (%) - Multirace
Geographical mobility - Moved from different state (%) - Other Race
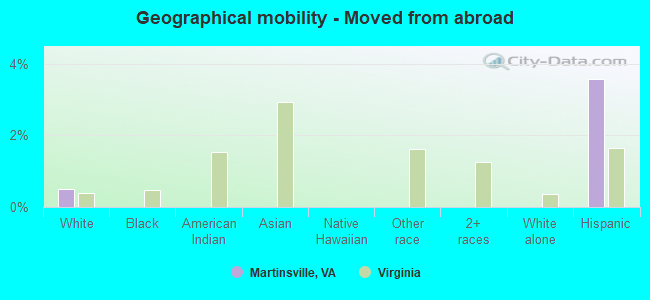
Geographical mobility - Moved from abroad (%)
Geographical mobility - Moved from abroad (%) - White
Geographical mobility - Moved from abroad (%) - Black or African American
Geographical mobility - Moved from abroad (%) - Asian
Geographical mobility - Moved from abroad (%) - Hispanic or Latino
Geographical mobility - Moved from abroad (%) - American Indian and Alaska Native
Geographical mobility - Moved from abroad (%) - Multirace
Geographical mobility - Moved from abroad (%) - Other Race
Place of birth for the foreign-born population - Ireland (%)
Place of birth for the foreign-born population - Denmark (%)
Place of birth for the foreign-born population - Norway (%)
Place of birth for the foreign-born population - Sweden (%)
Place of birth for the foreign-born population - United Kingdom (%)
Place of birth for the foreign-born population - England (%)
Place of birth for the foreign-born population - Scotland (%)
Place of birth for the foreign-born population - Other Northern Europe (%)
Place of birth for the foreign-born population - Austria (%)
Place of birth for the foreign-born population - Belgium (%)
Place of birth for the foreign-born population - France (%)
Place of birth for the foreign-born population - Germany (%)
Place of birth for the foreign-born population - Netherlands (%)
Place of birth for the foreign-born population - Switzerland (%)
Place of birth for the foreign-born population - Other Western Europe (%)
Place of birth for the foreign-born population - Greece (%)
Place of birth for the foreign-born population - Italy (%)
Place of birth for the foreign-born population - Portugal (%)
Place of birth for the foreign-born population - Spain (%)
Place of birth for the foreign-born population - Other Southern Europe (%)
Place of birth for the foreign-born population - Albania (%)
Place of birth for the foreign-born population - Belarus (%)
Place of birth for the foreign-born population - Bosnia and Herzegovina (%)
Place of birth for the foreign-born population - Bulgaria (%)
Place of birth for the foreign-born population - Croatia (%)
Place of birth for the foreign-born population - Czechoslovakia (%)
Place of birth for the foreign-born population - Hungary (%)
Place of birth for the foreign-born population - Latvia (%)
Place of birth for the foreign-born population - Lithuania (%)
Place of birth for the foreign-born population - North Macedonia (Macedonia) (%)
Place of birth for the foreign-born population - Moldova (%)
Place of birth for the foreign-born population - Poland (%)
Place of birth for the foreign-born population - Romania (%)
Place of birth for the foreign-born population - Russia (%)
Place of birth for the foreign-born population - Serbia (%)
Place of birth for the foreign-born population - Ukraine (%)
Place of birth for the foreign-born population - Other Eastern Europe (%)
Place of birth for the foreign-born population - China (%)
Place of birth for the foreign-born population - Hong Kong (%)
Place of birth for the foreign-born population - Taiwan (%)
Place of birth for the foreign-born population - Japan (%)
Place of birth for the foreign-born population - Korea (%)
Place of birth for the foreign-born population - Other Eastern Asia (%)
Place of birth for the foreign-born population - Afghanistan (%)
Place of birth for the foreign-born population - Bangladesh (%)
Place of birth for the foreign-born population - India (%)
Place of birth for the foreign-born population - Iran (%)
Place of birth for the foreign-born population - Kazakhstan (%)
Place of birth for the foreign-born population - Nepal (%)
Place of birth for the foreign-born population - Pakistan (%)
Place of birth for the foreign-born population - Sri Lanka (%)
Place of birth for the foreign-born population - Uzbekistan (%)
Place of birth for the foreign-born population - Other South Central Asia (%)
Place of birth for the foreign-born population - Burma (%)
Place of birth for the foreign-born population - Cambodia (%)
Place of birth for the foreign-born population - Indonesia (%)
Place of birth for the foreign-born population - Laos (%)
Place of birth for the foreign-born population - Malaysia (%)
Place of birth for the foreign-born population - Philippines (%)
Place of birth for the foreign-born population - Singapore (%)
Place of birth for the foreign-born population - Thailand (%)
Place of birth for the foreign-born population - Vietnam (%)
Place of birth for the foreign-born population - Other South Eastern Asia (%)
Place of birth for the foreign-born population - Armenia (%)
Place of birth for the foreign-born population - Iraq (%)
Place of birth for the foreign-born population - Israel (%)
Place of birth for the foreign-born population - Jordan (%)
Place of birth for the foreign-born population - Kuwait (%)
Place of birth for the foreign-born population - Lebanon (%)
Place of birth for the foreign-born population - Saudi Arabia (%)
Place of birth for the foreign-born population - Syria (%)
Place of birth for the foreign-born population - Turkey (%)
Place of birth for the foreign-born population - Yemen (%)
Place of birth for the foreign-born population - Other Western Asia (%)
Place of birth for the foreign-born population - Eritrea (%)
Place of birth for the foreign-born population - Ethiopia (%)
Place of birth for the foreign-born population - Kenya (%)
Place of birth for the foreign-born population - Somalia (%)
Place of birth for the foreign-born population - Uganda (%)
Place of birth for the foreign-born population - Zimbabwe (%)
Place of birth for the foreign-born population - Other Eastern Africa (%)
Place of birth for the foreign-born population - Cameroon (%)
Place of birth for the foreign-born population - Congo (%)
Place of birth for the foreign-born population - Democratic Republic of Congo (Zaire) (%)
Place of birth for the foreign-born population - Other Middle Africa (%)
Place of birth for the foreign-born population - Egypt (%)
Place of birth for the foreign-born population - Morocco (%)
Place of birth for the foreign-born population - Sudan (%)
Place of birth for the foreign-born population - Other Northern Africa (%)
Place of birth for the foreign-born population - South Africa (%)
Place of birth for the foreign-born population - Other Southern Africa (%)
Place of birth for the foreign-born population - Cabo Verde (%)
Place of birth for the foreign-born population - Ghana (%)
Place of birth for the foreign-born population - Liberia (%)
Place of birth for the foreign-born population - Nigeria (%)
Place of birth for the foreign-born population - Senegal (%)
Place of birth for the foreign-born population - Sierra Leone (%)
Place of birth for the foreign-born population - Other Western Africa (%)
Place of birth for the foreign-born population - Australia (%)
Place of birth for the foreign-born population - New Zealand (%)
Place of birth for the foreign-born population - Fiji (%)
Place of birth for the foreign-born population - Micronesia (%)
Place of birth for the foreign-born population - Bahamas (%)
Place of birth for the foreign-born population - Barbados (%)
Place of birth for the foreign-born population - Cuba (%)
Place of birth for the foreign-born population - Dominica (%)
Place of birth for the foreign-born population - Dominican Republic (%)
Place of birth for the foreign-born population - Grenada (%)
Place of birth for the foreign-born population - Haiti (%)
Place of birth for the foreign-born population - Jamaica (%)
Place of birth for the foreign-born population - St. Vincent and the Grenadines (%)
Place of birth for the foreign-born population - Trinidad and Tobago (%)
Place of birth for the foreign-born population - West Indies (%)
Place of birth for the foreign-born population - Other Caribbean (%)
Place of birth for the foreign-born population - Belize (%)
Place of birth for the foreign-born population - Costa Rica (%)
Place of birth for the foreign-born population - El Salvador (%)
Place of birth for the foreign-born population - Guatemala (%)
Place of birth for the foreign-born population - Honduras (%)
Place of birth for the foreign-born population - Mexico (%)
Place of birth for the foreign-born population - Nicaragua (%)
Place of birth for the foreign-born population - Panama (%)
Place of birth for the foreign-born population - Other Central America (%)
Place of birth for the foreign-born population - Argentina (%)
Place of birth for the foreign-born population - Bolivia (%)
Place of birth for the foreign-born population - Brazil (%)
Place of birth for the foreign-born population - Chile (%)
Place of birth for the foreign-born population - Colombia (%)
Place of birth for the foreign-born population - Ecuador (%)
Place of birth for the foreign-born population - Guyana (%)
Place of birth for the foreign-born population - Peru (%)
Place of birth for the foreign-born population - Uruguay (%)
Place of birth for the foreign-born population - Venezuela (%)
Place of birth for the foreign-born population - Other South America (%)
Place of birth for the foreign-born population - Canada (%)
Place of birth for the foreign-born population - Other Northern America (%)
Place of birth for the foreign-born population - Other (%)
Latest news about races in Martinsville, VA collected exclusively by city-data.com from local newspapers, TV, and radio stations
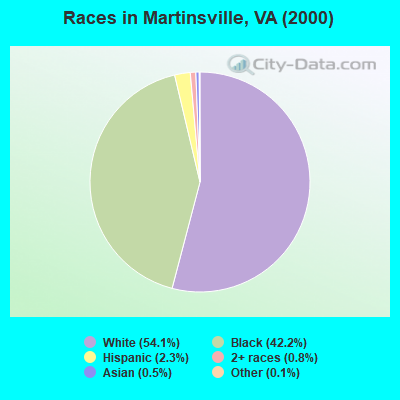
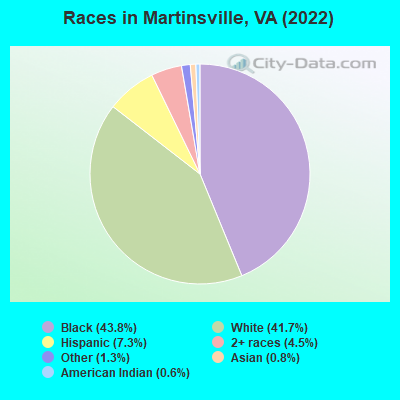
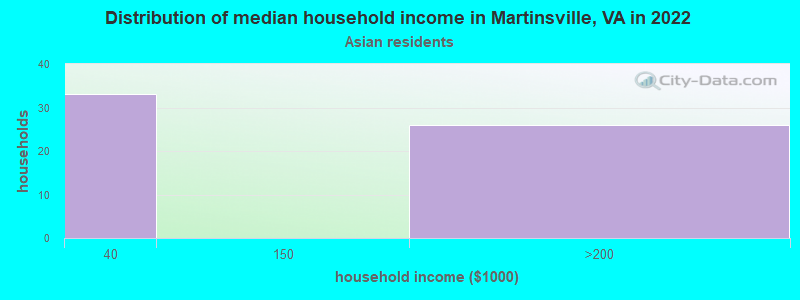
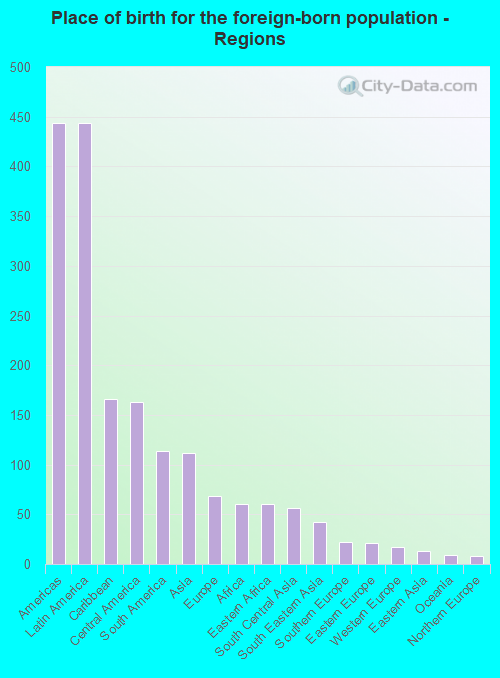
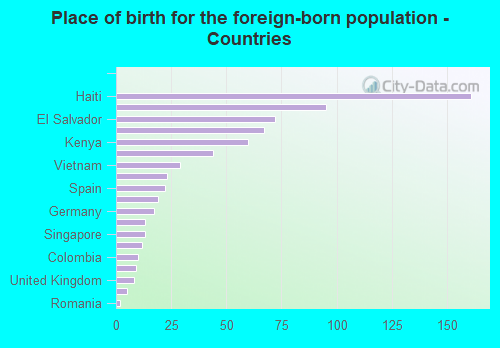
According to 2022 data, the most numerous races in Martinsville, VA are White alone (5,687 residents), Black alone (5,969 residents), and Hispanic (991 residents). 90.5% of Martinsville residents speak English at home. 5.1% of Martinsville, VA residents are foreign-born (3.2% born in Latin America, 0.8% born in Asia), which is 135.4% less than the foreign-born rate of 12.0% across the entire state of Virginia.
Race distribution in Martinsville
2000 2022
4,965,637 70.2% White alone 1,376,378 19.4% Black alone 329,540 4.7% Hispanic 259,277 3.7% Asian alone 114,022 1.6% Two or more races 18,596 0.3% American Indian alone 11,685 0.2% Other race alone 3,380 0.05% Native Hawaiian and Other
5,095,130 58.7% White alone 1,594,785 18.4% Black alone 905,750 10.4% Hispanic 602,881 6.9% Asian alone 406,047 4.7% Two or more races 60,419 0.7% Other race alone 11,738 0.1% American Indian alone 6,869 0.08% Native Hawaiian and Other
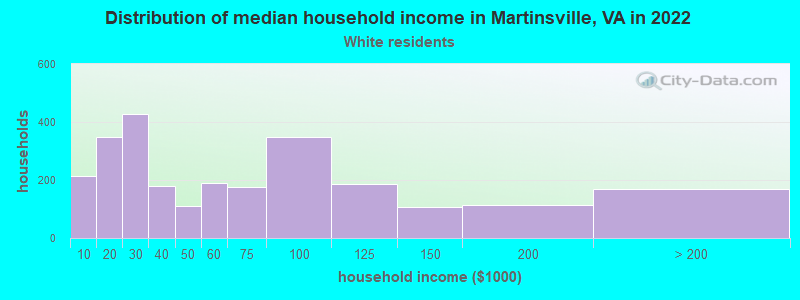
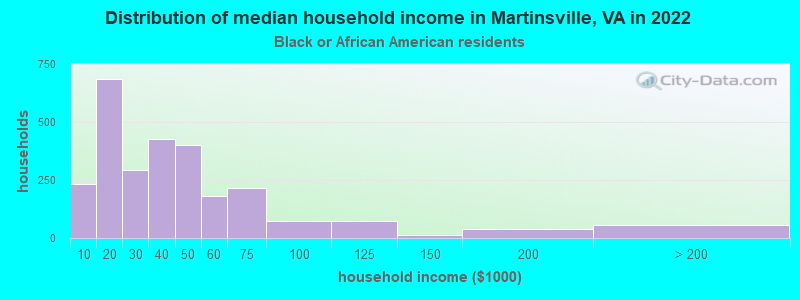
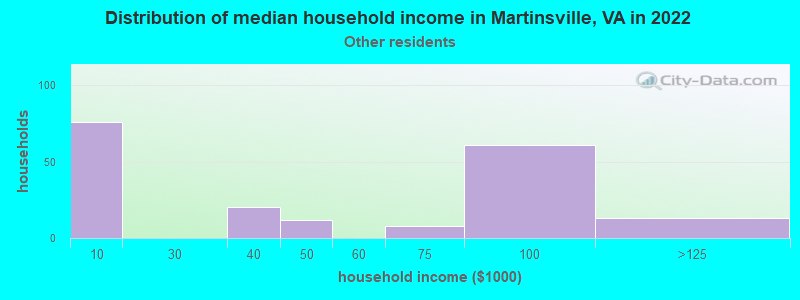
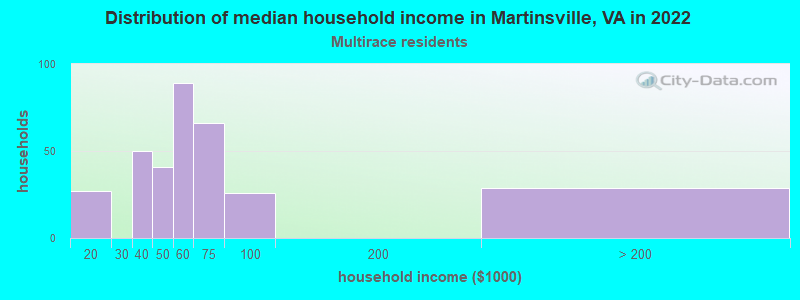
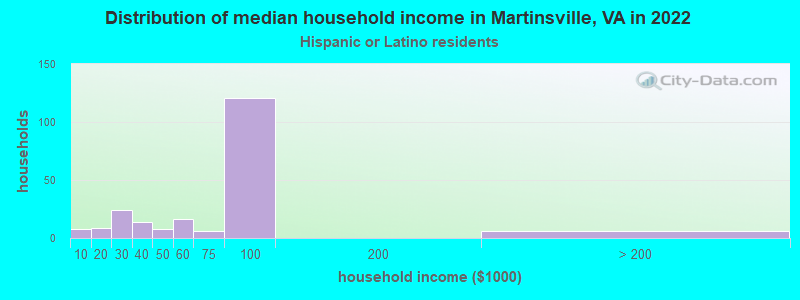
Income and house value in Martinsville Median household income in 2022 $50,743 White non-Hispanic householders$33,752 Black householders$56,051 Two or more races householders$77,315 Hispanic or Latino race householdersMedian 2022 house value $98,612 White Non-Hispanic householders$72,547 Black or African American householders $208,653 Asian householders$70,621 Some other race householders$37,621 Two or more races householders$103,235 Hispanic or Latino householders
Median age by race in Martinsville
49.4 Median age for White residents43.4 51.4 36.4 Median age for Black or African American residents35.0 38.8 22.4 Median age for American Indian / Alaska Native residents22.0 -687,861,271.0 55.4 Median age for Asian residents-681,198,909.4 41.6 -611,955,419.9 Median age for Native Hawaiian / Pacific Islander residents-541,531,822.5 -714,150,046.8 17.0 Median age for Other race residents16.4 19.2 24.7 Median age for Two or more races residents25.7 17.0 49.0 Median age for White alone residents45.5 51.1 22.3 Median age for Hispanic or Latino residents17.8 22.6
Owner/renter occupied households by race in Martinsville
House owners and renters - White residents 1,915 75.5% Owner occupied621 24.5% Renter occupiedHouse owners and renters - Black or African American residents 1,011 37.8% Owner occupied1,661 62.2% Renter occupiedHouse owners and renters - American Indian / Alaska Native residents 7 100.0% Owner occupiedHouse owners and renters - Asian residents 14 22.8% Owner occupied47 77.2% Renter occupiedHouse owners and renters - Other race residents 119 64.2% Owner occupied66 35.8% Renter occupiedHouse owners and renters - Two or more races residents 140 43.9% Owner occupied179 56.1% Renter occupiedHouse owners and renters - White alone residents 1,863 74.7% Owner occupied630 25.3% Renter occupiedHouse owners and renters - Hispanic or Latino residents 193 85.8% Owner occupied32 14.2% Renter occupied
Language usage in Martinsville
English speakers - Total 90.5% of residents of Martinsville speak English at home.
6.5% of residents speak Spanish at home 460 55.7% Speak English very well366 44.3% Speak English less than very well2.6% of residents speak other language at home 289 86.8% Speak English very well44 13.2% Speak English less than very well
English speakers - Born in the United States 96.7% of residents of Martinsville speak English at home.
2.9% of residents speak Spanish at home 77 100.0% Speak English very well0.1% of residents speak other language at home 2 100.0% Speak English less than very well
English speakers - Native, born elsewhere 24.9% of residents of Martinsville speak English at home.
61.2% of residents speak Spanish at home 28 15.8% Speak English very well149 84.2% Speak English less than very well5.9% of residents speak other language at home 17 100.0% Speak English very well
English speakers - Foreign-born 27.3% of residents of Martinsville speak English at home.
42.8% of residents speak Spanish at home 187 62.8% Speak English very well111 37.2% Speak English less than very well29.2% of residents speak other language at home 182 89.7% Speak English very well21 10.3% Speak English less than very well
White (Caucasian) - Speak only English Native:
98.5% (5,318)Foreign-born:
27.1% (42)
White (Caucasian) - Speak another language Native:
1.9% (100)Foreign-born:
72.4% (111)
Black or African American - Speak only English Native:
96.8% (5,166)Foreign-born:
42.3% (99)
Black or African American - Speak another language Native:
3.2% (172)Foreign-born:
54.9% (128)
Asian - Speak only English Native:
92.4% (21)Foreign-born:
16.2% (14)
Other race - Speak another language Native:
65.3% (277)Foreign-born:
98.4% (137)
Two or more races - Speak only English Native:
73.6% (550)Foreign-born:
30.8% (18)
Two or more races - Speak another language Native:
27.3% (204)Foreign-born:
68.0% (40)
White alone - Speak only English Native:
98.3% (5,281)Foreign-born:
71.5% (40)
White alone - Speak another language Native:
1.8% (95)Foreign-born:
24.9% (14)
Hispanic or Latino - Speak only English Native:
17.4% (94)Foreign-born:
1.8% (5)
Hispanic or Latino - Speak another language Native:
81.0% (439)Foreign-born:
97.9% (293)
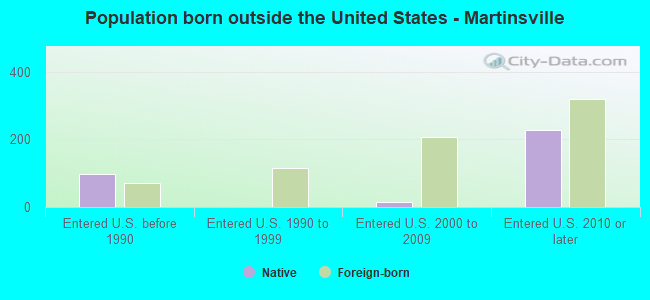
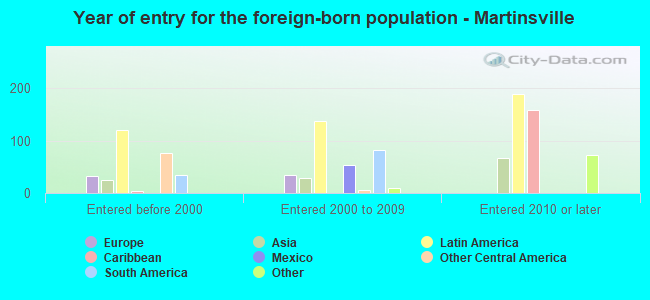
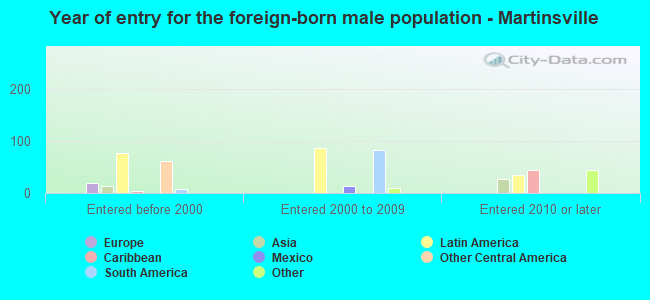
Foreign-born residents in Martinsville 695 residents are foreign born (3.2% Latin America , 0.8% Asia ).
This city:
5.1%Virginia:
12.6%
Marital status for residents in Martinsville Marital status - White (Caucasian) population 15 years and over
Males 36.7% Never married43.5% Now married2.9% Separated6.4% Widowed10.5% DivorcedFemales 22.1% Never married40.5% Now married2.8% Separated18.5% Widowed16.2% DivorcedWomen who gave birth in the past 12 months Now married:
58.5% (58)Unmarried:
41.5% (41)
Women who did not give birth in the past 12 months Now married:
41.9% (429)Unmarried:
58.1% (594)
Marital status - Black or African American population 15 years and over
Males 51.3% Never married29.6% Now married1.3% Separated0.7% Widowed17.2% DivorcedFemales 46.6% Never married19.5% Now married6.3% Separated9.3% Widowed18.2% DivorcedWomen who gave birth in the past 12 months Now married:
100.0% (22)Unmarried:
0.0% (0)
Women who did not give birth in the past 12 months Now married:
18.6% (254)Unmarried:
81.4% (1,113)
Marital status - American Indian / Alaska Native population 15 years and over
Males 62.7% Never married32.8% Now married0.0% Separated0.0% Widowed4.5% DivorcedFemales 0.0% Never married0.0% Now married0.0% Separated100.0% Widowed0.0% DivorcedMarital status - Asian population 15 years and over
Males 0.0% Never married100.0% Now married0.0% Separated0.0% Widowed0.0% DivorcedFemales 0.0% Never married39.8% Now married0.0% Separated0.0% Widowed60.2% DivorcedWomen who did not give birth in the past 12 months Now married:
31.0% (13)Unmarried:
69.0% (30)
Marital status - Other race population 15 years and over
Males 36.4% Never married60.5% Now married0.0% Separated0.0% Widowed3.1% DivorcedFemales 64.3% Never married35.7% Now married0.0% Separated0.0% Widowed0.0% DivorcedWomen who did not give birth in the past 12 months Now married:
19.0% (25)Unmarried:
81.0% (107)
Marital status - Two or more races population 15 years and over
Males 35.4% Never married64.6% Now married0.0% Separated0.0% Widowed0.0% DivorcedFemales 49.5% Never married31.6% Now married0.0% Separated5.5% Widowed13.5% DivorcedWomen who did not give birth in the past 12 months Now married:
35.4% (108)Unmarried:
64.6% (197)
Marital status - White alone, not Hispanic / Latino population 15 years and over
Males 35.8% Never married43.5% Now married3.1% Separated6.9% Widowed10.7% DivorcedFemales 21.4% Never married40.0% Now married2.8% Separated19.0% Widowed16.7% DivorcedWomen who gave birth in the past 12 months Now married:
58.5% (61)Unmarried:
41.5% (43)
Women who did not give birth in the past 12 months Now married:
41.4% (411)Unmarried:
58.6% (583)
Marital status - Hispanic or Latino population 15 years and over
Males 34.4% Never married60.5% Now married0.0% Separated0.0% Widowed5.1% DivorcedFemales 45.5% Never married45.1% Now married0.0% Separated0.0% Widowed9.4% DivorcedWomen who did not give birth in the past 12 months Now married:
44.8% (96)Unmarried:
55.2% (118)
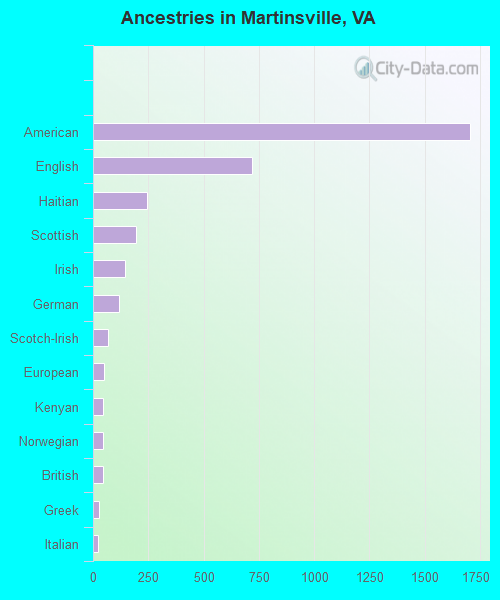
Ancestries in Martinsville
1,706 19.6% American717 8.2% English243 2.8% Haitian196 2.3% Scottish143 1.6% Irish117 1.3% German66 0.8% Scotch-Irish52 0.6% European47 0.5% Kenyan46 0.5% Norwegian43 0.5% British28 0.3% Greek23 0.3% Italian14 0.2% African11 0.1% Polish10 0.1% Russian9 0.1% French4 0.05% Danish
Children Nativity (place of birth) in Martinsville
Children under 6 years - Living with two parents Both parents native 303 100.0% NativeBoth parents foreign-born 134 100.0% NativeChildren under 6 years - Living with one parent Native parent 653 100.0% NativeChildren 6 to 17 years - Living with two parents Both parents native 639 100.0% NativeBoth parents foreign-born 20 16.4% Native104 83.6% Foreign-bornOne native, one foreign-born parent 68 100.0% NativeChildren 6 to 17 years - Living with one parent Native parent 1,085 100.0% NativeForeign-born parent 234 61.0% Native150 39.0% Foreign-born
Grandparents responsible for own grandchildren in Martinsville
Grandparents (30 to 59 years) White / Caucasian 27 55.6% Responsible for grandchildren21 44.4% Not responsible for grandchildrenBlack or African American 78 70.4% Responsible for grandchildren33 29.6% Not responsible for grandchildrenWhite alone, not Hispanic / Latino 27 53.4% Responsible for grandchildren24 46.6% Not responsible for grandchildrenGrandparents (60 years and over) White / Caucasian 13 62.9% Responsible for grandchildren8 37.1% Not responsible for grandchildrenBlack or African American 9 45.8% Responsible for grandchildren10 54.2% Not responsible for grandchildrenWhite alone, not Hispanic / Latino 13 62.0% Responsible for grandchildren8 38.0% Not responsible for grandchildren