Races in Maryland Heights, Missouri (MO) Detailed Stats
Data:
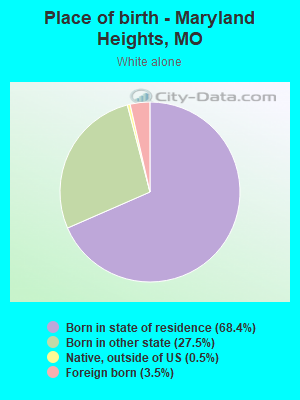
Races - White alone (%)
Races - White alone (% change since 2000)
Races - Black alone (%)
Races - Black alone (% change since 2000)
Races - American Indian alone (%)
Races - American Indian alone (% change since 2000)
Races - Asian alone (%)
Races - Asian alone (% change since 2000)
Races - Hispanic (%)
Races - Hispanic (% change since 2000)
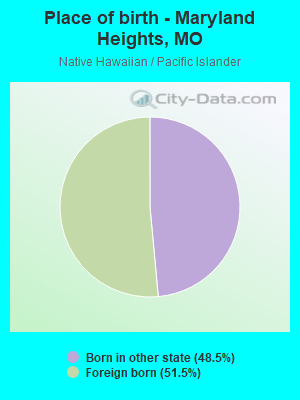
Races - Native Hawaiian and Other Pacific Islander alone (%)
Races - Native Hawaiian and Other Pacific Islander alone (% change since 2000)
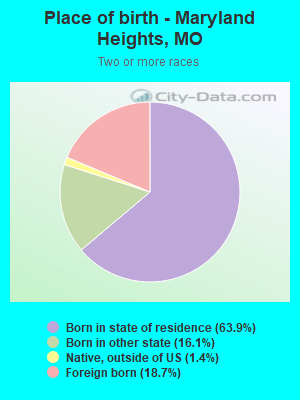
Races - Two or more races(%)
Races - Two or more races(% change since 2000)
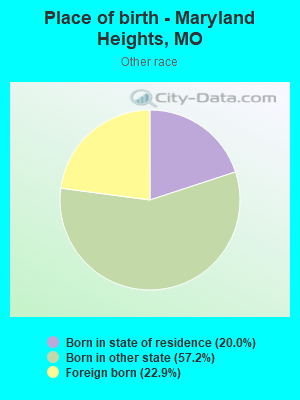
Races - Other race alone (%)
Races - Other race alone (% change since 2000)
Racial diversity
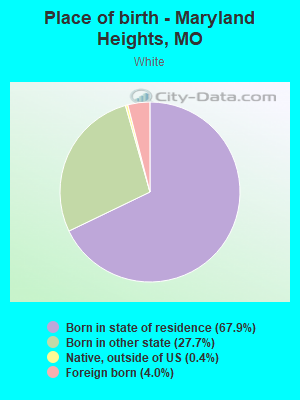
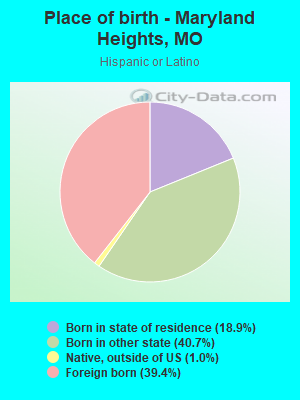
Place of birth - Born in state of residence (%)
Place of birth - Born in state of residence (%) - White
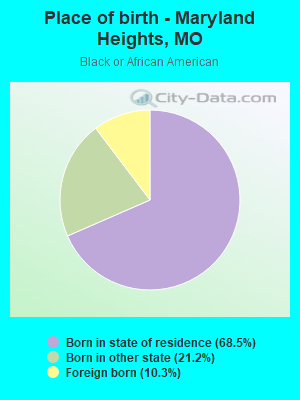
Place of birth - Born in state of residence (%) - Black or African American
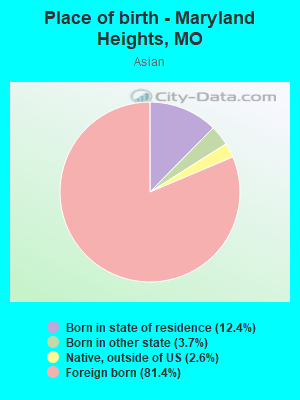
Place of birth - Born in state of residence (%) - Asian
Place of birth - Born in state of residence (%) - Hispanic or Latino
Place of birth - Born in state of residence (%) - American Indian and Alaska Native
Place of birth - Born in state of residence (%) - Multirace
Place of birth - Born in state of residence (%) - Other Race
Place of birth - Born in other state (%)
Place of birth - Born in other state (%) - White
Place of birth - Born in other state (%) - Black or African American
Place of birth - Born in other state (%) - Asian
Place of birth - Born in other state (%) - Hispanic or Latino
Place of birth - Born in other state (%) - American Indian and Alaska Native
Place of birth - Born in other state (%) - Multirace
Place of birth - Born in other state (%) - Other Race
Place of birth - Native, outside of US (%)
Place of birth - Native, outside of US (%) - White
Place of birth - Native, outside of US (%) - Black or African American
Place of birth - Native, outside of US (%) - Asian
Place of birth - Native, outside of US (%) - Hispanic or Latino
Place of birth - Native, outside of US (%) - American Indian and Alaska Native
Place of birth - Native, outside of US (%) - Multirace
Place of birth - Native, outside of US (%) - Other Race
Place of birth - Foreign born (%)
Place of birth - Foreign born (%) - White
Place of birth - Foreign born (%) - Black or African American
Place of birth - Foreign born (%) - Asian
Place of birth - Foreign born (%) - Hispanic or Latino
Place of birth - Foreign born (%) - American Indian and Alaska Native
Place of birth - Foreign born (%) - Multirace
Place of birth - Foreign born (%) - Other Race
Residents speaking English at home (%)
Residents speaking English at home - Born in the United States (%)
Residents speaking English at home - Native, born elsewhere (%)
Residents speaking English at home - Foreign born (%)
Residents speaking Spanish at home (%)
Residents speaking Spanish at home - Born in the United States (%)
Residents speaking Spanish at home - Native, born elsewhere (%)
Residents speaking Spanish at home - Foreign born (%)
Residents speaking other language at home (%)
Residents speaking other language at home - Born in the United States (%)
Residents speaking other language at home - Native, born elsewhere (%)
Residents speaking other language at home - Foreign born (%)
Marital status - Never married (%)
Marital status - Now married (%)
Marital status - Separated (%)
Marital status - Widowed (%)
Marital status - Divorced (%)
Ancestries Reported - Arab (%)
Ancestries Reported - Czech (%)
Ancestries Reported - Danish (%)
Ancestries Reported - Dutch (%)
Ancestries Reported - English (%)
Ancestries Reported - French (%)
Ancestries Reported - French Canadian (%)
Ancestries Reported - German (%)
Ancestries Reported - Greek (%)
Ancestries Reported - Hungarian (%)
Ancestries Reported - Irish (%)
Ancestries Reported - Italian (%)
Ancestries Reported - Lithuanian (%)
Ancestries Reported - Norwegian (%)
Ancestries Reported - Polish (%)
Ancestries Reported - Portuguese (%)
Ancestries Reported - Russian (%)
Ancestries Reported - Scotch-Irish (%)
Ancestries Reported - Scottish (%)
Ancestries Reported - Slovak (%)
Ancestries Reported - Subsaharan African (%)
Ancestries Reported - Swedish (%)
Ancestries Reported - Swiss (%)
Ancestries Reported - Ukrainian (%)
Ancestries Reported - United States (%)
Ancestries Reported - Welsh (%)
Ancestries Reported - West Indian (%)
Ancestries Reported - Other (%)
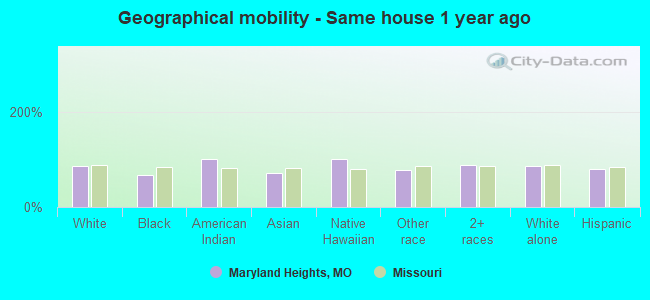
Geographical mobility - Same house 1 year ago (%)
Geographical mobility - Same house 1 year ago (%) - White
Geographical mobility - Same house 1 year ago (%) - Black or African American
Geographical mobility - Same house 1 year ago (%) - Asian
Geographical mobility - Same house 1 year ago (%) - Hispanic or Latino
Geographical mobility - Same house 1 year ago (%) - American Indian and Alaska Native
Geographical mobility - Same house 1 year ago (%) - Multirace
Geographical mobility - Same house 1 year ago (%) - Other Race
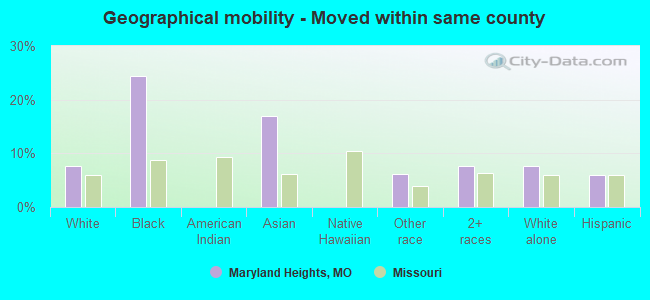
Geographical mobility - Moved within same county (%)
Geographical mobility - Moved within same county (%) - White
Geographical mobility - Moved within same county (%) - Black or African American
Geographical mobility - Moved within same county (%) - Asian
Geographical mobility - Moved within same county (%) - Hispanic or Latino
Geographical mobility - Moved within same county (%) - American Indian and Alaska Native
Geographical mobility - Moved within same county (%) - Multirace
Geographical mobility - Moved within same county (%) - Other Race
Geographical mobility - Moved from different county within same state (%)
Geographical mobility - Moved from different county within same state (%) - White
Geographical mobility - Moved from different county within same state (%) - Black or African American
Geographical mobility - Moved from different county within same state (%) - Asian
Geographical mobility - Moved from different county within same state (%) - Hispanic or Latino
Geographical mobility - Moved from different county within same state (%) - American Indian and Alaska Native
Geographical mobility - Moved from different county within same state (%) - Multirace
Geographical mobility - Moved from different county within same state (%) - Other Race
Geographical mobility - Moved from different state (%)
Geographical mobility - Moved from different state (%) - White
Geographical mobility - Moved from different state (%) - Black or African American
Geographical mobility - Moved from different state (%) - Asian
Geographical mobility - Moved from different state (%) - Hispanic or Latino
Geographical mobility - Moved from different state (%) - American Indian and Alaska Native
Geographical mobility - Moved from different state (%) - Multirace
Geographical mobility - Moved from different state (%) - Other Race
Geographical mobility - Moved from abroad (%)
Geographical mobility - Moved from abroad (%) - White
Geographical mobility - Moved from abroad (%) - Black or African American
Geographical mobility - Moved from abroad (%) - Asian
Geographical mobility - Moved from abroad (%) - Hispanic or Latino
Geographical mobility - Moved from abroad (%) - American Indian and Alaska Native
Geographical mobility - Moved from abroad (%) - Multirace
Geographical mobility - Moved from abroad (%) - Other Race
Place of birth for the foreign-born population - Ireland (%)
Place of birth for the foreign-born population - Denmark (%)
Place of birth for the foreign-born population - Norway (%)
Place of birth for the foreign-born population - Sweden (%)
Place of birth for the foreign-born population - United Kingdom (%)
Place of birth for the foreign-born population - England (%)
Place of birth for the foreign-born population - Scotland (%)
Place of birth for the foreign-born population - Other Northern Europe (%)
Place of birth for the foreign-born population - Austria (%)
Place of birth for the foreign-born population - Belgium (%)
Place of birth for the foreign-born population - France (%)
Place of birth for the foreign-born population - Germany (%)
Place of birth for the foreign-born population - Netherlands (%)
Place of birth for the foreign-born population - Switzerland (%)
Place of birth for the foreign-born population - Other Western Europe (%)
Place of birth for the foreign-born population - Greece (%)
Place of birth for the foreign-born population - Italy (%)
Place of birth for the foreign-born population - Portugal (%)
Place of birth for the foreign-born population - Spain (%)
Place of birth for the foreign-born population - Other Southern Europe (%)
Place of birth for the foreign-born population - Albania (%)
Place of birth for the foreign-born population - Belarus (%)
Place of birth for the foreign-born population - Bosnia and Herzegovina (%)
Place of birth for the foreign-born population - Bulgaria (%)
Place of birth for the foreign-born population - Croatia (%)
Place of birth for the foreign-born population - Czechoslovakia (%)
Place of birth for the foreign-born population - Hungary (%)
Place of birth for the foreign-born population - Latvia (%)
Place of birth for the foreign-born population - Lithuania (%)
Place of birth for the foreign-born population - North Macedonia (Macedonia) (%)
Place of birth for the foreign-born population - Moldova (%)
Place of birth for the foreign-born population - Poland (%)
Place of birth for the foreign-born population - Romania (%)
Place of birth for the foreign-born population - Russia (%)
Place of birth for the foreign-born population - Serbia (%)
Place of birth for the foreign-born population - Ukraine (%)
Place of birth for the foreign-born population - Other Eastern Europe (%)
Place of birth for the foreign-born population - China (%)
Place of birth for the foreign-born population - Hong Kong (%)
Place of birth for the foreign-born population - Taiwan (%)
Place of birth for the foreign-born population - Japan (%)
Place of birth for the foreign-born population - Korea (%)
Place of birth for the foreign-born population - Other Eastern Asia (%)
Place of birth for the foreign-born population - Afghanistan (%)
Place of birth for the foreign-born population - Bangladesh (%)
Place of birth for the foreign-born population - India (%)
Place of birth for the foreign-born population - Iran (%)
Place of birth for the foreign-born population - Kazakhstan (%)
Place of birth for the foreign-born population - Nepal (%)
Place of birth for the foreign-born population - Pakistan (%)
Place of birth for the foreign-born population - Sri Lanka (%)
Place of birth for the foreign-born population - Uzbekistan (%)
Place of birth for the foreign-born population - Other South Central Asia (%)
Place of birth for the foreign-born population - Burma (%)
Place of birth for the foreign-born population - Cambodia (%)
Place of birth for the foreign-born population - Indonesia (%)
Place of birth for the foreign-born population - Laos (%)
Place of birth for the foreign-born population - Malaysia (%)
Place of birth for the foreign-born population - Philippines (%)
Place of birth for the foreign-born population - Singapore (%)
Place of birth for the foreign-born population - Thailand (%)
Place of birth for the foreign-born population - Vietnam (%)
Place of birth for the foreign-born population - Other South Eastern Asia (%)
Place of birth for the foreign-born population - Armenia (%)
Place of birth for the foreign-born population - Iraq (%)
Place of birth for the foreign-born population - Israel (%)
Place of birth for the foreign-born population - Jordan (%)
Place of birth for the foreign-born population - Kuwait (%)
Place of birth for the foreign-born population - Lebanon (%)
Place of birth for the foreign-born population - Saudi Arabia (%)
Place of birth for the foreign-born population - Syria (%)
Place of birth for the foreign-born population - Turkey (%)
Place of birth for the foreign-born population - Yemen (%)
Place of birth for the foreign-born population - Other Western Asia (%)
Place of birth for the foreign-born population - Eritrea (%)
Place of birth for the foreign-born population - Ethiopia (%)
Place of birth for the foreign-born population - Kenya (%)
Place of birth for the foreign-born population - Somalia (%)
Place of birth for the foreign-born population - Uganda (%)
Place of birth for the foreign-born population - Zimbabwe (%)
Place of birth for the foreign-born population - Other Eastern Africa (%)
Place of birth for the foreign-born population - Cameroon (%)
Place of birth for the foreign-born population - Congo (%)
Place of birth for the foreign-born population - Democratic Republic of Congo (Zaire) (%)
Place of birth for the foreign-born population - Other Middle Africa (%)
Place of birth for the foreign-born population - Egypt (%)
Place of birth for the foreign-born population - Morocco (%)
Place of birth for the foreign-born population - Sudan (%)
Place of birth for the foreign-born population - Other Northern Africa (%)
Place of birth for the foreign-born population - South Africa (%)
Place of birth for the foreign-born population - Other Southern Africa (%)
Place of birth for the foreign-born population - Cabo Verde (%)
Place of birth for the foreign-born population - Ghana (%)
Place of birth for the foreign-born population - Liberia (%)
Place of birth for the foreign-born population - Nigeria (%)
Place of birth for the foreign-born population - Senegal (%)
Place of birth for the foreign-born population - Sierra Leone (%)
Place of birth for the foreign-born population - Other Western Africa (%)
Place of birth for the foreign-born population - Australia (%)
Place of birth for the foreign-born population - New Zealand (%)
Place of birth for the foreign-born population - Fiji (%)
Place of birth for the foreign-born population - Micronesia (%)
Place of birth for the foreign-born population - Bahamas (%)
Place of birth for the foreign-born population - Barbados (%)
Place of birth for the foreign-born population - Cuba (%)
Place of birth for the foreign-born population - Dominica (%)
Place of birth for the foreign-born population - Dominican Republic (%)
Place of birth for the foreign-born population - Grenada (%)
Place of birth for the foreign-born population - Haiti (%)
Place of birth for the foreign-born population - Jamaica (%)
Place of birth for the foreign-born population - St. Vincent and the Grenadines (%)
Place of birth for the foreign-born population - Trinidad and Tobago (%)
Place of birth for the foreign-born population - West Indies (%)
Place of birth for the foreign-born population - Other Caribbean (%)
Place of birth for the foreign-born population - Belize (%)
Place of birth for the foreign-born population - Costa Rica (%)
Place of birth for the foreign-born population - El Salvador (%)
Place of birth for the foreign-born population - Guatemala (%)
Place of birth for the foreign-born population - Honduras (%)
Place of birth for the foreign-born population - Mexico (%)
Place of birth for the foreign-born population - Nicaragua (%)
Place of birth for the foreign-born population - Panama (%)
Place of birth for the foreign-born population - Other Central America (%)
Place of birth for the foreign-born population - Argentina (%)
Place of birth for the foreign-born population - Bolivia (%)
Place of birth for the foreign-born population - Brazil (%)
Place of birth for the foreign-born population - Chile (%)
Place of birth for the foreign-born population - Colombia (%)
Place of birth for the foreign-born population - Ecuador (%)
Place of birth for the foreign-born population - Guyana (%)
Place of birth for the foreign-born population - Peru (%)
Place of birth for the foreign-born population - Uruguay (%)
Place of birth for the foreign-born population - Venezuela (%)
Place of birth for the foreign-born population - Other South America (%)
Place of birth for the foreign-born population - Canada (%)
Place of birth for the foreign-born population - Other Northern America (%)
Place of birth for the foreign-born population - Other (%)
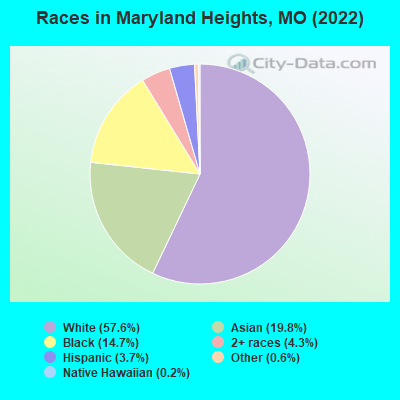
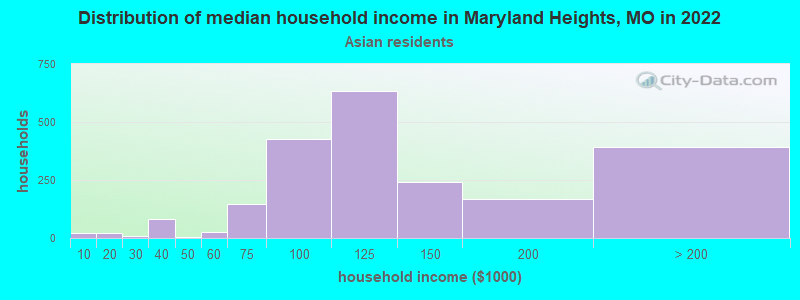
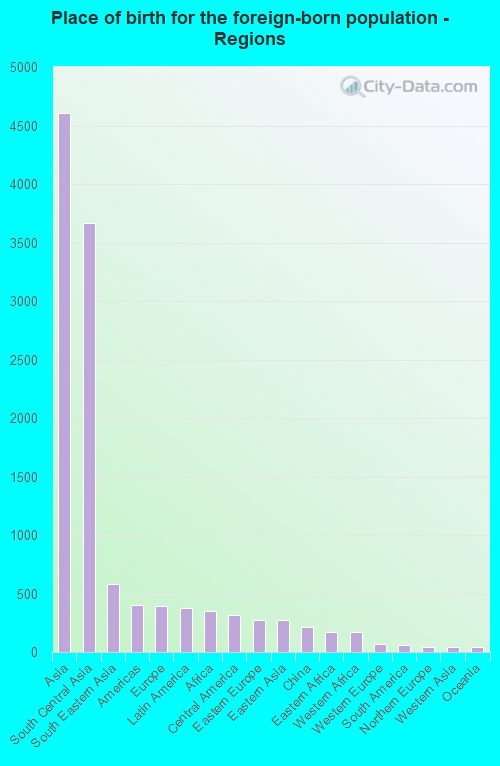
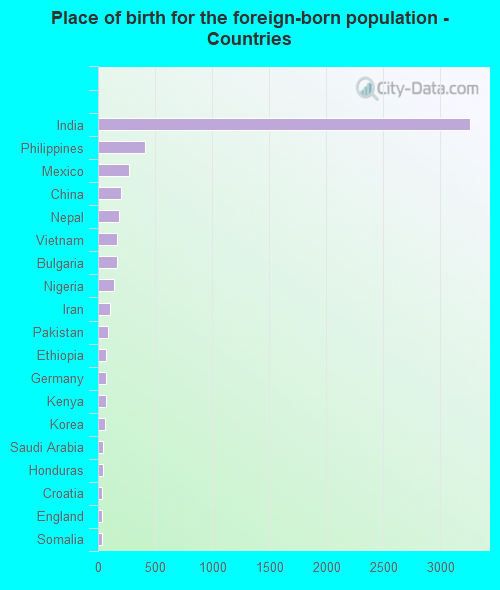
According to 2022 data, the most numerous races in Maryland Heights, MO are White alone (16,036 residents), Black alone (4,091 residents), and Two or more races (1,197 residents). 76.1% of Maryland Heights residents speak English at home. 20.8% of Maryland Heights, MO residents are foreign-born (16.8% born in Asia), which is 80.8% greater than the foreign-born rate of 4.0% across the entire state of Missouri.
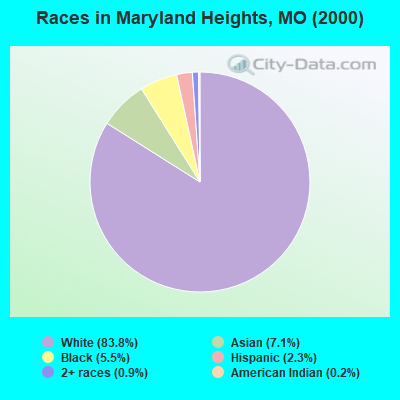
Race distribution in Maryland Heights
2000 2022
4,686,474 83.8% White alone 625,667 11.2% Black alone 118,592 2.1% Hispanic 71,905 1.3% Two or more races 61,041 1.1% Asian alone 23,302 0.4% American Indian alone 5,291 0.09% Other race alone 2,939 0.05% Native Hawaiian and Other
4,733,411 76.6% White alone 656,739 10.6% Black alone 316,300 5.1% Two or more races 291,763 4.7% Hispanic 132,436 2.1% Asian alone 27,467 0.4% Other race alone 12,313 0.2% American Indian alone 7,528 0.1% Native Hawaiian and Other
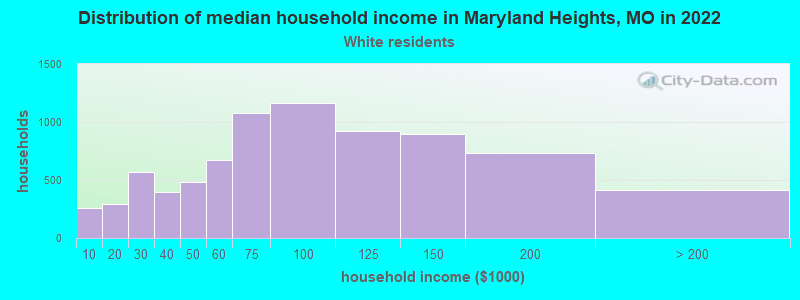
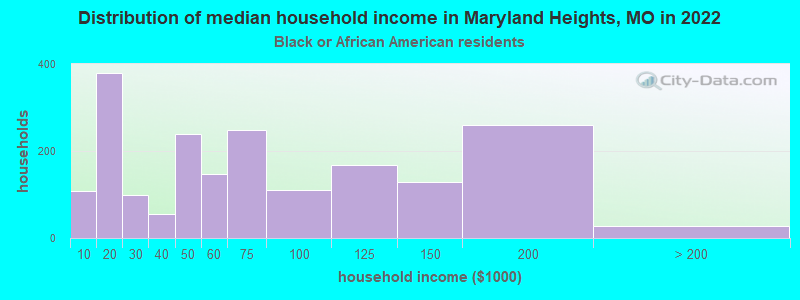
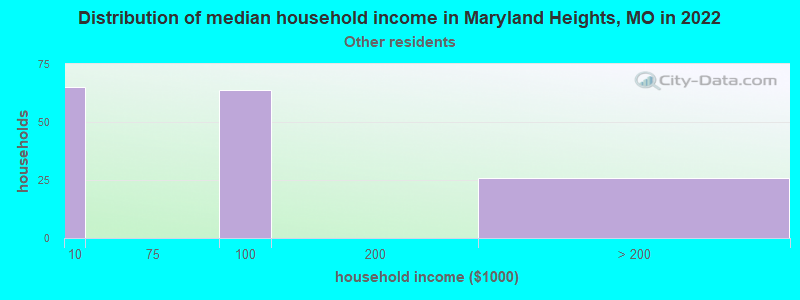
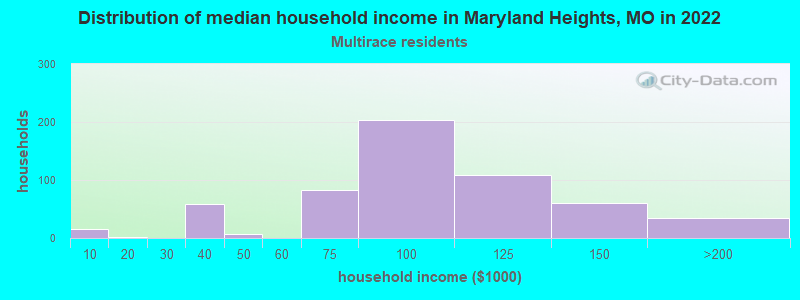
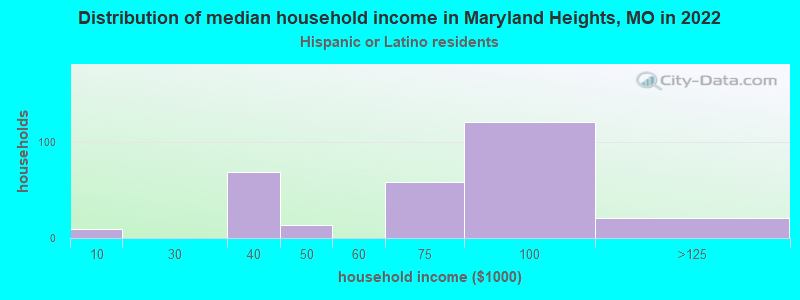
Income and house value in Maryland Heights Median household income in 2022 $77,621 White non-Hispanic householders$59,069 Black householders$108,910 Asian householders$74,791 Two or more races householders$77,272 Hispanic or Latino race householdersMedian 2022 house value $211,856 White Non-Hispanic householders$246,736 Black or African American householders $265,960 Asian householders$173,409 Native Hawaiian and other Pacific Islander householders$349,989 Some other race householders$188,272 Two or more races householders$206,901 Hispanic or Latino householders
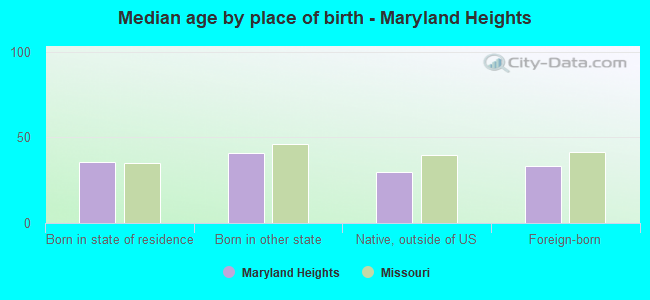
Median age by race in Maryland Heights
42.2 Median age for White residents41.2 42.8 32.8 Median age for Black or African American residents34.0 33.4 -520,187,792.9 Median age for American Indian / Alaska Native residents-644,003,776.5 -505,494,505.0 31.4 Median age for Asian residents33.1 28.3 23.7 Median age for Native Hawaiian / Pacific Islander residents-1,449,781,657.9 -752,136,751.4 21.6 Median age for Other race residents27.1 18.4 20.1 Median age for Two or more races residents12.5 21.6 42.4 Median age for White alone residents41.2 43.1 29.2 Median age for Hispanic or Latino residents30.5 23.9
Owner/renter occupied households by race in Maryland Heights
House owners and renters - White residents 5,774 73.1% Owner occupied2,126 26.9% Renter occupiedHouse owners and renters - Black or African American residents 631 34.0% Owner occupied1,223 66.0% Renter occupiedHouse owners and renters - Asian residents 363 16.6% Owner occupied1,826 83.4% Renter occupiedHouse owners and renters - Native Hawaiian / Pacific Islander residents 15 100.0% Renter occupiedHouse owners and renters - Other race residents 71 64.1% Owner occupied40 35.9% Renter occupiedHouse owners and renters - Two or more races residents 311 53.2% Owner occupied273 46.8% Renter occupiedHouse owners and renters - White alone residents 5,726 73.3% Owner occupied2,086 26.7% Renter occupiedHouse owners and renters - Hispanic or Latino residents 185 61.1% Owner occupied118 38.9% Renter occupied
Language usage in Maryland Heights
English speakers - Total 76.1% of residents of Maryland Heights speak English at home.
3.2% of residents speak Spanish at home 521 62.5% Speak English very well313 37.5% Speak English less than very well20.9% of residents speak other language at home 4,435 80.3% Speak English very well1,086 19.7% Speak English less than very well
English speakers - Born in the United States 95.0% of residents of Maryland Heights speak English at home.
4.2% of residents speak Spanish at home 236 94.4% Speak English very well14 5.6% Speak English less than very well0.3% of residents speak other language at home 10 58.8% Speak English very well7 41.2% Speak English less than very well
English speakers - Native, born elsewhere 41.3% of residents of Maryland Heights speak English at home.
9.5% of residents speak Spanish at home 18 100.0% Speak English very well65.6% of residents speak other language at home 124 100.0% Speak English very well
English speakers - Foreign-born 9.4% of residents of Maryland Heights speak English at home.
7.9% of residents speak Spanish at home 210 46.6% Speak English very well241 53.4% Speak English less than very well80.7% of residents speak other language at home 3,587 77.6% Speak English very well1,033 22.4% Speak English less than very well
White (Caucasian) - Speak only English Native:
96.6% (14,633)Foreign-born:
12.0% (78)
White (Caucasian) - Speak another language Native:
3.4% (512)Foreign-born:
90.1% (583)
Black or African American - Speak only English Native:
98.5% (3,479)Foreign-born:
20.8% (84)
Black or African American - Speak another language Native:
0.9% (30)Foreign-born:
76.1% (306)
Asian - Speak only English Native:
76.8% (536)Foreign-born:
9.7% (413)
Asian - Speak another language Native:
28.6% (199)Foreign-born:
88.5% (3,777)
Other race - Speak another language Native:
41.5% (142)Foreign-born:
90.6% (107)
Two or more races - Speak only English Native:
87.8% (815)Foreign-born:
10.5% (31)
Two or more races - Speak another language Native:
13.2% (123)Foreign-born:
90.1% (266)
White alone - Speak only English Native:
96.6% (14,527)Foreign-born:
13.9% (80)
White alone - Speak another language Native:
3.4% (515)Foreign-born:
88.2% (506)
Hispanic or Latino - Speak another language Native:
44.9% (260)Foreign-born:
100.0% (407)
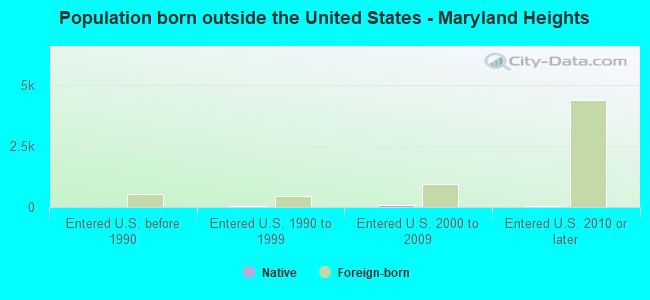
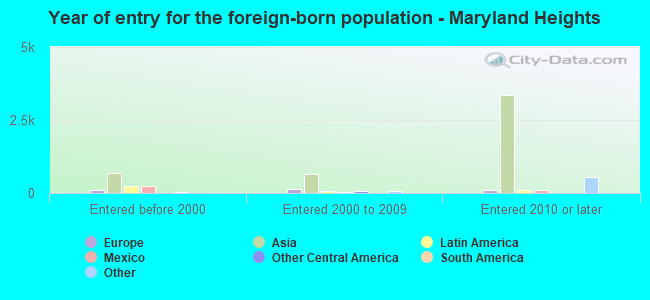
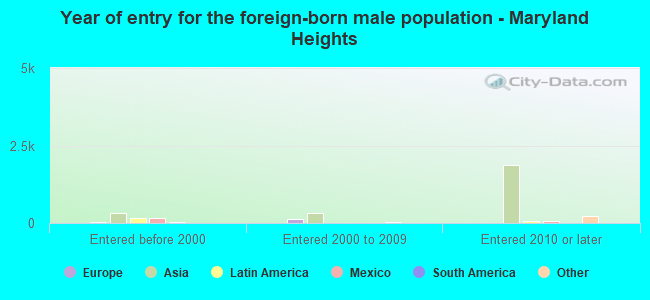
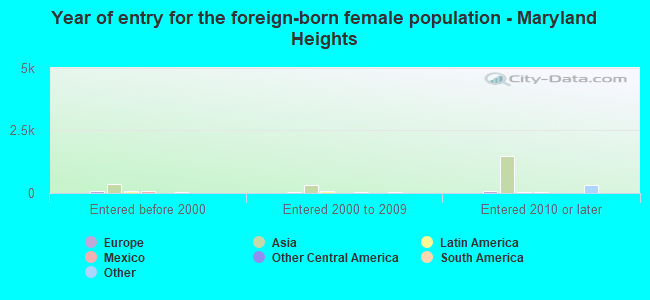
Foreign-born residents in Maryland Heights 5,801 residents are foreign born (16.8% Asia ).
This city:
20.8%Missouri:
4.2%
Marital status for residents in Maryland Heights Marital status - White (Caucasian) population 15 years and over
Males 37.0% Never married48.6% Now married1.5% Separated4.6% Widowed8.4% DivorcedFemales 29.1% Never married43.8% Now married0.4% Separated9.5% Widowed17.2% DivorcedWomen who gave birth in the past 12 months Now married:
89.8% (93)Unmarried:
10.2% (11)
Women who did not give birth in the past 12 months Now married:
41.5% (1,674)Unmarried:
58.5% (2,357)
Marital status - Black or African American population 15 years and over
Males 50.0% Never married35.2% Now married0.0% Separated4.3% Widowed10.5% DivorcedFemales 54.0% Never married24.9% Now married0.0% Separated2.4% Widowed18.8% DivorcedWomen who gave birth in the past 12 months Now married:
85.0% (85)Unmarried:
15.0% (15)
Women who did not give birth in the past 12 months Now married:
19.9% (239)Unmarried:
80.1% (960)
Marital status - Asian population 15 years and over
Males 28.3% Never married68.9% Now married0.0% Separated1.0% Widowed1.8% DivorcedFemales 17.8% Never married76.1% Now married0.0% Separated0.8% Widowed5.3% DivorcedWomen who gave birth in the past 12 months Now married:
100.0% (81)Unmarried:
0.0% (0)
Women who did not give birth in the past 12 months Now married:
75.6% (1,255)Unmarried:
24.4% (404)
Marital status - Native Hawaiian / Pacific Islander population 15 years and over
Males 0.0% Never married100.0% Now married0.0% Separated0.0% Widowed0.0% DivorcedFemales 0.0% Never married100.0% Now married0.0% Separated0.0% Widowed0.0% DivorcedWomen who did not give birth in the past 12 months Now married:
100.0% (13)Unmarried:
0.0% (0)
Marital status - Other race population 15 years and over
Males 49.8% Never married50.2% Now married0.0% Separated0.0% Widowed0.0% DivorcedFemales 63.5% Never married36.5% Now married0.0% Separated0.0% Widowed0.0% DivorcedWomen who gave birth in the past 12 months Now married:
100.0% (19)Unmarried:
0.0% (0)
Women who did not give birth in the past 12 months Now married:
11.8% (24)Unmarried:
88.2% (177)
Marital status - Two or more races population 15 years and over
Males 43.3% Never married46.1% Now married3.4% Separated2.8% Widowed4.4% DivorcedFemales 47.7% Never married35.3% Now married2.2% Separated8.3% Widowed6.6% DivorcedWomen who did not give birth in the past 12 months Now married:
44.1% (166)Unmarried:
55.9% (210)
Marital status - White alone, not Hispanic / Latino population 15 years and over
Males 36.8% Never married48.6% Now married1.5% Separated4.6% Widowed8.5% DivorcedFemales 29.1% Never married43.5% Now married0.4% Separated9.7% Widowed17.3% DivorcedWomen who gave birth in the past 12 months Now married:
89.8% (94)Unmarried:
10.2% (11)
Women who did not give birth in the past 12 months Now married:
40.9% (1,614)Unmarried:
59.1% (2,330)
Marital status - Hispanic or Latino population 15 years and over
Males 52.5% Never married44.7% Now married2.8% Separated0.0% Widowed0.0% DivorcedFemales 42.6% Never married47.2% Now married1.1% Separated6.7% Widowed2.4% DivorcedWomen who did not give birth in the past 12 months Now married:
44.0% (160)Unmarried:
56.0% (204)
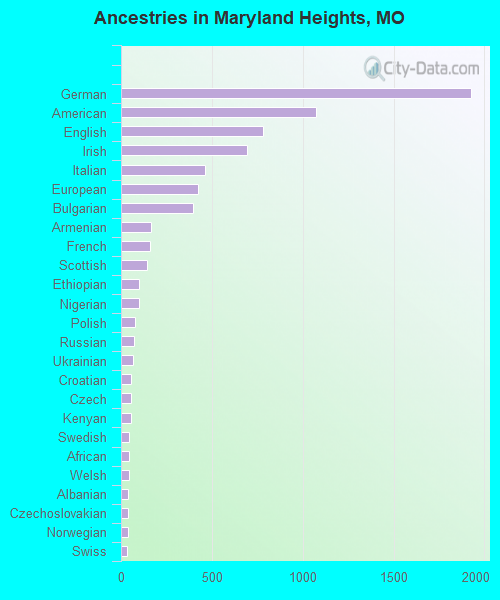
Ancestries in Maryland Heights
1,929 12.4% German1,075 6.9% American783 5.0% English691 4.4% Irish462 3.0% Italian423 2.7% European398 2.6% Bulgarian163 1.0% Armenian159 1.0% French141 0.9% Scottish100 0.6% Ethiopian98 0.6% Nigerian78 0.5% Polish73 0.5% Russian67 0.4% Ukrainian55 0.4% Croatian55 0.4% Czech53 0.3% Kenyan46 0.3% Swedish44 0.3% African43 0.3% Welsh39 0.3% Albanian38 0.2% Czechoslovakian38 0.2% Norwegian35 0.2% Swiss29 0.2% Palestinian28 0.2% Ghanaian27 0.2% Greek22 0.1% Northern European20 0.1% Belgian18 0.1% Scandinavian17 0.1% Latvian12 0.08% Dutch9 0.06% Somali3 0.02% Portuguese2 0.01% British
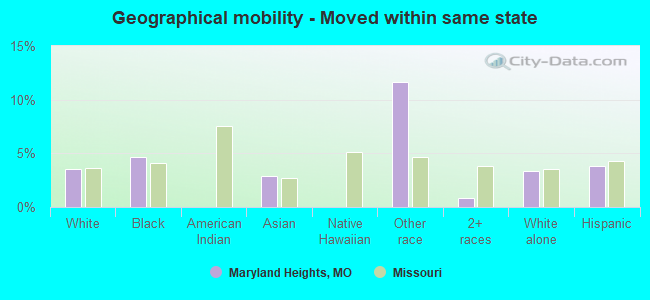
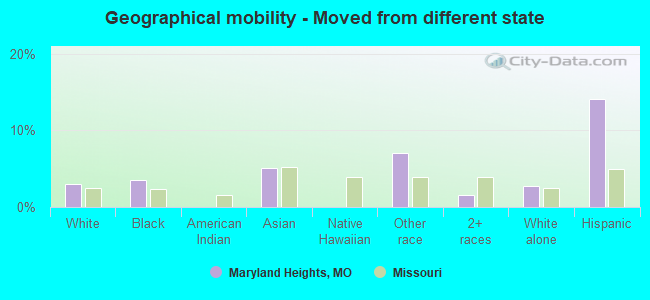
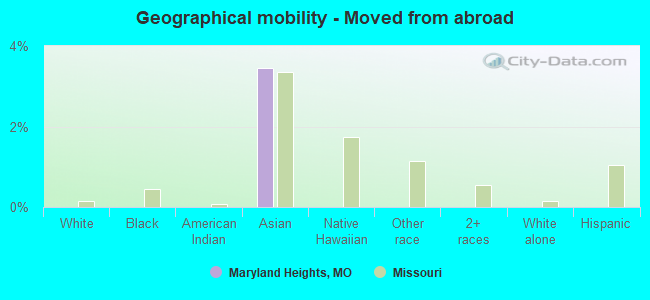
Geographical mobility in Maryland Heights Same house 1 year ago 13,851 85.7% White (Caucasian)2,769 67.5% Black or African American6 100.0% American Indian / Alaska Native3,867 70.7% Asian77 100.0% Native Hawaiian / Pacific Islander384 77.4% Other race1,364 87.4% Two or more races13,747 86.1% White alone, not Hispanic / Latino801 78.8% Hispanic or LatinoMoved within same county 1,229 7.6% White / Caucasian1,004 24.4% Black or African American924 16.9% Asian31 6.2% Other race120 7.7% Two or more races1,216 7.6% White alone, not Hispanic / Latino62 6.1% Hispanic or LatinoMoved within same state 570 3.5% White / Caucasian192 4.7% Black or African American158 2.9% Asian58 11.6% Other race14 0.9% Two or more races534 3.3% White alone, not Hispanic / Latino38 3.8% Hispanic or LatinoMoved from different state 490 3.0% White / Caucasian146 3.6% Black or African American275 5.0% Asian35 7.1% Other race24 1.5% Two or more races437 2.7% White alone, not Hispanic / Latino143 14.1% Hispanic or LatinoMoved from abroad 189 3.5% Asian
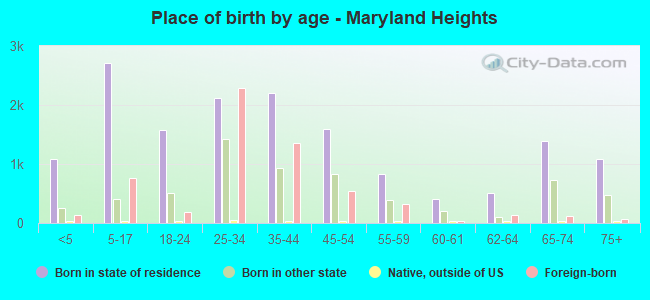
Children Nativity (place of birth) in Maryland Heights
Children under 6 years - Living with two parents Both parents native 864 92.6% Native70 7.4% Foreign-bornBoth parents foreign-born 438 74.4% Native151 25.6% Foreign-bornOne native, one foreign-born parent 75 100.0% NativeChildren under 6 years - Living with one parent Native parent 326 100.0% NativeForeign-born parent 59 100.0% NativeChildren 6 to 17 years - Living with two parents Both parents native 1,457 99.8% Native4 0.2% Foreign-bornBoth parents foreign-born 229 24.0% Native724 76.0% Foreign-bornOne native, one foreign-born parent 98 100.0% NativeChildren 6 to 17 years - Living with one parent Native parent 696 100.0% NativeForeign-born parent 51 70.7% Native21 29.3% Foreign-born
Grandparents responsible for own grandchildren in Maryland Heights
Grandparents (30 to 59 years) White / Caucasian 2 9.8% Responsible for grandchildren15 90.2% Not responsible for grandchildrenBlack or African American 9 63.7% Responsible for grandchildren5 36.3% Not responsible for grandchildrenWhite alone, not Hispanic / Latino 2 10.4% Responsible for grandchildren15 89.6% Not responsible for grandchildrenGrandparents (60 years and over) White / Caucasian 3 2.4% Responsible for grandchildren114 97.6% Not responsible for grandchildrenBlack or African American 13 12.1% Responsible for grandchildren91 87.9% Not responsible for grandchildrenWhite alone, not Hispanic / Latino 3 3.0% Responsible for grandchildren91 97.0% Not responsible for grandchildren